

Starknet is under pressure today, and the move is not coming out of nowhere. The STRK price is trading around $0.082, down on the day, and the chart reflects a market that is still trying to digest a heavy supply event while broader sentiment remains shaky.
The drop looks less like panic and more like a slow reaction to known risks finally hitting the market.
- Token Unlocks Finally Hit the Market
- Altcoins Are Still Stuck in Risk-Off Mode
- The STRK Chart Shows Weak Structure, Not Capitulation
- What’s Next for STRK?
Token Unlocks Finally Hit the Market
The biggest weight on STRK right now comes from its latest token unlock. On December 15, Starknet released around 127 million STRK into circulation, roughly 5% of the circulating supply.
Unlocks like this tend to matter, not because they surprise traders, but because they change the balance between buyers and sellers overnight.
In this case, the market simply did not have enough demand waiting. Liquidity was already thin, and once the new tokens became transferable, selling pressure picked up.
Volume actually fell after the unlock, which is a bad mix. When supply increases and trading activity drops, prices usually slide until a new balance is found. With another scheduled unlock coming in mid-January, traders are clearly cautious about stepping in too early.
Read Also: The Revenue Flippening Is Here: Solana (SOL) Set to Pass Ethereum (ETH)
Altcoins Are Still Stuck in Risk-Off Mode
Altcoins as a whole are struggling. The Fear and Greed Index is sitting deep in fear territory, and Bitcoin dominance keeps creeping higher.
That tells a simple story. Capital is moving toward safety. Institutions are still favoring Bitcoin through ETFs, while Ethereum and smaller Layer-2 tokens are being left behind. In that environment, even solid projects have a hard time attracting fresh money.
For Starknet, this means that positive developments or long-term upgrades are not enough on their own. Without broader risk appetite, most altcoins remain vulnerable to slow bleed rather than sharp reversals.
The STRK Chart Shows Weak Structure, Not Capitulation
From a technical point of view, Starknet does not look strong yet. The STRK price is still sitting below all its key moving averages, which tells the same story the chart has been telling for a while now. The trend hasn’t flipped. Sellers are still in control.
The RSI is drifting close to oversold territory, so selling does look a bit stretched. That can sometimes set the stage for a short bounce, but on its own, it doesn’t mean much. Oversold conditions can stick around longer than people expect.

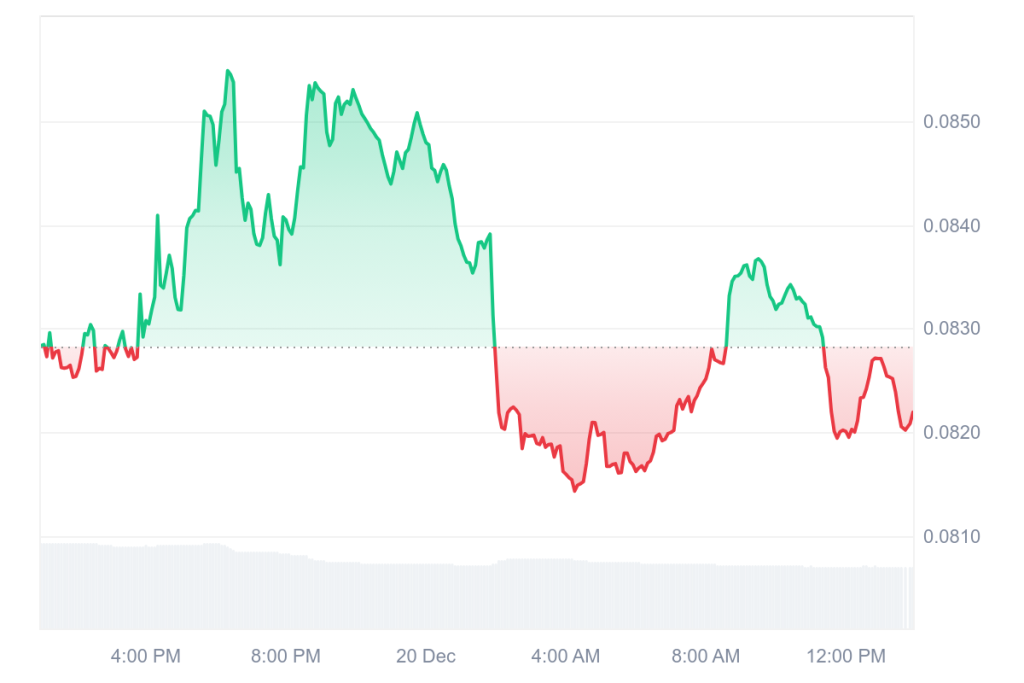
Source: CoinMarketCap/STRK
What’s missing right now is a clear bullish signal. There’s no divergence to indicate momentum is turning, and the price is still hovering uncomfortably close to the $0.079 support zone.
If that level gives way, the downside stays open. If buyers fail to defend that area, the chart leaves room for another leg lower before any meaningful recovery attempt.
What’s Next for STRK?
The STRK price current dip is not about one bad headline. It is the result of supply hitting the market, weak altcoin sentiment, and a chart that has not stabilized yet.
Network progress and ecosystem growth still matter long term, but in the short term, price action is being driven by macro flows and token mechanics.
For now, Starknet remains in a waiting phase. Buyers want confirmation. Sellers are still active. Until that changes, volatility is likely to stay pointed to the downside.
Disclaimer: The information on this page may come from third parties and does not represent the views or opinions of Gate. The content displayed on this page is for reference only and does not constitute any financial, investment, or legal advice. Gate does not guarantee the accuracy or completeness of the information and shall not be liable for any losses arising from the use of this information. Virtual asset investments carry high risks and are subject to significant price volatility. You may lose all of your invested principal. Please fully understand the relevant risks and make prudent decisions based on your own financial situation and risk tolerance. For details, please refer to
Disclaimer.
Related Articles
Algorand Foundation lays off 25% of its staff, ALGO price drops 6% to $0.09
Algorand Foundation announces 25% workforce reduction to address economic uncertainty and market weakness, causing ALGO token price to decline approximately 6%, now trading around $0.09. Despite the staff reduction, network activity remains stable, with quarterly transaction volume growing 4.7%. This restructuring aims to optimize resources and ensure long-term sustainability. Overall, it reflects the pressure and adaptation trends in the crypto market.
GateNews9m ago
Bitcoin Holds Strong at $70,000! On-Chain Data Reveals "Collective Selling Wave," Retail Investors Emerge as Biggest Selling Pressure
Against the backdrop of Middle East geopolitical tensions, Bitcoin has faced a comprehensive sell-off with nearly all coin holders turning to net selling, most notably among retail investors. According to Glassnode data, the cumulative trend score has dropped to 0.04, indicating heavy selling pressure in the market. Small-cap holders and mid-sized investors are showing significant selling intensity, while whales, though reducing their holdings, are doing so at a lower rate. Despite the dismal data, Bitcoin continues to demonstrate resilience against declines.
区块客23m ago
CryptoQuant: Bitcoin and Gold Correlation Falls to Nearly 4-Year Low, Showing Clear Divergence in Trends
The correlation between Bitcoin and gold has fallen to its lowest level since November 2022, showing a clear divergence in their trajectories. Despite Bitcoin's recent rebound to $70,000, bearish pressure is intensifying, and investors need to monitor key support levels and gold price movements to gauge market direction.
GateNews35m ago
XRP breaks through $1.5 neckline, key EMA resistance determines short-term trend, potential to test $2
XRP recently broke through the $1.5 resistance level, creating a new closing high. Analysts point out that the short-term support level is at $1.5, which needs to hold to continue the uptrend. If this level breaks, the $1.42 support can be referenced as an alternative. A breakout above three EMAs is needed to confirm a bullish reversal. Market participants should pay attention to price movement and changes in technical indicators.
GateNews50m ago
Hyperliquid Price Jumps 22% as Commodity Trading Hits Record
Key Insights:
Hyperliquid surged over 20% weekly, driven by record commodity futures trading volumes, especially oil and silver contracts, gaining strong traction among traders.
Whale activity surpassed $3.6 billion in leveraged positions, boosting liquidity and reinforcing upward momentum a
CryptoFrontNews53m ago
Bitcoin Falls Below $70,000: PPI Exceeds Expectations + Powell's Hawkish Stance, Rate Cut Expectations Dampened
On March 19, Bitcoin pulled back to a key support zone due to unexpected U.S. inflation data and hawkish signals from Federal Reserve Chair Powell, declining over 4.6% and currently trading near $70,800. Market expectations for rate cuts have cooled, with the total crypto market cap declining to approximately $2.51 trillion and sentiment remaining cautious. If Bitcoin breaks below $70,000, it could potentially decline further to $65,000. Market momentum is highly dependent on macroeconomic factors.
GateNews59m ago
