On Friday, the strong volatility wave of Bitcoin triggered widespread selling pressure in the market, causing Litecoin (LTC) to plummet by 7.5% within just 5 hours. This downward momentum pushed LTC to a new low at $72.64 before the coin attempted to recover. At the time of recording, LTC is trading around $75.89.
In the past two weeks of trading, Litecoin bulls have completely lost control of the important long-term support zone between $80–$84. Previously, a report from Coin Photon emphasized that this area plays a key role in maintaining LTC’s long-term price structure.
Notably, the report also pointed out that the bulls are weakening significantly, almost exhausted of momentum, and are only maintaining a defensive stance. Even with Litecoin being included in the Bitwise 10 Crypto Index ETF (BITW), it was not enough to generate a significant boost to the price on the trading chart.
Assessing the strength of Litecoin’s next downward trend
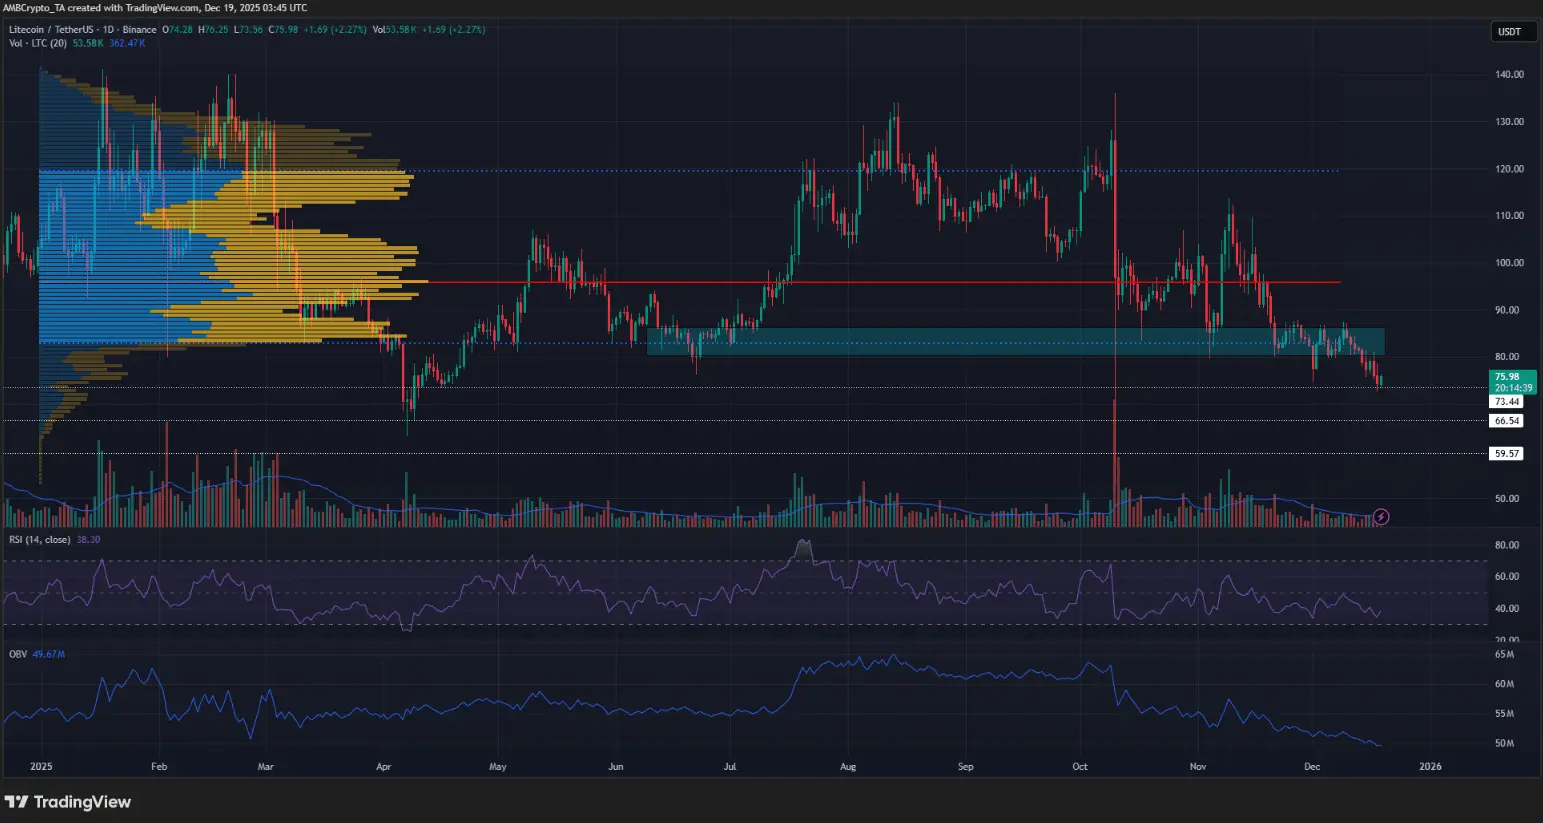 Daily LTC/USDT chart | Source: TradingView Using the Fixed Range Volume Profile tool for the entire 2025, the Value Area High (VAH) and Value Area Low (VAL) are identified at $120 and $83 respectively. After the first week of October, when Litecoin continued trading above the year’s VAH, the market experienced a sharp decline on October 10, marking an important turning point in the trend structure.
The OBV (On-Balance Volume) indicator shows that the supply-demand balance at that time had clearly tilted in favor of the bears, reflecting overwhelming selling pressure. In November, Litecoin entered a period of high volatility and attempted to defend the psychological support zone of $80, but weak demand was insufficient to reverse the downward trend forming.
When the $80 level was officially broken, the situation became more unfavorable for the bulls. The next long-term support zones that the bears might target are at $73.4, $66.5, and deeper at $59.6.
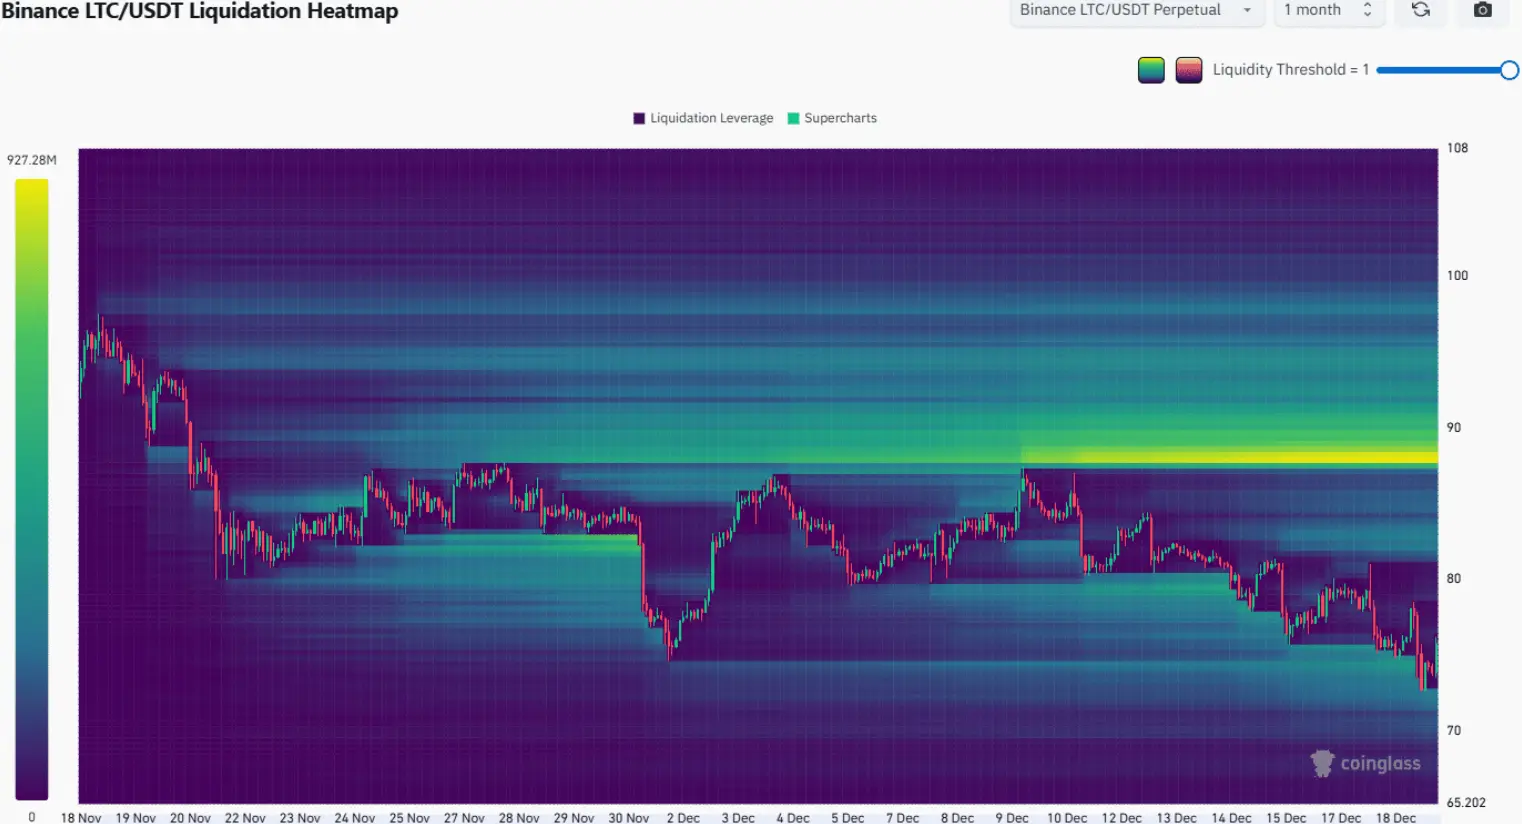 Source: CoinGlass Notably, the monthly liquidation heatmap shows that the liquidity around the $73 zone has been wiped out. In this context, a technical rebound could occur, and the price is likely to be pulled back toward the “magnet” zone of $82–$83, where supply and demand may continue to struggle in the short term.
Less likely scenarios for Litecoin
This is a notable bullish scenario. The $88 zone currently acts as a “liquidity magnet,” where a large concentration of short position liquidations (Short) is focused, potentially attracting the price gradually toward this area. If the overall market sentiment turns positive, triggering a chain reaction of short squeeze effects, LTC could break above $90, thereby reaffirming and strengthening the medium-term bullish trend.
Trader recommendations – Continue to maintain a bearish outlook
This altcoin has just lost a key support zone, signaling a clear market weakening. The main trend and price structure remain entirely bearish, while buying pressure on higher timeframes is almost absent, indicating that the bulls are not yet strong enough to regain control.
In a recovery scenario, the $80–$84 zone is likely to serve as a very strong resistance area that is difficult to conquer. Therefore, traders may consider short-selling on rebounds, with target prices around the support zones of $66 and deeper at $59.
Disclaimer: The information on this page may come from third parties and does not represent the views or opinions of Gate. The content displayed on this page is for reference only and does not constitute any financial, investment, or legal advice. Gate does not guarantee the accuracy or completeness of the information and shall not be liable for any losses arising from the use of this information. Virtual asset investments carry high risks and are subject to significant price volatility. You may lose all of your invested principal. Please fully understand the relevant risks and make prudent decisions based on your own financial situation and risk tolerance. For details, please refer to
Disclaimer.
Related Articles
SHIB Derivatives See 1,549% Jump in Netflows: Is Short Squeeze Brewing? - U.Today
Shiba Inu (SHIB) experienced a 1,549% increase in futures netflows as traders adjusted their positions, with inflows surpassing outflows. Despite a recent price drop, positive on-chain indicators suggest potential for a market rebound if buyers return.
UToday35m ago
鏈上熱到爆、以太幣卻漲不動?專家揭「致命死穴」:恐下探 1,500 美元
CryptoQuant 報告指出,以太坊面臨「採用悖論」,雖然網路活躍度創新高,但幣價卻下滑。若熊市持續,到第三季末以太幣可能跌至 1,500 美元。智能合約活躍度上升與以太幣價格脫鉤,交易所流入量更能反映價格動態。投資需求疲軟,資金持續流失是主要隱憂。
区块客38m ago
英國前首相喊:比特幣是龐氏騙局,川普次子 Eric Trump、Michael Saylor 強力反駁
前英國首相波里斯·強森在《每日郵報》指控比特幣為「龐氏騙局」,引發加密界人士如Eric Trump和Michael Saylor的反擊,強調比特幣的去中心化特性及其正當性。比特幣近期交易價格也突破7.1萬美元。
動區BlockTempo48m ago
彭博社:比特币接近历史级熊市底部,4.5万至5.5万美元或为最终底部区间
彭博社分析认为,比特币接近历史熊市底部,预计4.5万至5.5万美元为最终底部。分析指出,长期技术指标显示比特币低估,市场流动性和成熟度的提升使历史熊市的跌幅逐渐缩小。
GateNews2h ago
今日加密货币恐慌与贪婪指数降至15,市场处于极度恐慌状态
Gate News 消息,3月15日,据 Alternative.me 数据显示,今日加密货币恐慌与贪婪指数降至15,较昨日的16进一步下滑,市场持续处于「极度恐慌状态」。
GateNews4h ago
Bitcoin Treasury Firms on Track to Absorb 10x Daily Mined Bitcoin Supply, Industry Leaders Say
Corporate demand for bitcoin is accelerating as publicly traded companies tap stock and preferred-share financing to accumulate supply, a trend some industry leaders say could significantly increase corporate demand for newly mined coins and potentially influence market dynamics.
Wall Street
Coinpedia4h ago