Bitcoin plummeted from $89,000 all the way down to a low of $84,450, with $550 million worth of positions liquidated within 24 hours. Behind this decline, the options market is brewing a bigger storm. Approximately $23 billion in contracts will expire on December 26, accounting for more than half of Deribit’s open interest, with around $1.4 billion in put options clustered near the $85,000 strike price.
The Magnet Effect of Options Expiry and Market Maker Hedging
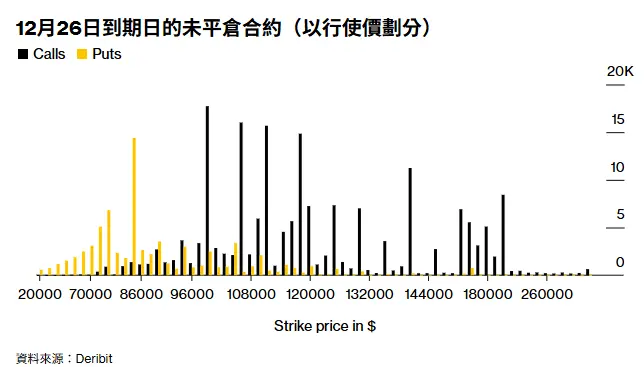
(Source: Deribit)
The “magnet effect” (Pin Risk) before options expiration is a classic phenomenon in derivatives markets. When a large volume of options concentrates at a certain strike price, market makers’ hedging behavior tends to push the spot price toward that strike. STS Digital estimates that around $1.4 billion in open put options are clustered near the $85,000 strike, a scale sufficient to significantly impact the spot market.
The key lies in the hedging logic of market makers. When a large number of puts are sold, market makers need to hedge risk by selling spot. As expiration approaches, if the spot price nears the strike, market makers will increase hedging activity, further driving the spot price down. This self-reinforcing feedback loop often creates a “gravity well” around the strike price, pulling the price toward it.
The Triple Threat of $85,000 Put Options
$1.4 Billion in Open Contracts: Market makers must continuously adjust hedges before expiry, creating structural selling pressure.
Panic Amplification: The Fear & Greed Index at 22 indicates extreme fear, leading investors to believe in bearish scenarios.
ETF Capital Outflows: The US Bitcoin ETF assets have shrunk from $119.4 billion to $112.6 billion, weakening buying support.
Positions near expiry around December 26 reflect market divergence. Call options are concentrated around the $100,000 to $120,000 strikes, suggesting a market still optimistic about a year-end rebound. If Bitcoin can break through $90,000 and continue upward, these calls will become in-the-money, forcing market makers to buy spot to hedge, creating a positive cycle. However, current prices hover around $85,000, still about 18% below $100,000. Achieving such a rebound in less than a week is highly unlikely.
What does a $23 billion contract size mean? It’s roughly 1.3% of Bitcoin’s current market cap. During options expiry week, such large volumes often trigger significant price volatility. Historical data shows that Bitcoin’s volatility tends to increase by 50-100% around large options expiries. This volatility can go either way—upward if bulls dominate, downward if bears take control. Based on current market structure, bears hold short-term dominance.
Distorted CPI Data Weakens Rebound Momentum
On the surface, November US CPI data should be positive. The overall annual inflation rate at 2.7% is below the expected 3.1%, and core CPI at 2.6% is also below forecasts. This lower-than-expected inflation data should theoretically boost expectations of Fed rate cuts, benefiting risk assets. The S&P 500 indeed ended a four-day losing streak, rising nearly 1%.
But Bitcoin’s reaction was the opposite, crashing from $89,000 to $84,450. This divergence reflects the crypto market’s skepticism about CPI data credibility. Due to the longest government shutdown in history (43 days), the US Bureau of Labor Statistics canceled the October inflation report and estimated much of November’s data through “imputation.” Several economists warn that this report may contain significant distortions.
JPMorgan senior economist Michael Hanson said that the lower-than-expected data “may imply that the BLS assumed some prices remained unchanged,” leading to a “substantial downward bias,” which could be revised in the coming months. KPMG chief economist Diane Swonk pointed out: “Some prices that should have risen actually fell, and some that should have fallen rose. The results are confusing.”
Barclays inflation strategist Jon Hill bluntly stated: “The market isn’t buying it because the data ‘doesn’t pass the smell test.’ Without clear explanations of how the BLS made these statistical decisions, it’s hard to take it at face value.” This distrust in official data causes investors to prefer to wait and see rather than heavily position based on potentially distorted figures.
For Bitcoin, this uncertainty is a double whammy. If CPI data genuinely reflects a slowdown in inflation, the Fed might accelerate rate cuts, which is bullish for Bitcoin. But if the data is distorted and later revised upward, the Fed could stay hawkish, bearish for Bitcoin. In this “Schrödinger’s cat” state, the market prefers to stay on the sidelines.
Year-End Effect and Liquidity Traps
Options expiry combined with the year-end creates a perfect liquidity trap. US Bitcoin ETF assets have fallen from $119.4 billion last month to $112.6 billion, and Ethereum ETFs have shrunk by $1.8 billion, reflecting cautious investor sentiment at year’s end. Reduced ETF inflows weaken a key liquidity pillar.
Year-end is a traditional window for institutional investors to lock in annual gains and reduce risk exposure. Many fund managers cut trading activity in the last two weeks of December or take early vacations. This seasonal liquidity drought makes markets more susceptible to large orders. When $23 billion in options expire and trigger hedging in a low-liquidity environment, price swings can be significantly amplified.
The Fear & Greed Index remains at an extreme fear level of 22, and altcoin season index has dropped to a low of 16. These sentiment indicators show market confidence is near collapse. In such an environment, any negative news can trigger panic selling, while positive news may be seen as a “get out of dodge” rebound opportunity.
The overall crypto market cap has declined 0.91% to $2.88 trillion, indicating this is not just a Bitcoin issue but systemic pressure across the entire crypto market. Ethereum also briefly fell below $2,800, with $550 million liquidated within 24 hours. Such large liquidations often signal an acceleration of the trend.
For traders, the coming week is highly risky. If Bitcoin falls below $85,000 and remains weak, the $85,000 puts will go in-the-money, forcing market makers to sell large amounts of spot to hedge, potentially accelerating a drop to $80,000 or lower. Conversely, if it holds above $85,000 and rebounds above $90,000, bears may be forced to cover, possibly triggering a short-term rebound to $95,000. But based on current market structure, sentiment indicators, and capital flows, the probability of the latter is significantly lower than the former.