Litecoin (LTC) continues to face a strong sell-off wave, trading below the $78 level on Tuesday, extending a decline for seven consecutive sessions after failing to break through a key resistance zone. As social media interest gradually cools and momentum indicators simultaneously signal more negative trends, LTC’s short-term outlook remains clouded by downside risks, with downward pressure dominating.
Decreased social media interest puts pressure on Litecoin’s price
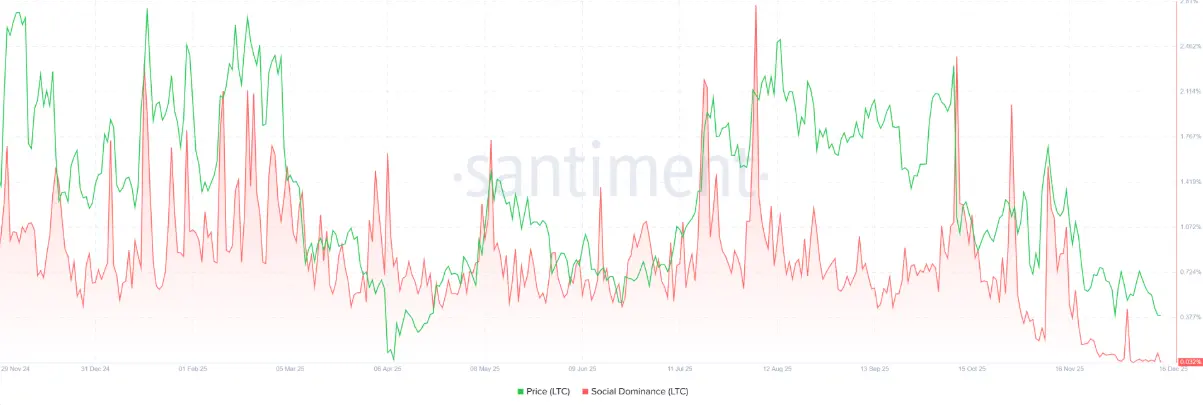
Santiment’s Social Dominance index for Litecoin is signaling a clear downtrend. This measure reflects the proportion of discussions related to LTC across cryptocurrency media and has been weakening since early December. By Tuesday, the index dropped to its lowest point of the year at 0.032%, indicating waning market interest in Litecoin and a more cautious investor sentiment.
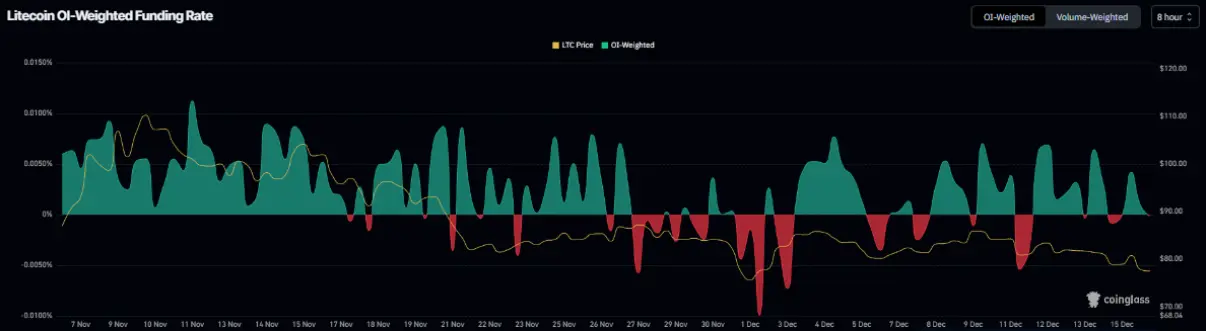
 LTC Social Dominance Index | Source: Santiment In the derivatives market, data also align with this negative scenario. According to OI-Weighted Funding Rate statistics from Coinglass, the number of traders betting on further declines in LTC price currently exceeds those expecting a recovery.
Notably, the funding rate has turned negative since Tuesday, currently at -0.002%, reflecting that short positions are dominant and paying fees to long positions. Historically, whenever Litecoin’s funding rate turns negative, the price tends to experience significant drops, indicating that selling pressure continues to dominate market momentum.
 LTC OI-Weighted Funding Rate | Source: Coinglass## Litecoin Price Forecast: Bears are in control of momentum
Litecoin’s price failed to break out after being rejected at the 38.20% Fibonacci retracement zone around $84.63 on December 10. Subsequently, LTC entered a sharp correction of nearly 9%, forming a sequence of six consecutive daily red candles before testing the important support zone on the weekly chart at $77.19 on Monday. As of Tuesday, Litecoin’s price is fluctuating around $77.51.
In a negative scenario, if LTC continues to weaken and closes below the $77.19 support level on the daily chart, selling pressure could intensify, pushing the price further down to the next support zone at $66.51.
 Daily LTC/USDT Chart | Source: TradingView Technical indicators are currently clearly favoring the bears. The daily RSI has fallen to 37, below the neutral 50 level, and shows no signs of forming a bottom, indicating that bearish momentum is prevailing. Meanwhile, MACD has confirmed a bearish crossover on Monday, further reinforcing the short-term negative outlook.
Conversely, if the $77.19 support zone is successfully defended, Litecoin could trigger a technical rebound, with an immediate target around $84.63 — corresponding to the 38.20% Fibonacci retracement level.
Disclaimer: The information on this page may come from third parties and does not represent the views or opinions of Gate. The content displayed on this page is for reference only and does not constitute any financial, investment, or legal advice. Gate does not guarantee the accuracy or completeness of the information and shall not be liable for any losses arising from the use of this information. Virtual asset investments carry high risks and are subject to significant price volatility. You may lose all of your invested principal. Please fully understand the relevant risks and make prudent decisions based on your own financial situation and risk tolerance. For details, please refer to
Disclaimer.
Related Articles
Bitcoin Is Entering the Best Buy Zone of This Cycle, Analyst Explains His Bullish Declaration
Bitcoin is entering the best buy zone of this cycle.
The analyst explains the reasoning behind his bullish declaration.
Can BTC surge to hit $200,000 following a successful buying phase?
The crypto market seems to be heading into a strong
CryptoNewsLand12m ago
BTC and ETH Reclaim Top Spots in Trending Cryptocurrencies List
BTC and ETH lead the trending cryptocurrency rankings, while SOL, XRP, and PEPE follow. Their prices remain volatile amid changes in gold and silver values, geopolitical tensions, and impending inflation data influencing investor behavior.
TheNewsCrypto23m ago
DeFi Lending Collapses in Cryptocurrency Space When Collateral Asset Prices Fall
DeFi lending protocols in the cryptocurrency sector have experienced a sharp decline, with the total market value decreasing by approximately 45 billion USD since October last year.
According to data from Artemis, the total amount of deposits on these platforms has decreased by 36%, from a peak of 125 billion USD in October to just 79 billion USD.
TapChiBitcoin30m ago
Bernstein: 60% of Bitcoin Unmoved for Over a Year, Long-Term Holders Remain Steadfast
A Bernstein report shows that Bitcoin retail holders have recently engaged in panic selling, but long-term holders remain steadfast, with over 60% of Bitcoin unmoved for more than a year, demonstrating confidence in Bitcoin and its characteristics as a store of value.
GateNews53m ago
Saylor Hints at Buying More Bitcoin as New Analysis States BTC Is Years Away From New ATH
Michael Saylor hints at buying more Bitcoin as new analysis comes to light.
Expert believes BTC is years away from a new ATH.
Bearish vs bullish sentiments clash.
The crypto market is in higher spirits this week as the price of pioneer crypto
CryptoNewsLand1h ago
Shiba Inu Death Cross Emerges as SHIB Price Slips Below Key Support
Key Insights
Shiba Inu confirms a death cross on the daily chart as the short term moving average drops below the long term average.
Over 112 billion SHIB moved to exchanges within two days, increasing market attention on potential selling activity and near term price pressure.
SHIB
CryptoFrontNews1h ago
