2025 BTS Price Prediction: Expert Analysis and Market Forecast for the Year Ahead

Introduction: BitShares Market Position and Investment Value
BitShares (BTS), an industrial-grade decentralized platform focused on high-performance financial smart contracts, has been operating since 2014. As of 2025, BitShares has achieved a market capitalization of approximately $2,921,862, with a circulating supply of about 2.71 billion BTS tokens, currently trading at $0.0010781. This asset, recognized for its practicality and governance authority in the decentralized finance ecosystem, continues to play an increasingly important role in enabling voting mechanisms, reward distribution, and transaction fee payments within its blockchain network.
This comprehensive analysis will examine BitShares' price trajectories through 2030, combining historical performance patterns, market supply-demand dynamics, ecosystem development, and macroeconomic factors to provide investors with professional price forecasts and actionable investment strategies. The analysis will offer data-driven insights for navigating BTS's market opportunities across the coming years.
I. BTS Price History Review and Market Status
BTS Historical Price Evolution
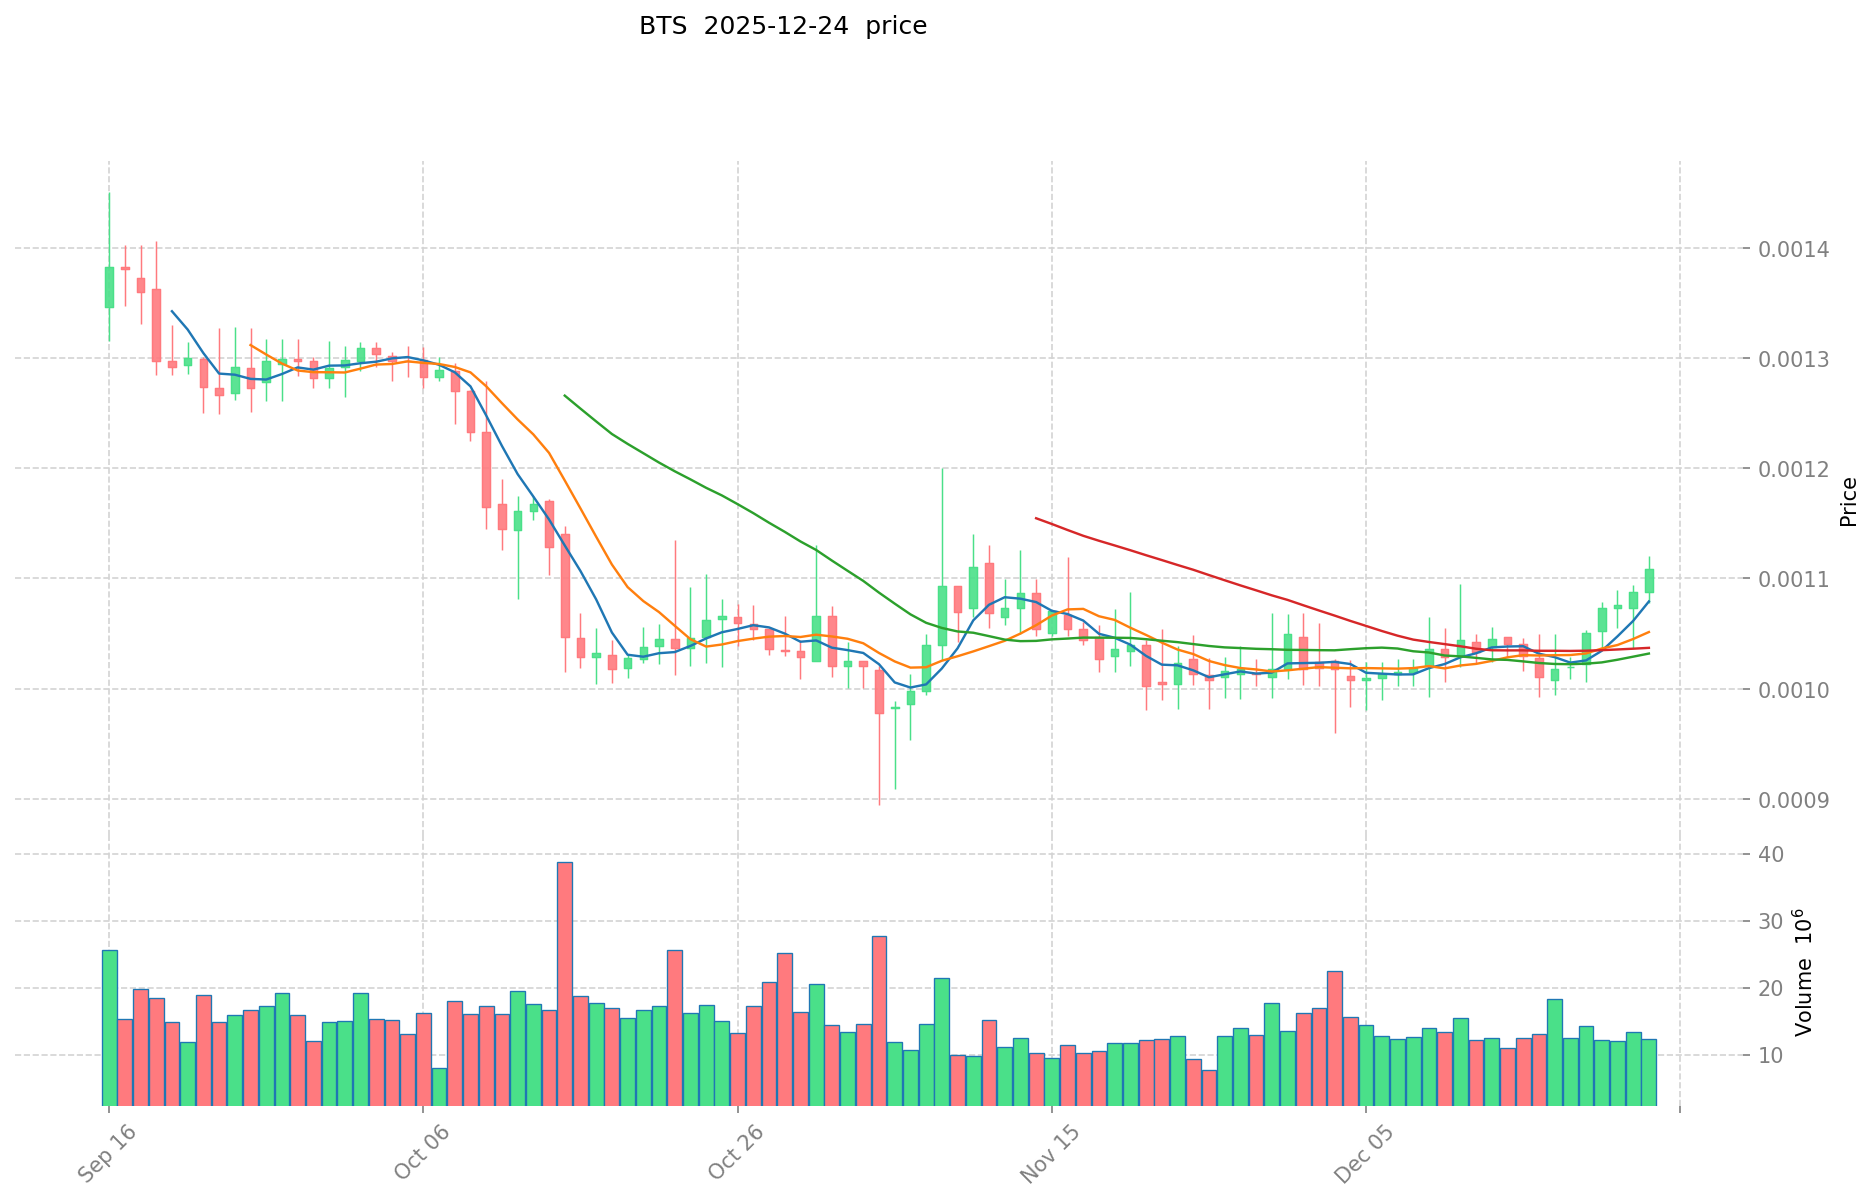
BitShares (BTS) has experienced significant price fluctuations since its launch on July 18, 2014, at an initial price of $0.01034. The token reached its all-time high of $0.923921 on January 3, 2018, during the peak of the 2018 bull market. However, the token subsequently entered a prolonged downtrend, declining substantially over the following years. Most recently, BTS touched an all-time low of $0.0000032 on September 18, 2025, reflecting the challenging market conditions faced by the project.
BTS Current Market Status
As of December 24, 2025, BTS is trading at $0.0010781, representing a modest recovery from its recent lows. The token exhibits the following market characteristics:
Price Performance:
- 1-hour change: -1.95%
- 24-hour change: +0.19%
- 7-day change: +5.39%
- 30-day change: +6.54%
- 1-year change: -28.54%
Market Capitalization and Supply Metrics:
- Current market cap: $2,921,862.30
- Fully diluted valuation: $3,230,253.27
- Circulating supply: 2,710,195,991.53 BTS (75.27% of total supply)
- Total supply: 2,996,246,427.41 BTS
- Maximum supply: 3,600,570,502 BTS
- Market dominance: 0.00010%
Trading Activity:
- 24-hour trading volume: $13,527.99
- Current holders: 1,725 addresses
- Market ranking: #1,884
The token demonstrates limited liquidity and market engagement, with a small holder base reflecting the niche position of the BitShares blockchain ecosystem. The recent price recovery over the 7-day and 30-day periods suggests some stabilization following the September 2025 bottom, though the substantial 1-year decline indicates sustained headwinds in the broader market environment.
Click to view current BTS market price
BTS Market Sentiment Indicator
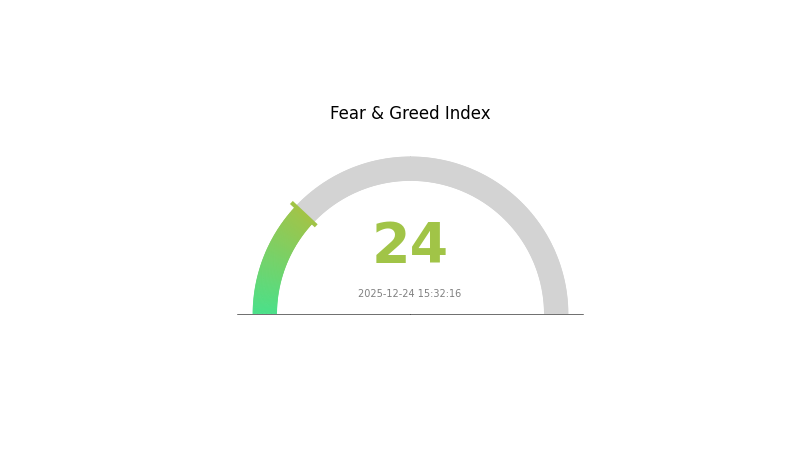
2025-12-24 Fear and Greed Index: 24(Extreme Fear)
Click to view current Fear & Greed Index
The cryptocurrency market is experiencing extreme fear sentiment today, with the Fear and Greed Index dropping to 24, signaling significant investor anxiety. This level typically reflects strong market pessimism, widespread selling pressure, and heightened risk aversion among traders. During such periods, volatility tends to increase substantially, and many assets trade below their perceived intrinsic value. However, extreme fear often presents contrarian buying opportunities for long-term investors who maintain conviction in their strategies. Market participants should remain cautious, conduct thorough due diligence, and avoid making impulsive decisions driven by emotional reactions to short-term price movements.
BTS Holdings Distribution
The address holdings distribution represents the concentration of BTS tokens across different wallet addresses, serving as a critical indicator for assessing the decentralization level and market structure health of the network. By analyzing the proportion of tokens held by top addresses, this metric reveals potential risks related to token concentration, market manipulation, and the overall governance resilience of the BTS ecosystem.
Currently, the BTS network exhibits a balanced distribution pattern that reflects a relatively healthy decentralization structure. The absence of extreme concentration in a single address or small group of addresses suggests that no individual entity maintains disproportionate control over the token supply. This distribution characteristic is favorable for network stability, as it reduces the likelihood of sudden market shocks triggered by large-scale token movements from concentrated holders. The current holdings landscape indicates that BTS maintains sufficient decentralization to support organic market participation and price discovery mechanisms.
From a market structure perspective, the existing address distribution pattern demonstrates resilience against potential price manipulation risks. When token holdings are dispersed across numerous addresses rather than concentrated in the hands of a few entities, the market becomes more resistant to coordinated dumping or artificial price suppression. This distributed model encourages broader participation and creates a more robust foundation for sustainable price movements driven by genuine market sentiment rather than whale-driven volatility. The current decentralization level reflects a maturing token ecosystem capable of supporting institutional and retail participants simultaneously.
Click to view current BTS Holdings Distribution

| Top | Address | Holding Qty | Holding (%) |
|---|
II. Core Factors Affecting BTS Future Price
Supply Mechanism
-
Network Participation Impact: As more participants join the BitShares network, BTS value has the potential to increase because blocks can be verified more quickly. The utility of BTS tokens directly correlates with network adoption and transaction volume.
-
Historical Performance: During its first four years, BTS increased 10 times from its initial price, demonstrating growth potential. However, since 2014, price fluctuations have been relatively modest, with BTS maintaining characteristics of a comparatively stable cryptocurrency with low volatility.
-
Current Market Status: As of the latest data, BTS is trading at $0.0071 USD, significantly below its historical peak of $0.9167 USD and below its initial price of $0.01034 USD. The current circulating market cap stands at approximately $21.45 million USD.
Macro Economic Environment
-
Competitive Pressure: Other cryptocurrencies, particularly those directly competing with BTS such as Ethereum and EOS, impact BTS price movements. The intense market competition requires BTS to continuously improve its technical standards and user experience to maintain competitiveness.
-
Overall Digital Currency Market Sentiment: BTS price is influenced by the broader digital currency market conditions and investor sentiment. Market fluctuations and investor emotions play important roles in determining short-term price movements.
-
Transaction Volume Impact: The trading volume of cryptocurrencies produces both positive and negative effects on BTS value. Higher transaction activity generally supports price stability and liquidity.
Technology Development and Ecosystem Building
-
Delegated Proof of Stake (DPoS) Consensus Mechanism: BitShares employs a unique DPoS mechanism that enhances network security and efficiency. This mechanism allows BTS holders to participate in network governance by electing delegates, enabling users to directly influence platform development decisions and increase community engagement.
-
Transaction Speed and Cost Advantages: Compared to Bitcoin and traditional digital currencies, BTS offers significant advantages in transaction speed and fees. Transaction confirmation typically occurs within seconds rather than minutes, and transaction fees are relatively low, making BTS particularly suitable for frequent trading scenarios and small-value transactions.
-
Ecosystem Expansion Potential: BTS can expand its market share through collaboration with other blockchain projects and development of new application scenarios. Such strategies would increase BTS utilization rates and attract additional users and investors, thereby improving overall liquidity and network value.
Three, 2025-2030 BTS Price Forecast
2025 Outlook
- Conservative Forecast: $0.00095 - $0.00110
- Neutral Forecast: $0.00110 - $0.00145
- Optimistic Forecast: $0.00145 - $0.00162 (requires sustained market recovery and increased adoption)
2026-2028 Mid-Term Outlook
- Market Phase Expectation: Consolidation and gradual recovery phase with moderate volatility
- Price Range Forecast:
- 2026: $0.00103 - $0.00144
- 2027: $0.00084 - $0.00185
- 2028: $0.00111 - $0.00177
- Key Catalysts: Ecosystem development expansion, institutional adoption growth, and improving market sentiment recovery
2029-2030 Long-Term Outlook
- Base Case: $0.00139 - $0.00177 (assumes steady ecosystem adoption and moderate market conditions)
- Optimistic Case: $0.00177 - $0.00217 (assumes accelerated technology adoption and positive regulatory environment)
- Transformative Case: $0.00217+ (extreme favorable conditions including breakthrough adoption metrics and market-wide institutional inflows)
- 2030-12-31: BTS is projected to trade within the $0.00097 - $0.00217 range, reflecting accumulated gains of approximately 60% from current baseline levels
| 年份 | 预测最高价 | 预测平均价格 | 预测最低价 | 涨跌幅 |
|---|---|---|---|---|
| 2025 | 0.00162 | 0.0011 | 0.00095 | 1 |
| 2026 | 0.00144 | 0.00136 | 0.00103 | 26 |
| 2027 | 0.00185 | 0.0014 | 0.00084 | 30 |
| 2028 | 0.00177 | 0.00163 | 0.00111 | 50 |
| 2029 | 0.00177 | 0.0017 | 0.00139 | 57 |
| 2030 | 0.00217 | 0.00173 | 0.00097 | 60 |
BitShares (BTS) Professional Investment Strategy Report
IV. BTS Professional Investment Strategy and Risk Management
BTS Investment Methodology
(1) Long-term Holding Strategy
- Target Audience: Investors seeking exposure to decentralized financial infrastructure with governance participation rights
- Operational Recommendations:
- Accumulate BTS during market downturns when prices are below historical averages, leveraging dollar-cost averaging to reduce entry point risk
- Participate in network governance by voting with held BTS tokens, aligning with community-driven protocol decisions
- Hold tokens in secure wallets to maintain full custody and eligibility for potential network rewards and airdrops
(2) Active Trading Strategy
- Technical Analysis Tools:
- Moving Averages (MA): Use 20-day and 50-day moving averages to identify trend reversals and support/resistance levels for BTS/USD pairs
- Relative Strength Index (RSI): Monitor RSI readings above 70 (overbought) and below 30 (oversold) to time entry and exit points
- Wave Operation Key Points:
- Execute buy positions when BTS consolidates near support levels, targeting 5-10% gains over 2-4 week periods
- Take profits at resistance zones and maintain stop-losses at 3-5% below entry prices to limit downside exposure
BTS Risk Management Framework
(1) Asset Allocation Principles
- Conservative Investors: 1-3% allocation to BTS as a small-cap alternative asset
- Active Investors: 3-8% allocation with active trading and rebalancing strategies
- Professional Investors: 5-15% allocation with hedging strategies and governance participation
(2) Risk Hedging Solutions
- Portfolio Diversification: Combine BTS holdings with more established blockchain assets and traditional investments to reduce concentration risk
- Profit-Taking Strategy: Systematically convert 20-30% of BTS gains into stablecoins at each 20% price appreciation to lock in profits
(3) Secure Storage Solutions
- Hardware Wallet Method: Store majority of BTS holdings offline in hardware wallets for maximum security against hacking and theft
- Exchange Trading Account: Maintain small BTS amounts on Gate.com for active trading while keeping long-term holdings in secure wallets
- Security Precautions: Enable multi-factor authentication, use strong passwords, never share private keys, and regularly verify wallet addresses before transfers
V. BTS Potential Risks and Challenges
BTS Market Risk
- Low Liquidity Risk: With 24-hour trading volume of approximately $13,528 USD, BTS faces significant price impact from large trades, potentially causing slippage for institutional-sized positions
- Price Volatility: Historical performance shows a -28.54% decline over the past year, indicating substantial drawdown risk for holders who entered at recent peaks
- Market Capitalization Concentration: Ranked 1884 by market cap at approximately $3.23 million, BTS remains a micro-cap asset vulnerable to pump-and-dump schemes and rapid price collapses
BTS Regulatory Risk
- Evolving Legal Status: Regulatory uncertainty regarding decentralized platform tokens may lead to restrictions in major jurisdictions, potentially limiting market access and adoption
- Government Oversight: Increasing scrutiny of blockchain-based financial platforms could result in compliance requirements that increase operational costs and governance complexity
- Exchange Delisting Risk: Regulatory pressure on exchanges could reduce BTS trading pairs and liquidity, making it difficult to enter or exit positions
BTS Technology Risk
- Protocol Obsolescence: Rapid development in competing blockchain platforms offering superior performance could reduce BTS network adoption and token utility
- Development Velocity: Slower development cycles compared to established competitors may limit feature additions and security improvements
- User Adoption Challenges: Limited developer ecosystem and smaller user base increase the risk of network effects failing to materialize, potentially leading to declining token value
VI. Conclusion and Action Recommendations
BTS Investment Value Assessment
BitShares operates as an industrial-grade decentralized platform emphasizing high-performance financial smart contracts. While BTS offers genuine utility through voting rights, network governance, and transaction fee mechanisms, the token faces significant headwinds including micro-cap market positioning, low trading liquidity, and declining year-over-year performance (-28.54%). The project's long-term viability depends on its ability to differentiate from established competitors and attract institutional participation in its decentralized finance offerings. Current market conditions suggest BTS remains a speculative, high-risk asset suitable only for investors with significant risk tolerance and conviction in the project's technical advantages.
BTS Investment Recommendations
✅ Beginners: Start with minimal allocations (0.5-1% of portfolio) through Gate.com with clear stop-losses at 3-5% below entry price; focus on understanding the platform's unique value proposition before increasing exposure
✅ Experienced Investors: Implement systematic accumulation during weakness using technical analysis tools; participate in governance voting to maximize utility; consider 3-8% portfolio allocation with active rebalancing based on technical signals
✅ Institutional Investors: Conduct due diligence on development roadmap and competitive positioning; negotiate significant position sizes with Gate.com institutional services; implement hedging strategies due to limited liquidity depth
BTS Trading Participation Methods
- Direct Exchange Trading: Trade BTS pairs on Gate.com platform with real-time price discovery and immediate settlement capabilities for active trading strategies
- Spot Holdings: Purchase and hold BTS for medium to long-term positions, storing securely in offline wallets while maintaining small amounts on Gate.com for governance participation
- Dollar-Cost Averaging: Implement systematic buying schedules regardless of price to reduce entry point risk and accumulate positions over extended timeframes
Cryptocurrency investments carry extreme risk. This report does not constitute investment advice. Investors should make decisions based on personal risk tolerance and are strongly encouraged to consult professional financial advisors. Never invest more capital than you can afford to lose completely.
FAQ
What is the current value of BTS?
The current value of 1 BTS is $0.001131, with a 24-hour increase of 2.73%. BTS remains a utility token in the BitShares blockchain ecosystem, reflecting ongoing market dynamics and network activity.
What factors influence BTS price movements?
BTS price is influenced by market sentiment, trading volume, technological developments, and user adoption trends. Network activity and broader crypto market conditions also impact price movements significantly.
Is BTS a good investment for 2024-2025?
BTS shows limited growth potential in the near term, with predictions indicating a downward trend. Long-term prospects remain uncertain, making it a high-risk investment requiring careful consideration before committing capital.
What is the historical price performance of BTS?
BTS has experienced a -58.57% decline over the past year, with a 52-week price range between 2.32 and 6.40. The cryptocurrency has shown significant volatility, reflecting broader market dynamics and investor sentiment shifts in the digital asset space.
What are the risks of investing in BTS?
BTS cryptocurrency involves market volatility, liquidity risks, and regulatory uncertainty. Price fluctuations can be dramatic. Always research thoroughly and invest only what you can afford to lose.
Share
Content
Introduction: BitShares Market Position and Investment Value
I. BTS Price History Review and Market Status
II. Core Factors Affecting BTS Future Price
Three, 2025-2030 BTS Price Forecast
IV. BTS Professional Investment Strategy and Risk Management
V. BTS Potential Risks and Challenges
VI. Conclusion and Action Recommendations
FAQ
How to Buy Cryptocurrency


Trending Cryptocurrencies


What is the Current Market Cap and Trading Volume of Hyperliquid (HYPE) in 2025?

ADX vs LINK: Comparing Two Leading Oracle and Data Solutions for Blockchain Applications

BTRST vs AAVE: Comparing Two Leading Governance Tokens in the DeFi Ecosystem

ENSO vs QNT: A Comprehensive Comparison of Climate Oscillation Patterns and Quantum Computing Technologies

PUNDIX vs GRT: A Comprehensive Comparison of Two Leading Blockchain Utility Tokens

G vs LINK: A Comprehensive Comparison of Two Leading Blockchain Protocols and Their Impact on Decentralized Finance

Is Parex Ecosystem (PRX) a good investment?: A Comprehensive Analysis of Performance, Tokenomics, and Market Potential
Is FEAR (FEAR) a good investment?: A Comprehensive Analysis of Risk Factors, Market Potential, and Future Prospects for 2024 and Beyond

Is Frok AI (FROKAI) a good investment?: A Comprehensive Analysis of Market Potential, Risk Factors, and Future Prospects

GPUAI vs XRP: Which Cryptocurrency Offers Better Investment Potential in the AI and Blockchain Era?
MA vs ETC: A Comprehensive Comparison of Moving Averages and Exponential Time Constants in Technical Analysis