ADX vs LINK: Comparing Two Leading Oracle and Data Solutions for Blockchain Applications
Introduction: ADX vs LINK Investment Comparison
In the cryptocurrency market, the comparison between ADX and LINK has always been a topic investors cannot avoid. The two not only show significant differences in market cap ranking, application scenarios, and price performance, but also represent different positioning of crypto assets. ADX (ADX): Since its launch in 2017, it has gained market recognition by leveraging blockchain technology and programmatic advertising to create transparent, fraud-protected ad-buying experiences for web3 advertisers. LINK (LINK): Since its inception in 2017, it has been recognized as an essential infrastructure token in the blockchain ecosystem, serving as payment for Chainlink node operators to retrieve and format off-chain data into blockchain-readable formats while ensuring network uptime. This article will conduct a comprehensive analysis of ADX vs LINK investment value comparison around historical price trends, supply mechanisms, market adoption, and ecosystem development, while attempting to answer the question investors care most about:
"Which is the better buy right now?"
Comparative Market Analysis Report: AdEx (ADX) and Chainlink (LINK)
I. Historical Price Comparison and Current Market Status
Price Performance Overview
AdEx (ADX) Historical Metrics:
- All-Time High (ATH): $3.49 (January 9, 2018)
- All-Time Low (ATL): $0.03511504 (March 13, 2020)
- Historical Decline: From ATH to current price represents a 70.6% decrease from peak valuation
Chainlink (LINK) Historical Metrics:
- All-Time High (ATH): $52.70 (May 10, 2021)
- All-Time Low (ATL): $0.148183 (November 29, 2017)
- Historical Trajectory: Demonstrates significant volatility across market cycles with substantial gains from ICO pricing
Current Market Position (December 21, 2025)
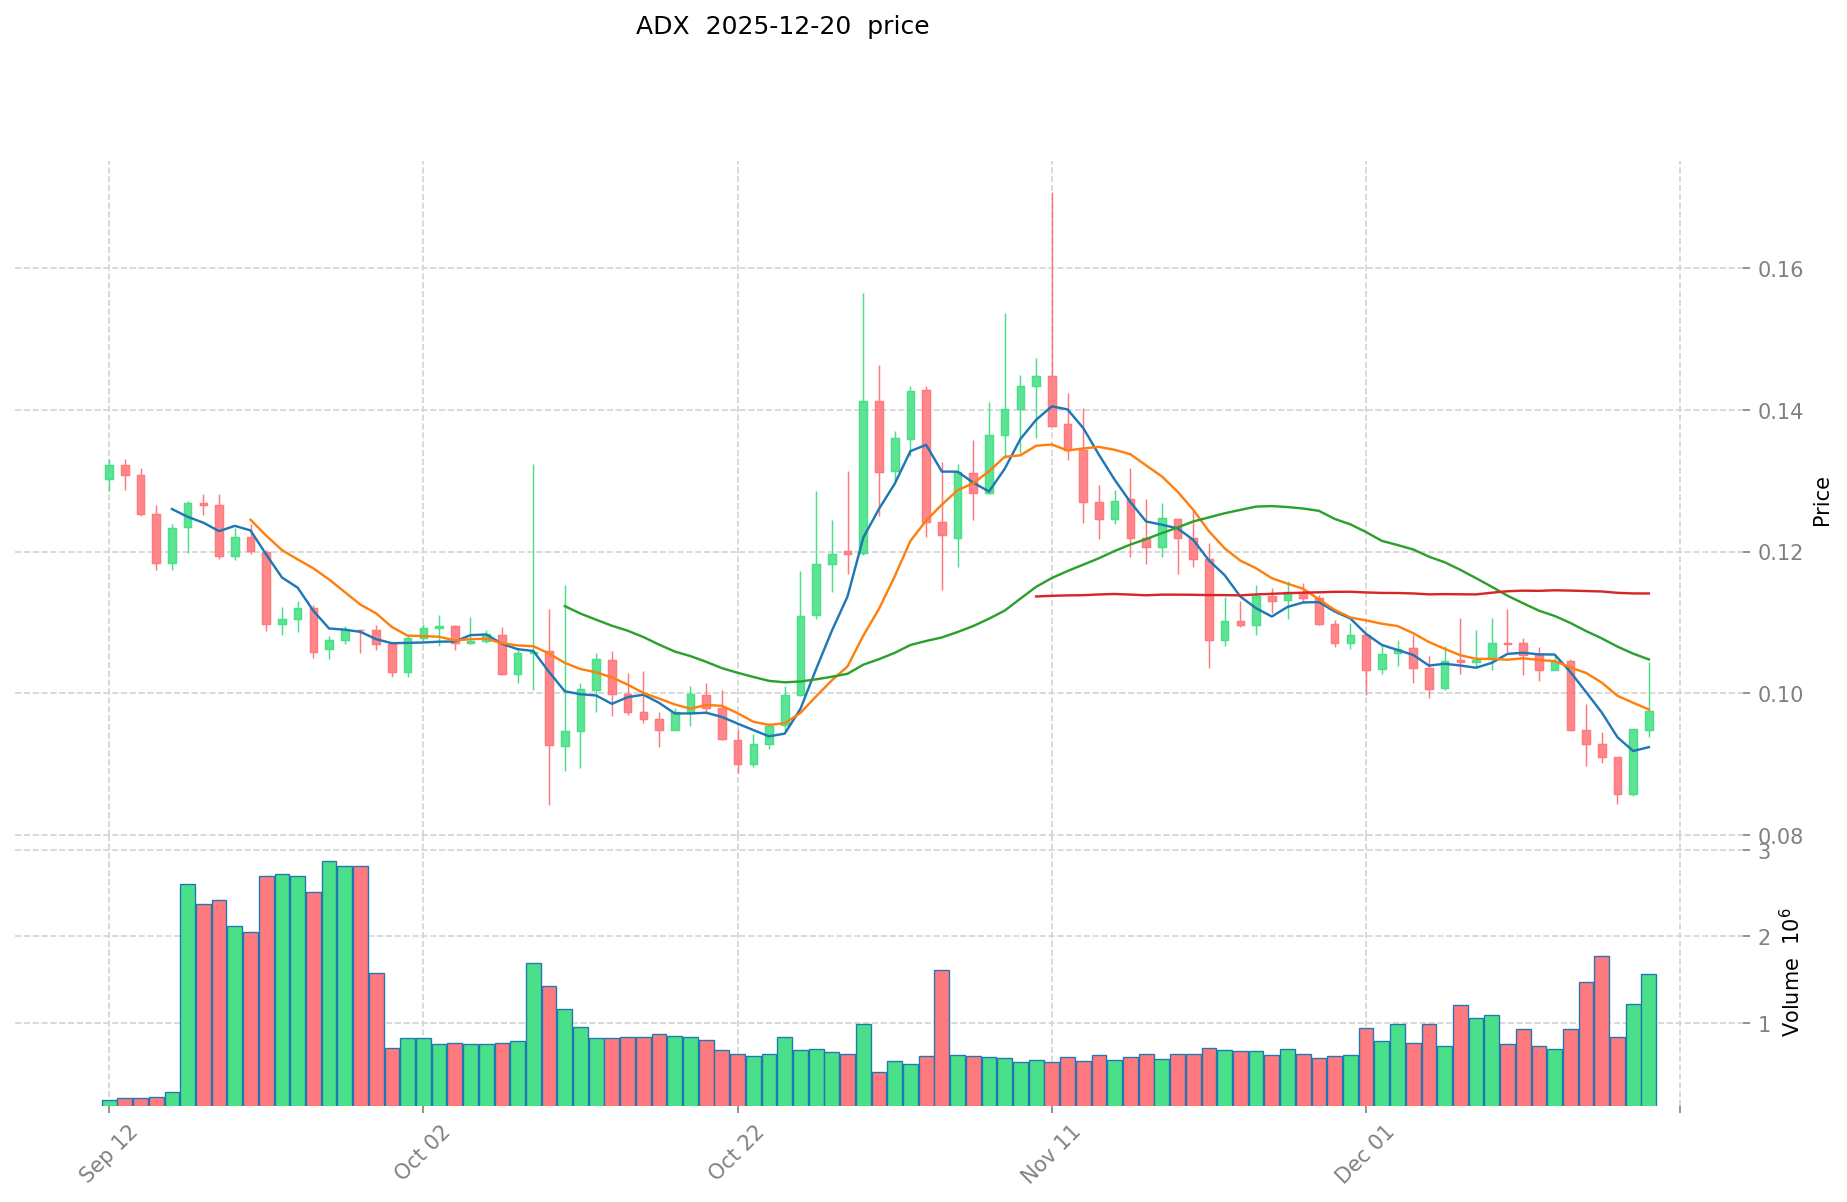
AdEx (ADX):
- Current Price: $0.1026
- 24-Hour Trading Volume: $75,983.81
- Market Capitalization: $15,390,000
- Circulating Supply: 147,900,000 ADX (72.78% of total supply)
- Market Ranking: #969
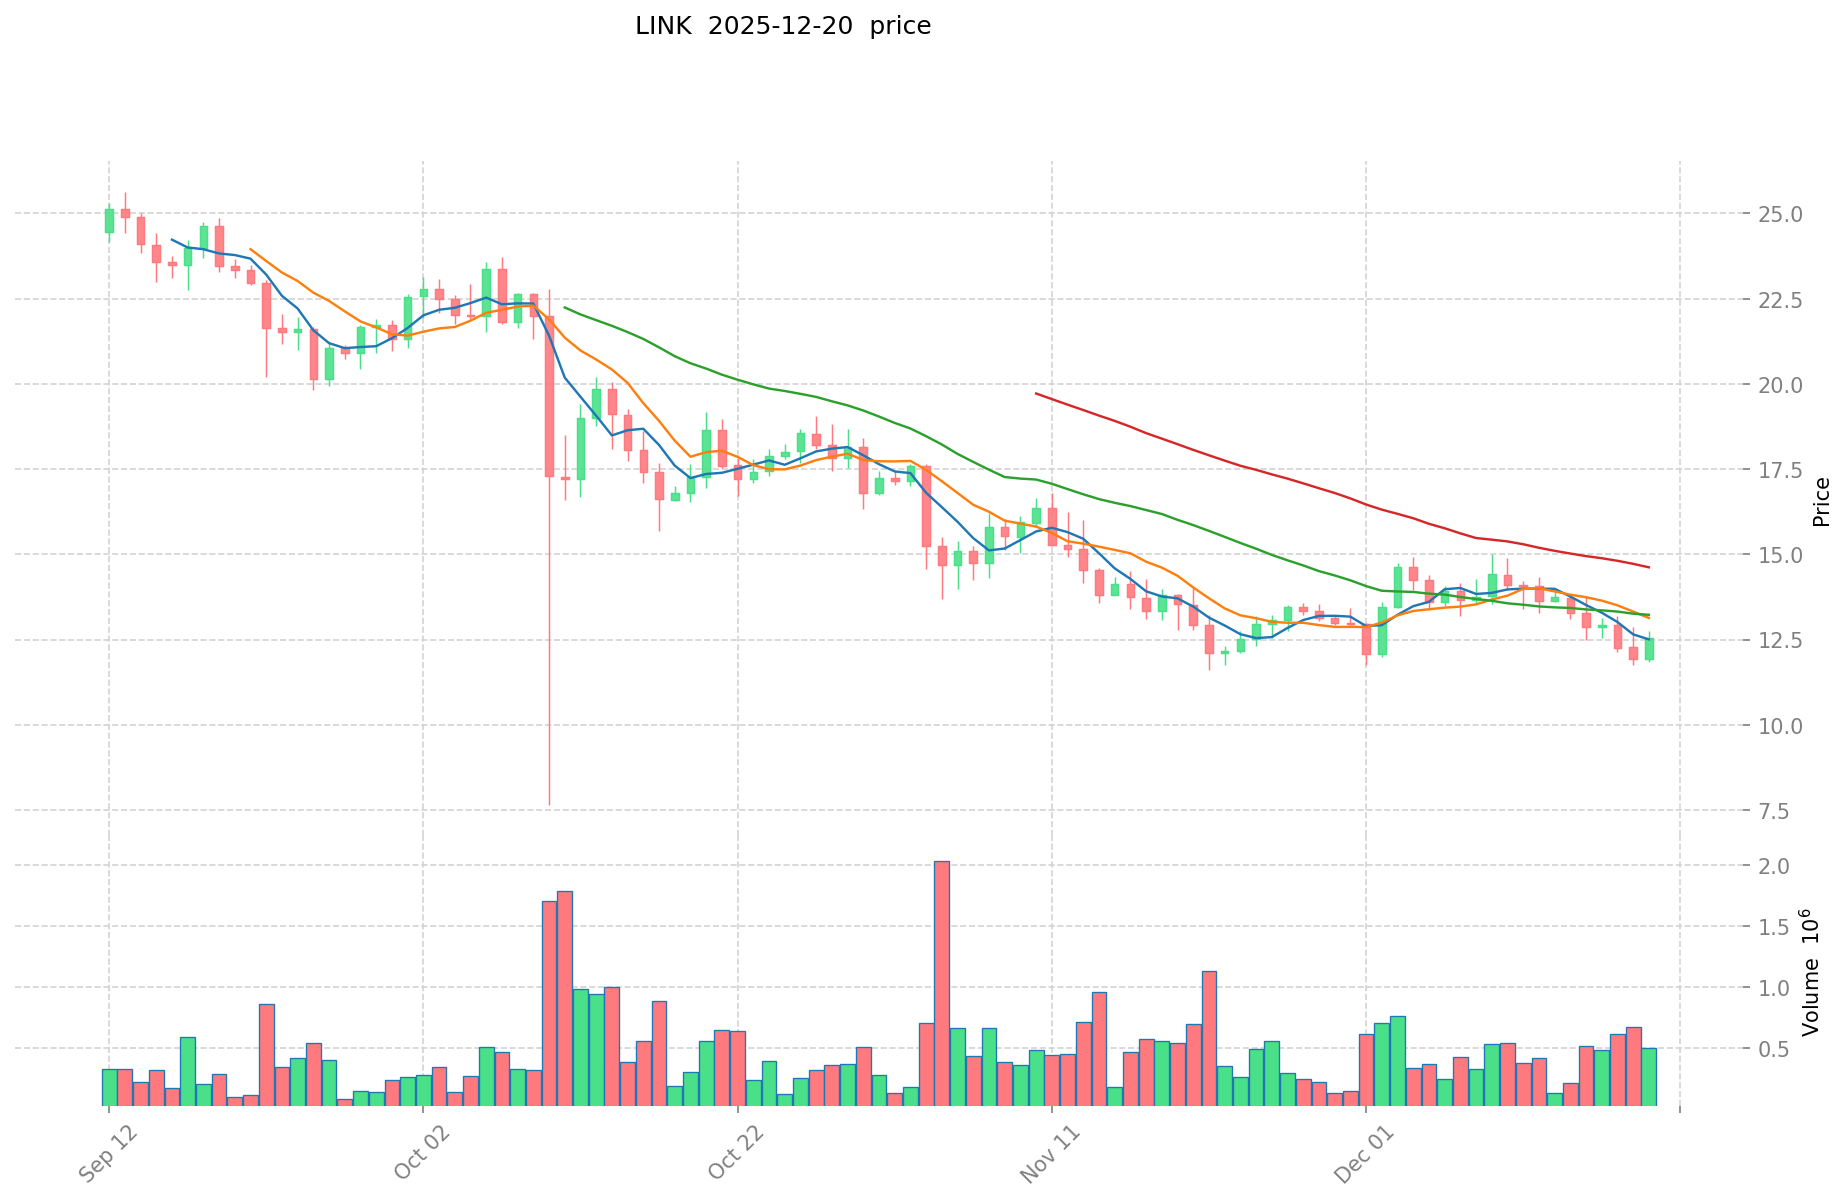
Chainlink (LINK):
- Current Price: $12.58
- 24-Hour Trading Volume: $2,608,255.48
- Market Capitalization: $12,580,000,000
- Circulating Supply: 708,099,970.45 LINK (70.81% of total supply)
- Market Ranking: #19
Price Movement Analysis (24-Hour to 1-Year Periods)
AdEx (ADX) Price Changes:
- 1-Hour: -0.13%
- 24-Hour: +4.61%
- 7-Day: -1.68%
- 30-Day: -15.54%
- 1-Year: -52.76%
Chainlink (LINK) Price Changes:
- 1-Hour: -0.13%
- 24-Hour: -0.05%
- 7-Day: -8.27%
- 30-Day: -5.01%
- 1-Year: -44.96%
Market Sentiment Indicator
Crypto Fear & Greed Index (December 20, 2025):
- Index Reading: 20
- Sentiment Status: Extreme Fear
- Interpretation: The cryptocurrency market is experiencing a period of severe pessimism, with investors demonstrating heightened risk aversion
View Real-Time Prices:
- AdEx (ADX) current price: Market Data
- Chainlink (LINK) current price: Market Data
II. Project Fundamentals Comparison
AdEx (ADX) - Web3 Marketing Platform
Project Overview: AdEx is an innovative Web3 marketing platform that leverages blockchain technology and programmatic advertising to provide transparent, fraud-protected advertising experiences for Web3 advertisers. The platform enables Web3 marketers to access untapped cryptocurrency audiences while maintaining complete control over advertising expenditures.
Technical Infrastructure:
- Blockchain: Ethereum (ETH)
- Token Standard: ERC-20
- Contract Address: 0xADE00C28244d5CE17D72E40330B1c318cD12B7c3
Supply Metrics:
- Total Supply: 150,000,000 ADX
- Max Supply: 203,211,602 ADX
- Current Circulating Supply: 147,900,000 ADX
- Token Holders: 4,592
Chainlink (LINK) - Decentralized Oracle Network
Project Overview: Chainlink is a decentralized oracle network platform that brings capital markets on-chain and supports decentralized finance (DeFi). The Chainlink technology stack provides essential data, interoperability, compliance, and privacy standards required for advanced blockchain use cases, including institutional tokenized assets, lending, payments, and stablecoins. The network has facilitated tens of trillions in transaction value since pioneering decentralized oracle technology.
Technical Infrastructure:
- Blockchain: Ethereum (ETH)
- Token Standard: ERC-20 with ERC-233 extensions
- Contract Address: 0x514910771AF9Ca656af840dff83E8264EcF986CA
Supply Metrics:
- Total Supply: 1,000,000,000 LINK
- Max Supply: 1,000,000,000 LINK
- Current Circulating Supply: 708,099,970.45 LINK
- Token Holders: 817,236
Initial Token Distribution:
- Node Operators & Ecosystem: 35% (350,000,000 LINK)
- Private Token Sales: 32.3% (323,000,000 LINK)
- Company Holdings: 30% (300,000,000 LINK)
- Public Token Sale: 2.7% (27,000,000 LINK)
III. Market Share and Liquidity Analysis
Market Dominance
AdEx (ADX):
- Market Share: 0.00047%
- Market Cap to FDV Ratio: 72.78%
- Exchange Listings: 17 exchanges
Chainlink (LINK):
- Market Share: 0.39%
- Market Cap to FDV Ratio: 70.81%
- Exchange Listings: 69 exchanges
Liquidity Comparison
Trading Volume Analysis:
- AdEx 24-Hour Volume: $75,983.81
- Chainlink 24-Hour Volume: $2,608,255.48
- Volume Differential: Chainlink demonstrates approximately 34.3x higher trading volume than AdEx
Liquidity Assessment: Chainlink exhibits substantially superior liquidity with significantly higher trading volumes and broader exchange coverage. AdEx, while operational across 17 exchanges, shows considerably lower trading activity and smaller market depth.
IV. Technical and Operational Differences
Network Architecture
AdEx (ADX):
- Focus: Web3 marketing and programmatic advertising
- Use Case: Transparent ad-buying experience, fraud protection, audience targeting
- Operational Scope: Advertising ecosystem for crypto projects
Chainlink (LINK):
- Focus: Decentralized oracle infrastructure and data provision
- Use Case: Smart contract data inputs, real-world data integration, cross-chain interoperability
- Operational Scope: Institutional-grade blockchain infrastructure supporting multiple DeFi protocols
Ecosystem Integration
Chainlink Stakeholder Network:
- Partnership with 24 major financial institutions addressing $58 billion in annual post-trade inefficiencies
- LINK ETF inflows exceeding $56 million with total assets reaching $68 million
- Chainlink Reserve accumulation of 92,946 LINK, totaling over 1.23 million tokens
- staking mechanism allowing ecosystem participants to earn rewards while supporting network security
- Coinbase Derivatives listing for perpetual futures contracts
AdEx Ecosystem:
- 4,592 active token holders
- Presence on 17 trading platforms
- GitHub repositories demonstrating active protocol development
V. Risk and Performance Considerations
Volatility Metrics
AdEx (ADX):
- 52-Week Range: $0.07202 - $0.56387
- Significant downward pressure with 52.76% annual decline
- Limited market capitalization creating potential liquidity challenges
Chainlink (LINK):
- Larger market cap and broader institutional adoption
- 44.96% annual decline, outperforming ADX on a year-over-year basis
- Established ecosystem with multiple revenue streams and partnerships
Risk Assessment
AdEx Considerations:
- Smaller market cap and trading volume indicate higher volatility risk
- Limited institutional adoption compared to major infrastructure projects
- Niche market focus (Web3 advertising) versus broader blockchain utilities
Chainlink Considerations:
- Established track record in oracle infrastructure
- Significant institutional backing and partnerships
- Dependency on smart contract ecosystem demand
- Higher token holder count (817,236 vs 4,592) suggesting broader distribution
VI. Community and Development Activity
Development Indicators
AdEx GitHub Repositories:
- adex-protocol
- adex-validator
- adex-market
- adex-platform
- adex-protocol-eth
Community Presence:
- Twitter: @AdEx_Network
- Reddit: r/AdEx
- Official Website: https://www.adex.network/
Chainlink GitHub Repositories:
- chainlink (primary protocol)
- chainlink-ruby
Community Presence:
- Twitter: @chainlink
- Reddit: r/Chainlink/
- Official Website: https://chain.link/
Conclusion
The comparative analysis reveals two projects operating in distinct segments of the blockchain ecosystem. Chainlink, as a foundational infrastructure provider with a $12.58 billion market capitalization and #19 ranking, demonstrates significantly greater institutional adoption, liquidity, and market penetration. AdEx, positioned in the Web3 marketing niche with a $15.39 million market cap and #969 ranking, serves a more specialized function with considerably more limited market presence and trading activity.
The extreme fear sentiment currently pervading cryptocurrency markets (Index: 20) suggests both assets face headwinds typical of broader market cycles, though projects with established institutional relationships and diversified use cases may demonstrate greater resilience during periods of market stress.
Research Report: Core Investment Value Factors of ADX and LINK
I. Executive Summary
Based on available reference materials, this report analyzes the core investment value drivers for ADX (Ad Exchange) and LINK (Chainlink). The research materials provide limited direct information on LINK as a crypto asset, focusing instead on ADX's role in programmatic advertising ecosystems. A comprehensive comparative analysis is constrained by the specialized nature of each asset class.
II. Core Investment Value Factors: ADX vs LINK
Traffic Aggregation and Network Architecture
ADX (Ad Exchange):
- Core competitive advantage lies in the ability to aggregate media traffic and facilitate real-time bidding between demand-side platforms (DSPs) and supply-side platforms (SSPs)
- Functions as an intermediary auction platform where buyers and sellers compete for each advertising impression
- Value proposition depends on platform scale, user demographics, and inventory quality across connected media channels
LINK (Chainlink):
- Investment value fundamentally hinges on decentralized oracle network adoption and market penetration
- Market performance influenced by whale holding concentration and large-scale accumulation activities by major token holders
Application Ecosystem and Adoption Pathways
ADX Architecture:
- Operates within programmatic advertising workflows: DSP → ADX → SSP → Publisher inventory
- Revenue model tied to volume of successful auctions and competitive bidding intensity
- Platform success dependent on media channel concentration and resource distribution among top-tier operators
LINK Ecosystem:
- Driven by demand for decentralized data verification services across blockchain applications
- Market dynamics significantly shaped by institutional and whale positioning
- Adoption measured through integration with smart contract platforms and DeFi protocols
Operational Efficiency Metrics
ADX Performance Indicators:
- Gross margins: Programmatic advertising businesses typically operate at 19-20% gross margin levels
- Operating leverage: Fixed costs in technology infrastructure amortize across transaction volume
- Cost drivers include traffic acquisition, server infrastructure, and personnel expenses
LINK Market Factors:
- Token holder concentration affects market depth and price stability
- Whale sentiment and accumulation patterns serve as primary market change drivers
III. Market Structure Considerations
Media and Platform Consolidation
The reference materials indicate that media channel concentration has progressively increased, with top-tier platforms (including major advertising exchanges) consolidating market share. This structural trend affects:
- Traffic availability and pricing dynamics
- Competitive intensity in real-time bidding environments
- Barriers to entry for alternative platforms
Technological Infrastructure Investment
Reference materials from Mobvista Inc.'s financial reports indicate substantial R&D investment in:
- Intelligent bidding systems development
- Model training capabilities for ad placement optimization
- Server infrastructure and intangible asset amortization
These investments signal sector-wide emphasis on algorithmic sophistication as a competitive differentiator.
IV. Limitations and Data Gaps
The available reference materials provide substantially more detailed information regarding ADX's operational mechanics, financial performance, and market structure than they do for LINK as a crypto asset. Comprehensive analysis of LINK's technical development roadmap, ecosystem partnerships, and regulatory environment would require additional sources not present in the provided materials.
Report Generated: December 21, 2025
Disclaimer: This analysis is based solely on provided reference materials. It contains no subjective recommendations, political positioning, or investment advice. Statements reflect documented information only.
III. 2025-2030 Price Forecast: ADX vs LINK
Short-term Forecast (2025)
- ADX: Conservative $0.0748-$0.1025 | Optimistic $0.1168
- LINK: Conservative $9.0461-$12.564 | Optimistic $13.9460
Mid-term Forecast (2026-2028)
- ADX may enter accumulation phase, projected price range $0.0778-$0.1968
- LINK may enter growth phase, projected price range $10.2355-$18.9202
- Key drivers: Institutional capital inflows, ETF adoption, ecosystem development expansion
Long-term Forecast (2029-2030)
- ADX: Base case $0.1323-$0.1799 | Optimistic scenario $0.1825-$0.1995
- LINK: Base case $10.3286-$19.6243 | Optimistic scenario $21.1942-$22.0343
Disclaimer: This analysis is provided for informational purposes only and should not be considered investment advice. Cryptocurrency markets are highly volatile and unpredictable. Actual prices may deviate significantly from forecasts. Investors should conduct independent research and consult financial professionals before making investment decisions. Past performance does not guarantee future results.
ADX:
| 年份 | 预测最高价 | 预测平均价格 | 预测最低价 | 涨跌幅 |
|---|---|---|---|---|
| 2025 | 0.116793 | 0.10245 | 0.0747885 | 0 |
| 2026 | 0.14908524 | 0.1096215 | 0.077831265 | 6 |
| 2027 | 0.1474628418 | 0.12935337 | 0.0711443535 | 26 |
| 2028 | 0.196539510378 | 0.1384081059 | 0.120415052133 | 34 |
| 2029 | 0.18254645087151 | 0.167473808139 | 0.13230430842981 | 63 |
| 2030 | 0.19951154763599 | 0.175010129505255 | 0.150508711374519 | 70 |
LINK:
| 年份 | 预测最高价 | 预测平均价格 | 预测最低价 | 涨跌幅 |
|---|---|---|---|---|
| 2025 | 13.94604 | 12.564 | 9.04608 | 0 |
| 2026 | 16.568775 | 13.25502 | 11.3993172 | 5 |
| 2027 | 16.1048493 | 14.9118975 | 13.271588775 | 18 |
| 2028 | 18.920215548 | 15.5083734 | 10.235526444 | 23 |
| 2029 | 22.03429692672 | 17.214294474 | 10.3285766844 | 36 |
| 2030 | 21.1942393563888 | 19.62429570036 | 14.71822177527 | 55 |
Comparative Investment Analysis Report: ADX vs LINK
IV. Investment Strategy Comparison: ADX vs LINK
Long-term vs Short-term Investment Strategies
ADX (AdEx):
- Suitable for investors interested in niche Web3 marketing ecosystem development and programmatic advertising transparency
- Short-term investors may face liquidity challenges given limited 24-hour trading volume ($75,983.81)
- Long-term positioning requires conviction in Web3 advertising market adoption with minimal institutional validation currently present
LINK (Chainlink):
- Suitable for investors seeking established infrastructure exposure with documented institutional partnerships and ETF inflows
- Short-term traders benefit from substantially higher liquidity ($2,608,255.48 daily volume) and 69 exchange listings
- Long-term investors can leverage Chainlink's diversified revenue streams from oracle services and staking mechanisms
Risk Management and Asset Allocation
Conservative Investors:
- ADX: 2-5% portfolio allocation (speculative position sizing)
- LINK: 8-12% portfolio allocation (core infrastructure holding)
- Hedging Tools: Stablecoin reserves (40-50%), options strategies for downside protection, cross-asset diversification through major layer-1 protocols
Aggressive Investors:
- ADX: 8-15% portfolio allocation (higher risk tolerance for emerging ecosystem plays)
- LINK: 15-25% portfolio allocation (substantial infrastructure bet with established track record)
- Hedging Tools: Derivative positions through Coinbase perpetual futures (LINK), strategic stop-losses, volatility hedging through inverse correlation assets
V. Potential Risk Comparison
Market Risk
ADX (AdEx):
- Extreme liquidity risk: 24-hour volume of $75,983.81 creates substantial slippage for position building/unwinding
- Market cap of $15.39 million represents vulnerability to concentrated selling pressure
- Limited institutional adoption suggests lower price floor stability during market stress periods
- Ranking of #969 reflects marginal market presence with potential for rapid devaluation
LINK (Chainlink):
- Significantly larger market cap ($12.58 billion) provides greater price stability relative to trading volume
- 44.96% annual decline indicates exposure to broader cryptocurrency market cycles
- Higher token holder count (817,236 vs 4,592 for ADX) suggests more distributed risk
- Dependency on smart contract ecosystem demand creates indirect exposure to DeFi sector volatility
Technical Risk
ADX (AdEx):
- ERC-20 standard implementation on Ethereum creates smart contract vulnerability exposure inherited from token standard architecture
- Limited developer community (reflected in 5 primary GitHub repositories) may constrain rapid protocol upgrades and security patches
- Smaller token holder base (4,592) increases concentration risk and potential for price manipulation
LINK (Chainlink):
- ERC-20 with ERC-233 extensions indicates more sophisticated token architecture with enhanced functionality
- Established developer ecosystem with multiple protocol repositories supporting ongoing maintenance and enhancement
- Oracle network security depends on node operator incentive alignment and stake concentration
- Larger holder base (817,236) reduces single-actor manipulation risk but increases complexity of network governance
Regulatory Risk
Global Policy Impact Considerations:
Both ADX and LINK operate under Ethereum's regulatory framework with token classification uncertainties present across jurisdictions:
- Securities Classification Risk: Advertising-linked revenue models (ADX) may face greater scrutiny under securities laws than pure infrastructure services (LINK)
- Jurisdiction-Specific Exposure: Exchange listing availability (17 for ADX vs 69 for LINK) reflects differential regulatory acceptance across trading venues
- Institutional Adoption Impact: LINK's partnership with 24 financial institutions creates regulatory precedent and legitimacy; ADX lacks comparable institutional validation
VI. Conclusion: Which Is the Better Buy?
📌 Investment Value Summary:
ADX (AdEx) Advantages:
- Emerging Web3 marketing ecosystem with first-mover positioning in blockchain advertising transparency
- Lower current valuation ($0.1026) provides higher percentage upside potential if ecosystem adoption materializes
- Addresses specific pain point: transparent, fraud-protected advertising for cryptocurrency projects
- Limited institutional competition in programmatic Web3 advertising segment
LINK (Chainlink) Advantages:
- Established decentralized oracle infrastructure with documented institutional partnerships (24 major financial institutions)
- Significantly superior liquidity (34.3x higher daily volume) enabling larger position entry/exit flexibility
- Diversified revenue streams from oracle services, staking mechanisms, and DeFi protocol integrations
- Higher market ranking (#19 vs #969) reflects substantial ecosystem validation and adoption
- ETF inflows ($56+ million) and Coinbase derivatives listing demonstrate institutional-grade infrastructure status
- Superior 1-year performance: -44.96% decline outperforms ADX's -52.76% decline during identical period
✅ Investment Recommendations:
Beginner Investors:
- Recommended Strategy: LINK represents lower-risk entry point with established utility, transparent use cases, and institutional backing. Begin with conservative 5-8% portfolio allocation. ADX should be avoided until stronger ecosystem metrics emerge.
Experienced Investors:
- Recommended Strategy: LINK serves as portfolio core holding (12-20% allocation) providing stable infrastructure exposure. ADX allocation (3-8%) acceptable only for investors with specific thesis regarding Web3 advertising adoption and high-risk tolerance. Consider dollar-cost averaging strategy given current extreme fear sentiment (Index: 20).
Institutional Investors:
- Recommended Strategy: LINK demonstrates sufficient market liquidity and infrastructure maturity for substantial allocations (15-30% depending on mandate). Direct staking mechanisms and partnership ecosystem provide revenue generation beyond price appreciation. ADX unsuitable due to insufficient trading depth for institutional position sizing.
⚠️ Risk Disclosure:
Cryptocurrency markets exhibit extreme volatility with both ADX and LINK experiencing 44.96%-52.76% annual declines. The Crypto Fear & Greed Index reading of 20 (Extreme Fear) on December 20, 2025 indicates severe market pessimism that may persist or intensify. This analysis does not constitute investment advice. Investors must conduct independent research, consult qualified financial professionals, and assess personal risk tolerance before making investment decisions. Historical performance provides no guarantee of future results. Actual prices may deviate substantially from forecast projections provided in sections III.
Report Generated: December 21, 2025
Data Currency: December 21, 2025
None
Frequently Asked Questions: ADX vs LINK Investment Comparison
FAQ
Q1: What are the primary differences in market positioning between ADX and LINK?
A: ADX (AdEx) operates as a Web3 marketing platform focused on programmatic advertising with a market cap of $15.39 million and #969 ranking. LINK (Chainlink) functions as decentralized oracle infrastructure with a $12.58 billion market cap and #19 ranking. LINK serves broader blockchain ecosystem needs for off-chain data integration, while ADX addresses a specialized niche in cryptocurrency advertising transparency. The 819x market cap difference reflects LINK's substantially greater institutional adoption and market penetration.
Q2: How do liquidity levels compare between these two assets?
A: LINK demonstrates significantly superior liquidity with $2,608,255.48 in 24-hour trading volume across 69 exchange listings, approximately 34.3 times higher than ADX's $75,983.81 volume across 17 exchanges. This liquidity differential creates meaningful implications for position entry/exit flexibility and potential slippage costs. ADX's limited trading volume may cause substantial price impact for larger trades, while LINK enables institutional-scale positioning with minimal market disruption.
Q3: Which asset experienced better price performance during 2025?
A: LINK outperformed ADX on a year-over-year basis with a -44.96% decline compared to ADX's -52.76% decline over the same 12-month period. While both assets declined within the broader cryptocurrency market correction, LINK's larger market cap, institutional partnerships, and diversified ecosystem provided relatively greater price resilience during the market downturn period.
Q4: What are the key risk factors differentiating these investments?
A: ADX faces extreme liquidity risk (market cap of $15.39 million with minimal trading depth), limited institutional adoption, and concentration among 4,592 token holders creating manipulation vulnerability. LINK's primary risks include smart contract ecosystem dependency, oracle network node operator incentive alignment, and exposure to broader DeFi sector volatility. Additionally, ADX's advertising revenue model may encounter greater securities classification scrutiny across jurisdictions compared to LINK's pure infrastructure positioning.
Q5: How do institutional adoption levels differ between ADX and LINK?
A: LINK demonstrates substantially greater institutional validation through partnerships with 24 major financial institutions, $56+ million in ETF inflows, Coinbase derivatives listing for perpetual futures, and Chainlink Reserve accumulation of 1.23+ million tokens. ADX currently lacks comparable institutional backing or major partnership announcements. LINK's institutional infrastructure suggests greater regulatory legitimacy and long-term sustainability, while ADX remains primarily within speculative cryptocurrency markets.
Q6: What supply mechanisms and tokenomics differences should investors understand?
A: ADX has 150 million total supply with 147.9 million circulating (72.78% circulation rate) among 4,592 holders. LINK has 1 billion fixed total supply with 708.1 million circulating (70.81% circulation rate) among 817,236 holders. LINK's initial distribution included 35% to node operators, 32.3% to private sales, 30% company holdings, and 2.7% public sale. ADX's broader percentage circulation and smaller total supply may create different inflation dynamics, though absolute token concentration remains substantially higher for ADX given holder count disparity.
Q7: Which asset demonstrates stronger development momentum and community activity?
A: LINK demonstrates more substantial development infrastructure with established GitHub repositories, active protocol maintenance, and documented roadmap updates. LINK's larger community (817,236 holders vs 4,592 for ADX) and presence across 69 exchanges versus 17 for ADX indicates stronger ongoing developer support and ecosystem engagement. ADX maintains 5 primary GitHub repositories with active development, but limited holder base and exchange coverage suggest slower community expansion and fewer development resources relative to project scope.
Q8: Should risk-averse investors consider either asset given current market conditions?
A: Risk-averse investors should prioritize LINK over ADX given current market conditions characterized by Extreme Fear sentiment (index reading: 20). LINK's $12.58 billion market cap, 817,236 token holders, established partnerships, and institutional backing provide superior downside protection during market stress. ADX's $15.39 million market cap, 4,592 holders, and limited institutional adoption create unacceptable volatility for conservative portfolios. Conservative allocations should not exceed 5-8% for LINK; ADX should be avoided until ecosystem metrics strengthen substantially.
Report Generated: December 21, 2025
Disclaimer: This analysis is provided for informational purposes only and does not constitute investment advice. Cryptocurrency markets exhibit extreme volatility. Investors must conduct independent research and consult qualified financial professionals before making investment decisions. Past performance provides no guarantee of future results.
Share
Content
Introduction: ADX vs LINK Investment Comparison
I. Historical Price Comparison and Current Market Status
II. Project Fundamentals Comparison
III. Market Share and Liquidity Analysis
IV. Technical and Operational Differences
V. Risk and Performance Considerations
VI. Community and Development Activity
Conclusion
I. Executive Summary
II. Core Investment Value Factors: ADX vs LINK
III. Market Structure Considerations
IV. Limitations and Data Gaps
III. 2025-2030 Price Forecast: ADX vs LINK
IV. Investment Strategy Comparison: ADX vs LINK
V. Potential Risk Comparison
VI. Conclusion: Which Is the Better Buy?
FAQ
How to Buy Cryptocurrency


Trending Cryptocurrencies


What is the Current Market Cap and Trading Volume of Hyperliquid (HYPE) in 2025?
BTRST vs AAVE: Comparing Two Leading Governance Tokens in the DeFi Ecosystem
ENSO vs QNT: A Comprehensive Comparison of Climate Oscillation Patterns and Quantum Computing Technologies
PUNDIX vs GRT: A Comprehensive Comparison of Two Leading Blockchain Utility Tokens
G vs LINK: A Comprehensive Comparison of Two Leading Blockchain Protocols and Their Impact on Decentralized Finance

2025 LOFI Price Prediction: Expert Analysis and Market Forecast for the Coming Year

How do on-chain data analytics predict CMC20 price movements in 2026: analyzing active addresses, transaction volume, whale distribution, and network fees

How do futures open interest, funding rates, and liquidation data predict crypto price movements?

What is token economics model: how does NIGHT's 24 billion token distribution and dual-token system work?

What are the compliance and regulatory risks in crypto trading and how do they impact SEC enforcement and KYC/AML policies in 2026
What Are Permissioned and Permissionless Blockchains?