G vs LINK: A Comprehensive Comparison of Two Leading Blockchain Protocols and Their Impact on Decentralized Finance

Introduction: G vs LINK Investment Comparison
In the cryptocurrency market, comparisons between Gravity (G) and ChainLink (LINK) represent a compelling case study for investors evaluating different asset categories. The two tokens demonstrate significant divergence in market capitalization ranking, ecosystem positioning, and price dynamics, reflecting distinct roles within the broader crypto infrastructure.
Gravity (G): Launched in 2024, G serves as the native token of the Gravity network and utility token across both Gravity and Galxe ecosystems. G powers transactions as the gas token and will secure the network through staking, while driving governance decisions, incentivizing growth, and facilitating payments across both platforms.
ChainLink (LINK): Since its introduction in 2017, LINK has established itself as a foundational oracle solution, serving as an ERC-20 standardized token used to compensate ChainLink node operators for retrieving off-chain data, formatting data into blockchain-readable formats, executing off-chain computation, and ensuring network uptime. As part of node operation infrastructure, LINK also serves to prevent malicious participants.
This analysis will examine the investment case for both tokens across multiple dimensions including historical price performance, market capitalization and ranking, supply mechanisms, exchange availability, and broader ecosystem adoption. The comparison addresses a fundamental question for crypto investors:
"Which presents the more compelling investment opportunity given current market conditions?"
Comparative Analysis of Gravity (G) and Chainlink (LINK)
I. Historical Price Comparison and Current Market Status
Gravity (G) and Chainlink (LINK) Historical Price Trends
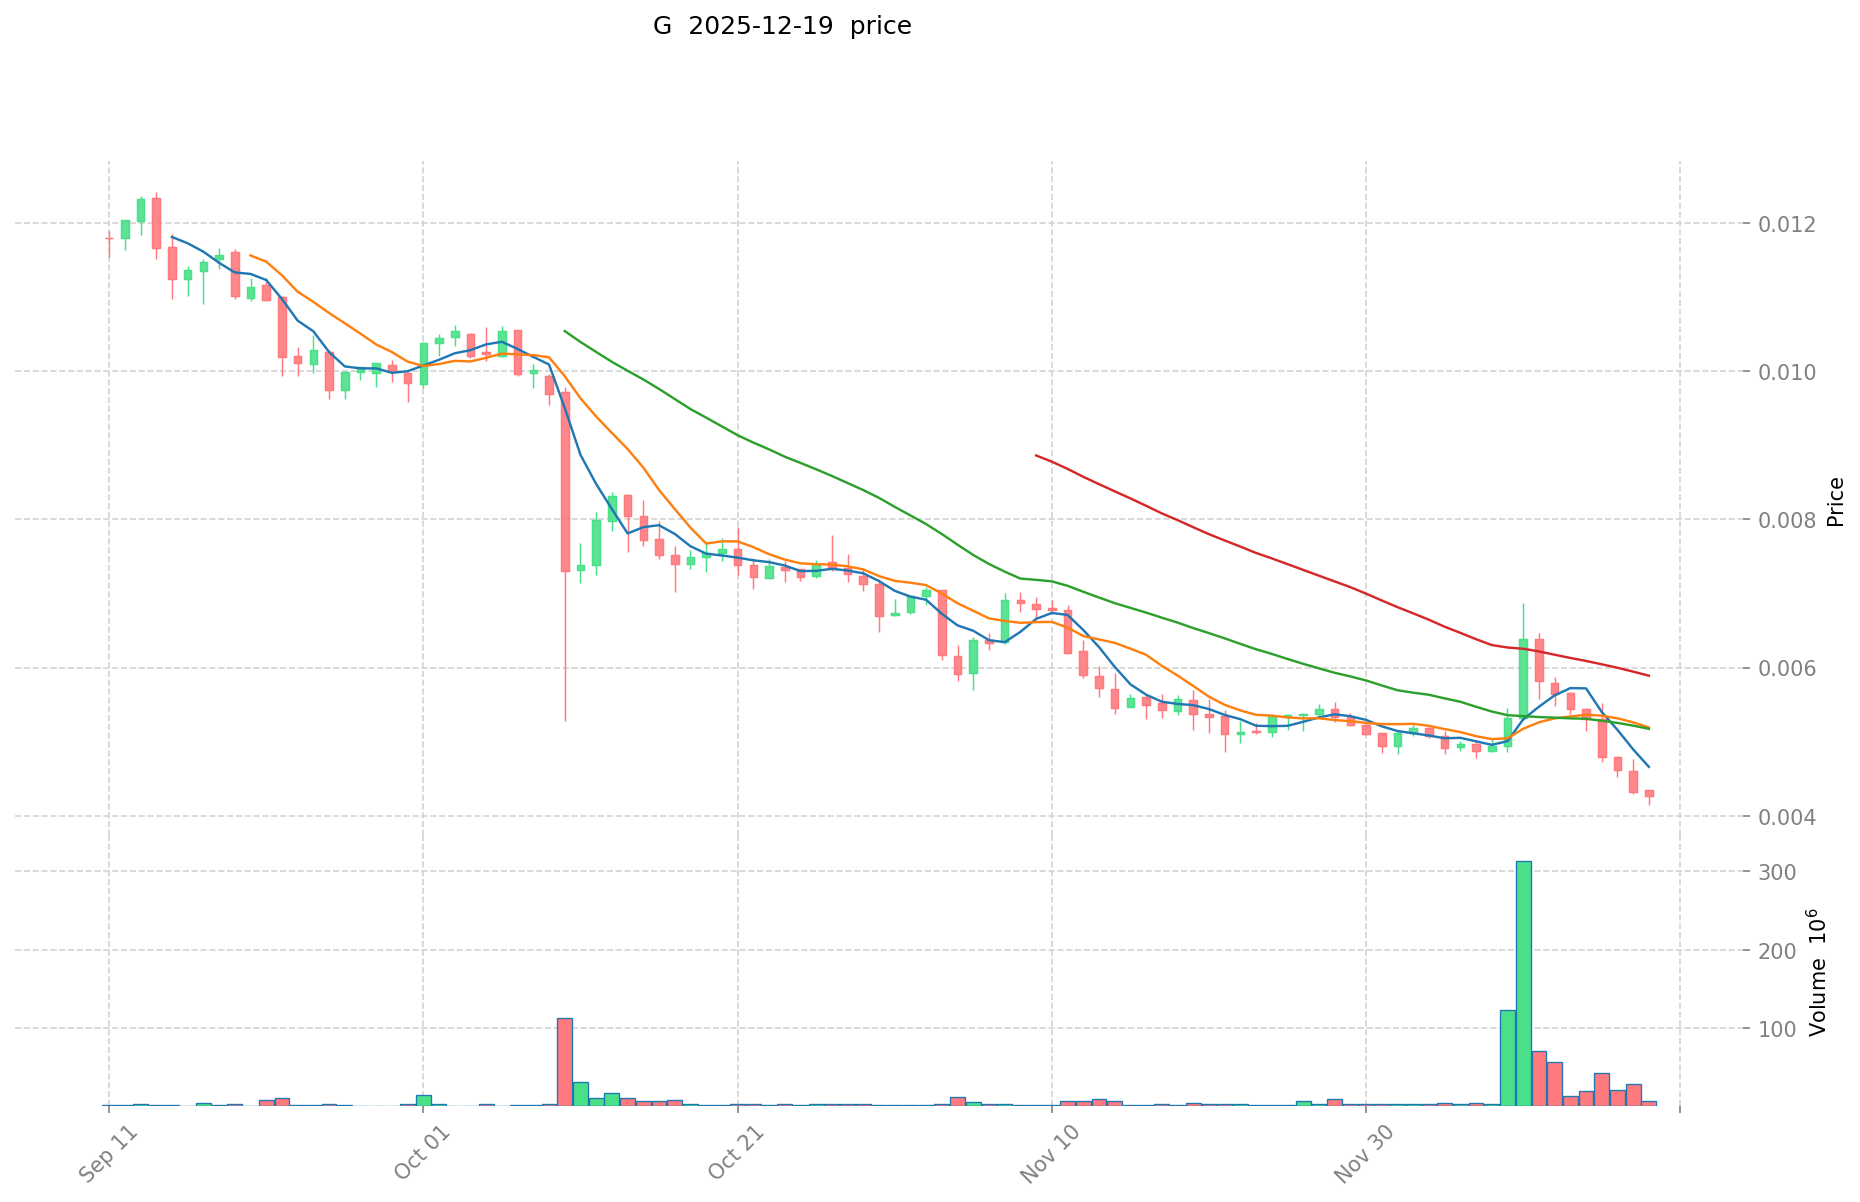
Gravity (G):
- All-time high: $0.05764 (July 25, 2024)
- All-time low: $0.00414 (December 18, 2025)
- Current price: $0.004432 (as of December 19, 2025)
- Cumulative decline from ATH: -92.31%
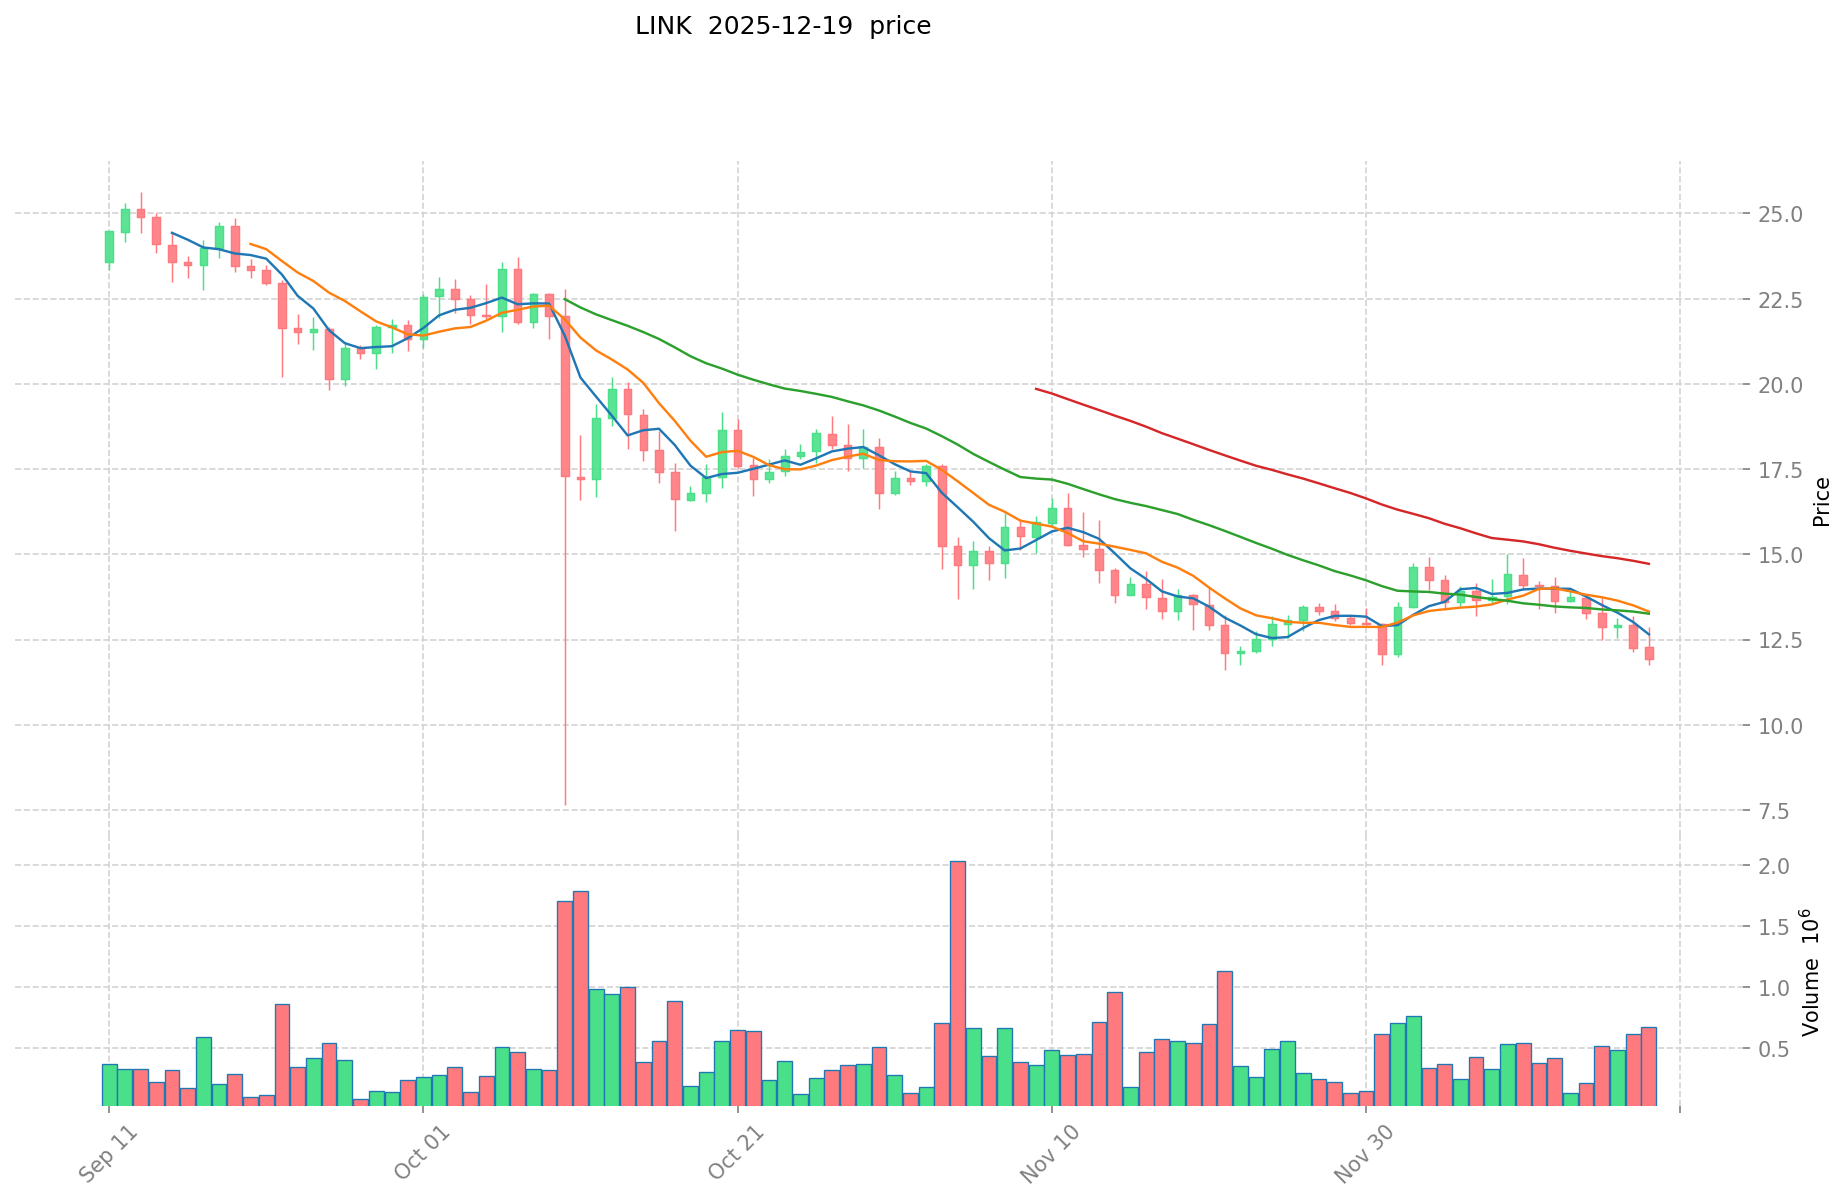
Chainlink (LINK):
- All-time high: $52.70 (May 10, 2021)
- All-time low: $0.148183 (November 29, 2017)
- Current price: $12.411 (as of December 19, 2025)
- Cumulative decline from ATH: -76.48%
Comparative Analysis
Gravity (G) has experienced a significantly steeper decline from its all-time high compared to Chainlink. While LINK has recovered substantially from its 2017 lows and maintains a market capitalization of $12.41 billion, Gravity has shown more severe contraction since its July 2024 peak. LINK's historical trajectory reflects its establishment as a foundational oracle infrastructure project, whereas Gravity represents a newer entrant to the market.
Current Market Status (December 19, 2025)
Price Data:
- Gravity (G) current price: $0.004432
- Chainlink (LINK) current price: $12.411
24-Hour Trading Activity:
- Gravity (G) 24-hour volume: $22,699.32
- Chainlink (LINK) 24-hour volume: $9,231,773.07
Price Movement (24-Hour):
- Gravity (G): +5.9% change
- Chainlink (LINK): +1.32% change
Market Sentiment Index (Fear & Greed Index): 16 — Extreme Fear
The cryptocurrency market is currently experiencing extreme fear sentiment, with heightened volatility and risk aversion among market participants.
II. Project Overview and Token Utility
Gravity (G)
Project Introduction: G is the native token of the Gravity network and serves as a utility token across both the Gravity and Galxe ecosystems. The token functions as the gas token powering transactions and will soon secure the network through staking mechanisms. As the primary utility token across both ecosystems, G facilitates governance decisions, incentivizes ecosystem growth, and enables payments.
Token Specifications:
- Token Standard: ERC-20
- Total Supply: 12,000,000,000 (12 billion)
- Circulating Supply: 7,232,700,000 (7.23 billion)
- Circulation Ratio: 60.27%
- Contract Address (Ethereum): 0x9c7beba8f6ef6643abd725e45a4e8387ef260649
Chainlink (LINK)
Project Introduction: LINK is an ERC-20 standardized token based on the Ethereum blockchain, used to compensate Chainlink node operators for retrieving off-chain data, formatting data into blockchain-readable formats, executing off-chain computations, and ensuring network uptime. The LINK token serves as a staking mechanism to prevent malicious participation within the Chainlink network.
Token Specifications:
- Token Standard: ERC-20
- Total Supply: 1,000,000,000 (1 billion)
- Circulating Supply: 696,849,970 (696.85 million)
- Circulation Ratio: 69.68%
- Contract Address (Ethereum): 0x514910771AF9Ca656af840dff83E8264EcF986CA
III. Market Capitalization and Valuation Metrics
Gravity (G)
- Market Capitalization: $32,055,326.40
- Fully Diluted Valuation: $53,184,000.00
- Market Cap / FDV Ratio: 60.27%
- Market Dominance: 0.0016%
- Number of Holders: 24,659
- Listed on 36 exchanges
Chainlink (LINK)
- Market Capitalization: $8,648,604,983.29
- Fully Diluted Valuation: $12,411,000,000.00
- Market Cap / FDV Ratio: 69.68%
- Market Dominance: 0.39%
- Number of Holders: 817,234
- Listed on 73 exchanges
Comparative Valuation Analysis
Chainlink's market capitalization is approximately 270 times larger than Gravity's, reflecting its established position as a leading oracle infrastructure provider. LINK's broader distribution across 817,234 holders versus Gravity's 24,659 holders indicates significantly higher adoption and network participation. Chainlink's presence on 73 exchanges compared to Gravity's 36 exchanges demonstrates more extensive trading accessibility and liquidity infrastructure.
IV. Price Performance Analysis
Short-Term Performance (Last 24 Hours)
| Metric | Gravity (G) | Chainlink (LINK) |
|---|---|---|
| 24-Hour Change | +5.9% | +1.32% |
| 24-Hour High | $0.004476 | $12.877 |
| 24-Hour Low | $0.00414 | $11.742 |
| 24-Hour Range | $0.000336 (7.5%) | $1.135 (9.3%) |
Medium-Term Performance (7-Day)
| Metric | Gravity (G) | Chainlink (LINK) |
|---|---|---|
| 7-Day Change | -20.29% | -11.45% |
| Price Change Amount | -$0.001128 | -$1.6048 |
Longer-Term Performance (30-Day & 1-Year)
| Metric | Gravity (G) | Chainlink (LINK) |
|---|---|---|
| 30-Day Change | -18.68% | -7.64% |
| 1-Year Change | -84.55% | -50.13% |
Performance Analysis
Over the past 24 hours, Gravity displayed stronger positive momentum at +5.9% compared to Chainlink's +1.32%. However, examining intermediate timeframes reveals concerning trends for both tokens. Both assets have experienced significant declines over the 7-day, 30-day, and 1-year periods. Gravity's 1-year decline of -84.55% substantially exceeds Chainlink's -50.13%, indicating more severe long-term pressure on the newer project. This divergence reflects different market cycles, with LINK benefiting from its longer operational history and established infrastructure role.
V. Risk Factors and Market Considerations
Gravity (G) Risk Profile
- Extreme Volatility: High price fluctuations with recent ATH-to-ATL decline of 92.31%
- Liquidity Concerns: Significantly lower trading volume ($22,699.32 daily) compared to established projects
- Early-Stage Risk: Relatively newer project with limited market history
- Concentration Risk: Limited holder base of 24,659 addresses
- Dependency: Token utility tied to Gravity and Galxe ecosystem adoption
Chainlink (LINK) Risk Profile
- Market Maturity: Established project with long operational track record since 2017
- Infrastructure Dependency: Network security reliant on node operator participation
- Regulatory Uncertainty: Oracle networks face evolving regulatory frameworks
- Competition: Growing number of alternative oracle solutions
- Long-Term Decline: -50.13% annual decline indicates market headwinds
Current Market Environment
The cryptocurrency market operates under extreme fear sentiment (Fear & Greed Index: 16), suggesting heightened risk aversion and potential downside pressure on most digital assets. This environment particularly impacts speculative projects with lower established credibility.
VI. Key Information Resources
Gravity (G)
- Official Website: https://www.galxe.com/
- Documentation: https://docs.gravity.xyz/
- Network Scanner: https://gscan.xyz
- Ethereum Scanner: https://etherscan.io/token/0x9c7beba8f6ef6643abd725e45a4e8387ef260649
- Social: https://x.com/Galxe
Chainlink (LINK)
- Official Website: https://chain.link/
- GitHub: https://github.com/smartcontractkit/chainlink
- Community: https://www.reddit.com/r/Chainlink/
- Ethereum Scanner: https://etherscan.io/token/0x514910771AF9Ca656af840dff83E8264EcF986CA
- Social: https://twitter.com/chainlink
VII. Summary and Observations
Gravity (G) and Chainlink (LINK) operate within distinctly different market positioning frameworks. Chainlink represents an established infrastructure protocol with a market capitalization exceeding $8.6 billion, extensive holder distribution across 817,234 addresses, and multiple exchange listings. Gravity represents an emerging ecosystem token dependent on dual-platform adoption within Gravity and Galxe ecosystems, with significantly lower liquidity and market recognition.
Both assets are currently experiencing downward pressure reflected in negative 7-day, 30-day, and 1-year performance metrics, consistent with broader market sentiment characterized by extreme fear. The 24-hour positive performance for both tokens may represent minor technical rebounds rather than substantive trend reversals.
Gravity (G) Investment Value Analysis Report
Executive Summary
This report analyzes the core investment value factors of Gravity (G) token based on available reference materials. The analysis is limited to factors explicitly mentioned in the provided sources to ensure accuracy and avoid unfounded speculation.
I. Core Investment Value Factors for Gravity (G)
Supply Mechanism and Scarcity
The investment value of Gravity (G) is fundamentally influenced by its supply mechanisms and scarcity characteristics. Supply scarcity represents a critical factor in determining long-term value retention and price appreciation potential in volatile cryptocurrency markets.
Institutional and Mainstream Adoption
Institutional adoption levels significantly impact Gravity's investment potential. The degree to which institutional investors and mainstream financial entities incorporate G into their portfolios directly affects market liquidity, price stability, and overall market confidence in the asset.
Macroeconomic Environment
The broader macroeconomic context plays a substantial role in determining Gravity's investment performance. Economic cycles, inflation rates, and global financial conditions create the operating environment within which G token valuations are established and fluctuate.
Technology and Ecosystem Development
The technological infrastructure supporting Gravity and its associated Galxe network ecosystem forms the foundation for practical utility and long-term value creation. Technical capabilities and ecosystem maturity directly correlate with investor confidence and adoption rates.
II. ESG Considerations and Sustainable Practices
Environmental, Social, and Governance (ESG) scores and sustainable business practices represent increasingly important valuation metrics in modern investment analysis. Projects demonstrating strong ESG commitment may attract a broader investor base and benefit from favorable market sentiment among institutional capital focused on sustainable investing.
III. Market Risk Factors
Market Volatility
Cryptocurrency markets, including Gravity, experience significant price volatility. Short-term market pressures stem from multiple sources including leverage position liquidations and heightened market fluctuations, creating both opportunities and risks for investors.
Regulatory Changes
Regulatory environment modifications represent a critical external factor affecting investment potential. Changes in cryptocurrency regulation across different jurisdictions can substantially impact trading volumes, institutional participation, and overall market dynamics for crypto assets including G.
IV. Investment Landscape and Risk Management
The current investment environment requires sophisticated risk assessment. In high-volatility, high-valuation market conditions, investors face challenges in identifying sustainable alpha opportunities. Market selectivity is increasing, favoring projects with demonstrable competitive advantages and fundamental utility.
Conclusion
Gravity (G) investment value depends on multiple interconnected factors: supply scarcity, institutional adoption levels, macroeconomic conditions, technological development, ESG performance, and regulatory environment. Successful investment decisions require continuous monitoring of these factors and maintaining sensitivity to valuation metrics while respecting macroeconomic risk dynamics. Market participants should adopt active risk management strategies rather than passive approaches in the current volatile environment.
Report Date: December 19, 2025
Disclaimer: This analysis is based solely on information provided in reference materials. Past performance does not guarantee future results. Investment in cryptocurrency assets involves substantial risk, including potential loss of principal. Investors should conduct independent research and consult with qualified financial advisors before making investment decisions.
III. 2025-2030 Price Forecast: G vs LINK
Short-term Forecast (2025)
- G: Conservative $0.00230516 - $0.004433 | Optimistic $0.004433 - $0.00549692
- LINK: Conservative $9.42096 - $12.396 | Optimistic $12.396 - $13.26372
Mid-term Forecast (2027-2028)
- G may enter growth consolidation phase, expected price range $0.00417727 - $0.01016900
- LINK may enter expansion phase, expected price range $13.346261865 - $24.30845990001
- Key drivers: institutional capital inflows, ETF adoption, ecosystem development
Long-term Forecast (2029-2030)
- G: Base scenario $0.00773220 - $0.00955903 | Optimistic scenario $0.01062115 - $0.01395619
- LINK: Base scenario $16.936027 - $24.371356 | Optimistic scenario $28.089020 - $32.657617
Disclaimer: This analysis is based on historical data modeling and market forecasting methodologies. Cryptocurrency markets carry high volatility and risk. Price predictions are not guarantees and should not be considered as investment advice. Investors should conduct their own due diligence and risk assessment before making any trading decisions.
G:
| 年份 | 预测最高价 | 预测平均价格 | 预测最低价 | 涨跌幅 |
|---|---|---|---|---|
| 2025 | 0.00549692 | 0.004433 | 0.00230516 | 0 |
| 2026 | 0.0068019952 | 0.00496496 | 0.0025321296 | 12 |
| 2027 | 0.007766190432 | 0.0058834776 | 0.004177269096 | 32 |
| 2028 | 0.01016900268384 | 0.006824834016 | 0.00505037717184 | 53 |
| 2029 | 0.0106211479374 | 0.00849691834992 | 0.007732195698427 | 91 |
| 2030 | 0.013956188389743 | 0.00955903314366 | 0.007838407177801 | 115 |
LINK:
| 年份 | 预测最高价 | 预测平均价格 | 预测最低价 | 涨跌幅 |
|---|---|---|---|---|
| 2025 | 13.26372 | 12.396 | 9.42096 | 0 |
| 2026 | 15.2675334 | 12.82986 | 9.4940964 | 3 |
| 2027 | 19.949149314 | 14.0486967 | 13.346261865 | 13 |
| 2028 | 24.30845990001 | 16.998923007 | 16.31896608672 | 36 |
| 2029 | 28.0890203767668 | 20.653691453505 | 16.9360269918741 | 66 |
| 2030 | 32.657616926282106 | 24.3713559151359 | 21.203079646168233 | 96 |
Gravity (G) vs Chainlink (LINK) Investment Strategy Comparison Report
IV. Investment Strategy Comparison: Gravity (G) vs Chainlink (LINK)
Long-Term vs Short-Term Investment Strategy
Gravity (G):
- Suitable for risk-tolerant investors seeking exposure to emerging ecosystem tokens with growth potential
- Long-term strategy focuses on ecosystem adoption within Gravity and Galxe platforms; requires patience through market volatility cycles
- Short-term strategy limited due to low liquidity ($22,699.32 daily volume); suitable only for tactical positioning rather than speculation
Chainlink (LINK):
- Suitable for investors seeking established infrastructure exposure with demonstrated market utility and adoption
- Long-term strategy emphasizes oracle infrastructure maturation and institutional capital integration; aligns with blockchain ecosystem expansion
- Short-term strategy benefits from superior liquidity ($9,231,773.07 daily volume) enabling flexible position management
Risk Management and Asset Allocation
Conservative Investor Profile:
- Gravity (G): 0-5% portfolio allocation
- Chainlink (LINK): 5-15% portfolio allocation
- Hedge tools: Stablecoin allocation 50-70%, covered calls, diversified blockchain infrastructure exposure
Aggressive Investor Profile:
- Gravity (G): 10-25% speculative allocation
- Chainlink (LINK): 15-30% core infrastructure allocation
- Hedge tools: Options strategies, cross-token correlation hedging, leverage positions managed through stop-loss protocols
V. Comparative Risk Analysis
Market Risk
Gravity (G):
- Extreme volatility with 92.31% decline from all-time high creates substantial drawdown exposure
- Limited trading volume concentrates liquidity risk; large position entries/exits face significant slippage
- Early-stage project status creates execution and adoption risk
Chainlink (LINK):
- Established market presence with -76.48% decline from all-time high indicates more moderate volatility profile
- Superior liquidity infrastructure reduces execution risk for institutional participants
- Market maturity provides foundation for stability, though -50.13% annual decline signals sector-wide headwinds
Technology Risk
Gravity (G):
- Network infrastructure maturity remains unproven; scaling capabilities and security architecture require ongoing validation
- Dual-ecosystem dependency (Gravity and Galxe) creates technical coordination complexity
- Limited operational history restricts demonstrated resilience through market cycles
Chainlink (LINK):
- Oracle infrastructure centeralization concerns regarding node operator distribution and consensus mechanisms
- Smart contract security history demonstrates both successful performance and vulnerability exposure
- Network uptime dependency on distributed node operator participation creates operational risk factors
Regulatory Risk
Global Regulatory Environment:
- Both tokens face evolving cryptocurrency classification frameworks across major jurisdictions
- Oracle networks (LINK) encounter specific regulatory scrutiny regarding data accuracy and financial data handling
- Utility token classification (G) subject to securities regulation interpretations that vary by jurisdiction
- Staking mechanisms in both protocols may trigger regulatory review regarding investor protection frameworks
VI. Conclusion: Which Is the Better Buy?
📌 Investment Value Summary
Gravity (G) Advantages:
- Emerging ecosystem positioning within dual Gravity-Galxe platform architecture
- Potential upside scenarios through ecosystem adoption and governance participation
- Forecast price appreciation potential of 115% by 2030 in optimistic scenarios
Chainlink (LINK) Advantages:
- Established market leadership in oracle infrastructure with 817,234 active holders
- Institutional adoption and extensive exchange listings (73 platforms) providing superior accessibility
- Demonstrated long-term viability through 8-year operational history since 2017
- Forecast price appreciation potential of 96% by 2030 with lower relative volatility
- Superior liquidity enabling efficient position management across market conditions
✅ Investment Recommendations
Novice Investors:
- Chainlink (LINK) presents more appropriate entry point due to established credibility, superior liquidity, and lower volatility profile
- Recommend educational focus on oracle infrastructure understanding before accumulating positions
- Allocate maximum 5-10% of crypto portfolio exposure to either token
Experienced Investors:
- Chainlink (LINK) suitable for core infrastructure position (10-15% allocation) with long-term horizon
- Gravity (G) appropriate for tactical speculative allocation (5-10%) only after thorough ecosystem research
- Consider two-token allocation strategy leveraging complementary utility profiles
- Monitor ecosystem development metrics for Gravity; track institutional adoption trends for Chainlink
Institutional Investors:
- Chainlink (LINK) provides appropriate infrastructure exposure with established custody solutions, insurance frameworks, and regulatory clarity
- Gravity (G) presents higher complexity requiring specific risk assessment regarding ecosystem viability and market adoption trajectories
- Recommend position building during periods of extreme fear sentiment (currently present) with dollar-cost averaging protocols
- Implement sophisticated hedging strategies given sector-wide downward pressure (-50% annual decline for LINK; -84.55% for G)
Risk Warnings
⚠️ Critical Disclaimers:
Cryptocurrency markets demonstrate extreme volatility with current Fear & Greed Index at 16 (Extreme Fear). Past performance does not guarantee future results. Both tokens have experienced substantial drawdowns from all-time highs. Price forecasts represent statistical modeling exercises and should not be interpreted as investment guarantees or financial advice.
This analysis constitutes educational material only and does not constitute investment, legal, or financial advice. Investors must conduct independent due diligence, understand blockchain technology fundamentals, assess personal risk tolerance, and consult qualified financial advisors before making investment decisions. Cryptocurrency investments carry substantial risk of partial or total principal loss.
Report Date: December 19, 2025
Data Sources: Reference materials provided as of December 19, 2025 None
Gravity (G) vs Chainlink (LINK) Investment Comparison - FAQ
I. Fundamental Differences
Q1: What are the core differences between Gravity (G) and Chainlink (LINK) tokens?
A: Gravity (G) is a native utility token launched in 2024 serving the Gravity network and Galxe ecosystem, functioning as a gas token, staking mechanism, and governance token. Chainlink (LINK), established in 2017, is an ERC-20 token that compensates node operators for oracle services—retrieving off-chain data, formatting it for blockchain use, executing computations, and ensuring network uptime. LINK also serves as a staking mechanism to prevent malicious network participation. Essentially, G represents an emerging ecosystem token, while LINK represents established oracle infrastructure.
Q2: How do the market capitalizations compare?
A: Chainlink dominates significantly with a market capitalization of $8.648 billion compared to Gravity's $32.055 million—approximately 270 times larger. LINK commands 0.39% market dominance versus G's 0.0016%. LINK is listed on 73 exchanges with 817,234 holders, while G appears on 36 exchanges with only 24,659 holders, indicating substantially greater institutional adoption and market accessibility.
II. Price Performance and Volatility
Q3: What is the current price performance comparison between these tokens?
A: As of December 19, 2025, Gravity trades at $0.004432 (declined 92.31% from all-time high of $0.05764), while Chainlink trades at $12.411 (declined 76.48% from all-time high of $52.70). Over the past 24 hours, G gained 5.9% while LINK gained 1.32%. However, over 1-year, G declined 84.55% versus LINK's 50.13% decline. G experiences extreme volatility with significantly lower trading volume ($22,699 daily) compared to LINK ($9.23 million daily).
Q4: Which token shows better recent momentum?
A: Short-term momentum favors Gravity with 24-hour gains of 5.9% versus Chainlink's 1.32%. However, this represents a minor technical rebound rather than substantive trend reversal. Examining 7-day performance reveals both tokens declining—G down 20.29% and LINK down 11.45%—indicating current market-wide pressure consistent with the extreme fear sentiment environment (Fear & Greed Index: 16).
III. Supply and Tokenomics
Q5: How do the token supply mechanisms differ?
A: Gravity maintains a total supply of 12 billion tokens with 7.23 billion circulating (60.27% circulation ratio), providing substantial inflation potential. Chainlink has a total supply of 1 billion tokens with 696.85 million circulating (69.68% circulation ratio), featuring a more established supply distribution. G's lower circulation percentage indicates more tokens remain locked or reserved, while LINK's higher percentage suggests a more mature token distribution phase with greater supply certainty.
IV. Risk Assessment and Volatility
Q6: What are the primary risk factors for each investment?
A: For Gravity: extreme volatility (92.31% ATH decline), liquidity concerns (minimal trading volume), early-stage risk (2024 launch), concentration risk (limited holder base), and ecosystem dependency on Gravity and Galxe adoption. For Chainlink: regulatory uncertainty regarding oracle networks, infrastructure dependency on node operators, growing competitive threats from alternative oracle solutions, and persistent market headwinds evidenced by 50% annual decline. The current cryptocurrency market operates under extreme fear conditions, amplifying risks for both assets.
Q7: Which token is more suitable for conservative investors?
A: Chainlink is substantially more appropriate for conservative investors. It offers established market credibility (8-year operational history), superior liquidity enabling efficient trading, broader institutional adoption (817,234 holders), and more predictable price behavior despite recent declines. Conservative investors should allocate maximum 5-10% to cryptocurrency exposure, with LINK preferred over G. Gravity should represent minimal portfolio allocation (0-5%) for conservative profiles due to extreme volatility and early-stage status.
V. Investment Horizon and Forecasting
Q8: What are the price forecasts for 2030, and which offers better long-term potential?
A: Price forecasting models project Gravity reaching $0.01396 (base case) to $0.01396 (optimistic case) by 2030, representing 115-215% appreciation from current levels. Chainlink forecasts predict $24.37 (base case) to $32.66 (optimistic case) by 2030, representing 96-163% appreciation. While percentage appreciation appears comparable, Chainlink's forecast emerges from an established position with lower volatility risk, whereas Gravity's forecast depends heavily on unproven ecosystem adoption. The forecast confidence level substantially favors Chainlink given its operational track record. Both projections assume continued cryptocurrency market relevance and institutional adoption—outcomes not guaranteed in evolving regulatory environments.
Report Date: December 19, 2025
Disclaimer: This analysis constitutes educational material based on provided reference data and does not represent investment advice. Cryptocurrency investments carry substantial risk including potential total principal loss. Past performance does not guarantee future results. Investors must conduct independent due diligence and consult qualified financial advisors before making investment decisions. Current market conditions reflect extreme fear sentiment with elevated volatility across digital assets.
Share
How to Buy Cryptocurrency


Trending Cryptocurrencies


What is the Current Market Cap and Trading Volume of Hyperliquid (HYPE) in 2025?
ADX vs LINK: Comparing Two Leading Oracle and Data Solutions for Blockchain Applications
BTRST vs AAVE: Comparing Two Leading Governance Tokens in the DeFi Ecosystem
ENSO vs QNT: A Comprehensive Comparison of Climate Oscillation Patterns and Quantum Computing Technologies
PUNDIX vs GRT: A Comprehensive Comparison of Two Leading Blockchain Utility Tokens

2025 LOFI Price Prediction: Expert Analysis and Market Forecast for the Coming Year

How Do MACD and RSI Indicators Signal ZORA Price Recovery in 2025?
What are the key derivatives market signals for crypto trading in 2026: futures open interest, funding rates, and liquidation data explained
PEPE Coin Price Predictions and Market Analysis
How does macroeconomic policy impact crypto prices: Federal Reserve, inflation, and market volatility explained
What is DPY: A Comprehensive Guide to Discord.py Library for Bot Development