


BTC Short Setup: Resistance Rejection in Play
Bitcoin at $76,374 faces critical resistance as multiple technical factors converge for a potential pullback. The 5-minute window presents an optimal short entry as momentum shows early exhaustion signs.
Current Market Structure
While BTC posts a 1.69% daily gain, the price action reveals concerning details beneath the surface. The rejection from $76,891 high just $117 below psychological $77,000 creates a lower-high pattern on shorter timeframes. Volume profile shows distribution characteristics with declining participation on the latest push higher.
Technical Bearish Signals
Multiple timeframe analysis points to impending correction:
- 15-minute RSI showing bearish divergence (price higher, RSI lower)
- Stochastic oscillator in overbought territory above 80, primed for reversal
- $76,800-$77,000 zone represents heavy supply with three prior rejections
- Rising wedge pattern visible on 5-minute chart bearish breakdown pattern
- Volume declining on each successive higher high (bearish divergence)
Support levels appear vulnerable:
- First support: $75,800 (20-period EMA)
- Critical support: $74,698 (today's low)
- Breakdown target: $73,500-$74,000 zone
Why Short Makes Sense
The "higher for longer" Fed narrative creates macro headwinds that crypto cannot ignore indefinitely. With rates at 3.50%-3.75% and policymakers warning of potential 2027 hikes, risk assets face sustained pressure. Chicago Fed President Goolsbee explicitly tied rate decisions to Middle East oil prices creating uncertainty that markets dislike.
Institutional flows, while positive, show signs of saturation. The $1.9B ETF weekly inflow—while impressive represents a deceleration from peak levels. When institutional buying pauses, gravity takes over.
Bitcoin's correlation with Nasdaq remains elevated during risk-off periods. Traditional equity weakness European futures down 1.2% recently typically drags crypto lower despite the "digital gold" narrative.
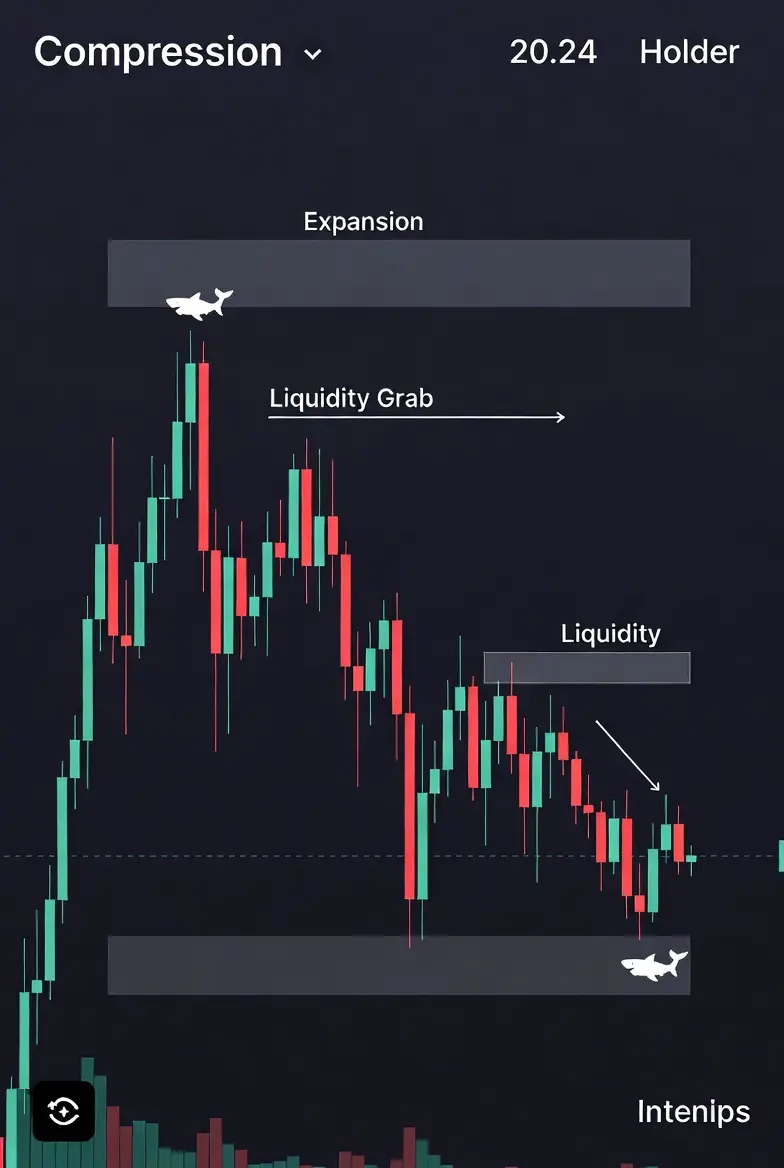
The symmetrical triangle consolidation since March suggests energy building for expansion. Given the proximity to resistance and overbought short-term conditions, the path of least resistance points downward for a liquidity sweep before any sustainable move higher.
Risk Management
Invalidation level: Clean break above $77,000 with volume confirmation
Target zone: $75,200-$75,500
Stop consideration: $77,150
Markets rarely move in straight lines. After a 7.7% monthly gain, profit-taking pressure outweighs FOMO chasing at resistance.
Bitcoin at $76,374 faces critical resistance as multiple technical factors converge for a potential pullback. The 5-minute window presents an optimal short entry as momentum shows early exhaustion signs.
Current Market Structure
While BTC posts a 1.69% daily gain, the price action reveals concerning details beneath the surface. The rejection from $76,891 high just $117 below psychological $77,000 creates a lower-high pattern on shorter timeframes. Volume profile shows distribution characteristics with declining participation on the latest push higher.
Technical Bearish Signals
Multiple timeframe analysis points to impending correction:
- 15-minute RSI showing bearish divergence (price higher, RSI lower)
- Stochastic oscillator in overbought territory above 80, primed for reversal
- $76,800-$77,000 zone represents heavy supply with three prior rejections
- Rising wedge pattern visible on 5-minute chart bearish breakdown pattern
- Volume declining on each successive higher high (bearish divergence)
Support levels appear vulnerable:
- First support: $75,800 (20-period EMA)
- Critical support: $74,698 (today's low)
- Breakdown target: $73,500-$74,000 zone
Why Short Makes Sense
The "higher for longer" Fed narrative creates macro headwinds that crypto cannot ignore indefinitely. With rates at 3.50%-3.75% and policymakers warning of potential 2027 hikes, risk assets face sustained pressure. Chicago Fed President Goolsbee explicitly tied rate decisions to Middle East oil prices creating uncertainty that markets dislike.
Institutional flows, while positive, show signs of saturation. The $1.9B ETF weekly inflow—while impressive represents a deceleration from peak levels. When institutional buying pauses, gravity takes over.
Bitcoin's correlation with Nasdaq remains elevated during risk-off periods. Traditional equity weakness European futures down 1.2% recently typically drags crypto lower despite the "digital gold" narrative.
The symmetrical triangle consolidation since March suggests energy building for expansion. Given the proximity to resistance and overbought short-term conditions, the path of least resistance points downward for a liquidity sweep before any sustainable move higher.
Risk Management
Invalidation level: Clean break above $77,000 with volume confirmation
Target zone: $75,200-$75,500
Stop consideration: $77,150
Markets rarely move in straight lines. After a 7.7% monthly gain, profit-taking pressure outweighs FOMO chasing at resistance.