The current market shows obvious bullish strength but short-term overbought characteristics.
Below is a detailed analysis and operational advice based on technical indicators (Bollinger Bands BOLL, MACD, KDJ):
1. Market Trend Analysis
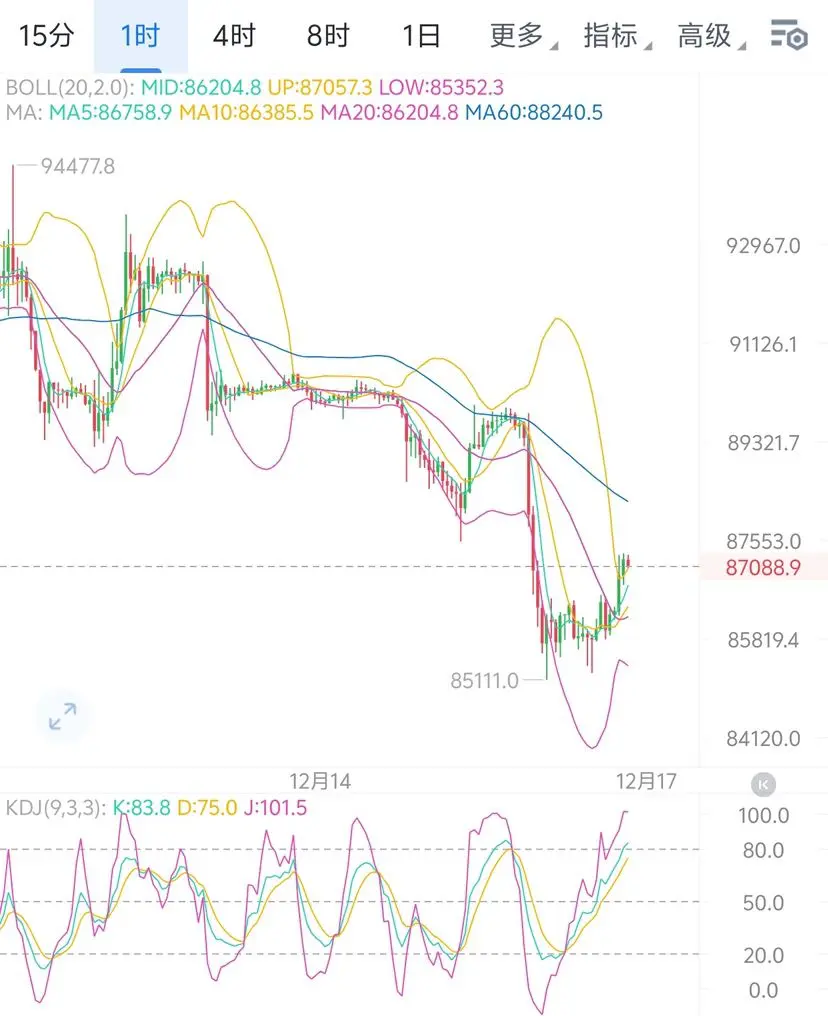
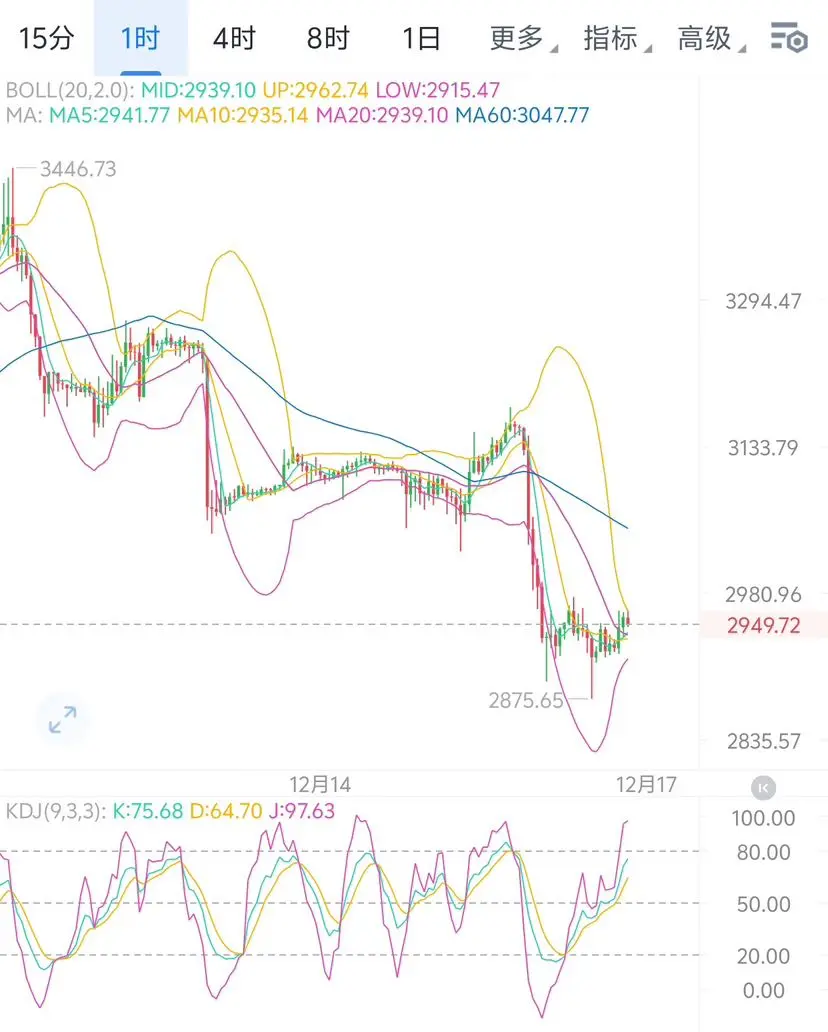
• Daily Level (1D): Trend turning stronger. Price has volume-broken through the middle band of Bollinger Bands (around 2962), moving upward toward the upper band (3051). MACD green bars are expanding, a golden cross has just appeared, indicating a warming trend.
• 4-Hour Level (4H): Very strong momentum. Price is running along the upper band of Bollinger Bands (3068), in a typical “one-sided upward” pattern. However, the J value in the KDJ indicator has reached about 85, in the overbought zone, suggesting short-term consolidation or pullback is needed.
• 1-Hour / 15-Minute Level: Short-term rally followed by a pullback. After touching around 3108, the price retreated to about 3071, showing significant resistance at the 3100 level.
2. Key Level Consolidation
• Resistance Levels:
• First Resistance: 3100 - 3110 (recent high, psychological barrier)
• Strong Resistance: 3150 (previous dense trading zone)
• Support Levels:
• First Support: 3030 - 3050 (1-hour Bollinger middle band, support at the breakout point of the daily upper band)
• Core Support: 2980 - 3000 (4-hour Bollinger middle band, dividing line between strength and weakness)
3. Trading Strategy Suggestions
Long Position Plan: Wait for a pullback to enter (higher win rate)
Since the current price is at a short-term high, directly chasing long positions may lead to shakeouts.
• Entry Point: It is recommended to wait for the price to pull back to around 3030 - 3050 before entering.
• Small Stop Loss: Set at 2995 (breaking below 3000 psychological barrier and 4-hour middle band would invalidate the bullish logic).
• Target: Aim for 3100, and after breaking through, look toward 3150.
Short Position Plan: Play for a pullback at high levels (counter-trend operation)
The current upward momentum is strong, so shorting requires extreme caution and is only recommended as a short-term play.
• Safe Entry: Scenario A: When the price tests 3100 - 3110 a second time without breaking through and shows a volume-increasing bearish candle.
• Scenario B: If volume breaks through 3110, watch for false breakout signals around 3145 - 3155.
• Stop Loss: Place above 3165.
• Target: Look toward around 3050.
Core Summary
Ethereum is currently in a bullish phase, and trading should mainly focus on “buying on dips.”
• Risk Reminder: The 15-minute chart has started to show decreasing volume and consolidation. If support at 3050 cannot hold, there may be a retracement toward the 3000 level. Be sure to strictly execute stop losses.
$ETH #我的2026第一条帖 #ETH走势分析 #GateCEO2025年终公开信 #策略 #Gate广场
Below is a detailed analysis and operational advice based on technical indicators (Bollinger Bands BOLL, MACD, KDJ):
1. Market Trend Analysis
• Daily Level (1D): Trend turning stronger. Price has volume-broken through the middle band of Bollinger Bands (around 2962), moving upward toward the upper band (3051). MACD green bars are expanding, a golden cross has just appeared, indicating a warming trend.
• 4-Hour Level (4H): Very strong momentum. Price is running along the upper band of Bollinger Bands (3068), in a typical “one-sided upward” pattern. However, the J value in the KDJ indicator has reached about 85, in the overbought zone, suggesting short-term consolidation or pullback is needed.
• 1-Hour / 15-Minute Level: Short-term rally followed by a pullback. After touching around 3108, the price retreated to about 3071, showing significant resistance at the 3100 level.
2. Key Level Consolidation
• Resistance Levels:
• First Resistance: 3100 - 3110 (recent high, psychological barrier)
• Strong Resistance: 3150 (previous dense trading zone)
• Support Levels:
• First Support: 3030 - 3050 (1-hour Bollinger middle band, support at the breakout point of the daily upper band)
• Core Support: 2980 - 3000 (4-hour Bollinger middle band, dividing line between strength and weakness)
3. Trading Strategy Suggestions
Long Position Plan: Wait for a pullback to enter (higher win rate)
Since the current price is at a short-term high, directly chasing long positions may lead to shakeouts.
• Entry Point: It is recommended to wait for the price to pull back to around 3030 - 3050 before entering.
• Small Stop Loss: Set at 2995 (breaking below 3000 psychological barrier and 4-hour middle band would invalidate the bullish logic).
• Target: Aim for 3100, and after breaking through, look toward 3150.
Short Position Plan: Play for a pullback at high levels (counter-trend operation)
The current upward momentum is strong, so shorting requires extreme caution and is only recommended as a short-term play.
• Safe Entry: Scenario A: When the price tests 3100 - 3110 a second time without breaking through and shows a volume-increasing bearish candle.
• Scenario B: If volume breaks through 3110, watch for false breakout signals around 3145 - 3155.
• Stop Loss: Place above 3165.
• Target: Look toward around 3050.
Core Summary
Ethereum is currently in a bullish phase, and trading should mainly focus on “buying on dips.”
• Risk Reminder: The 15-minute chart has started to show decreasing volume and consolidation. If support at 3050 cannot hold, there may be a retracement toward the 3000 level. Be sure to strictly execute stop losses.
$ETH #我的2026第一条帖 #ETH走势分析 #GateCEO2025年终公开信 #策略 #Gate广场