GoldK-lineCrazyLittle
#BTC 能否站上 $80K? The market has fallen from a continuous decline to a sudden rebound, with the US stock market starting to rebound by 10%.
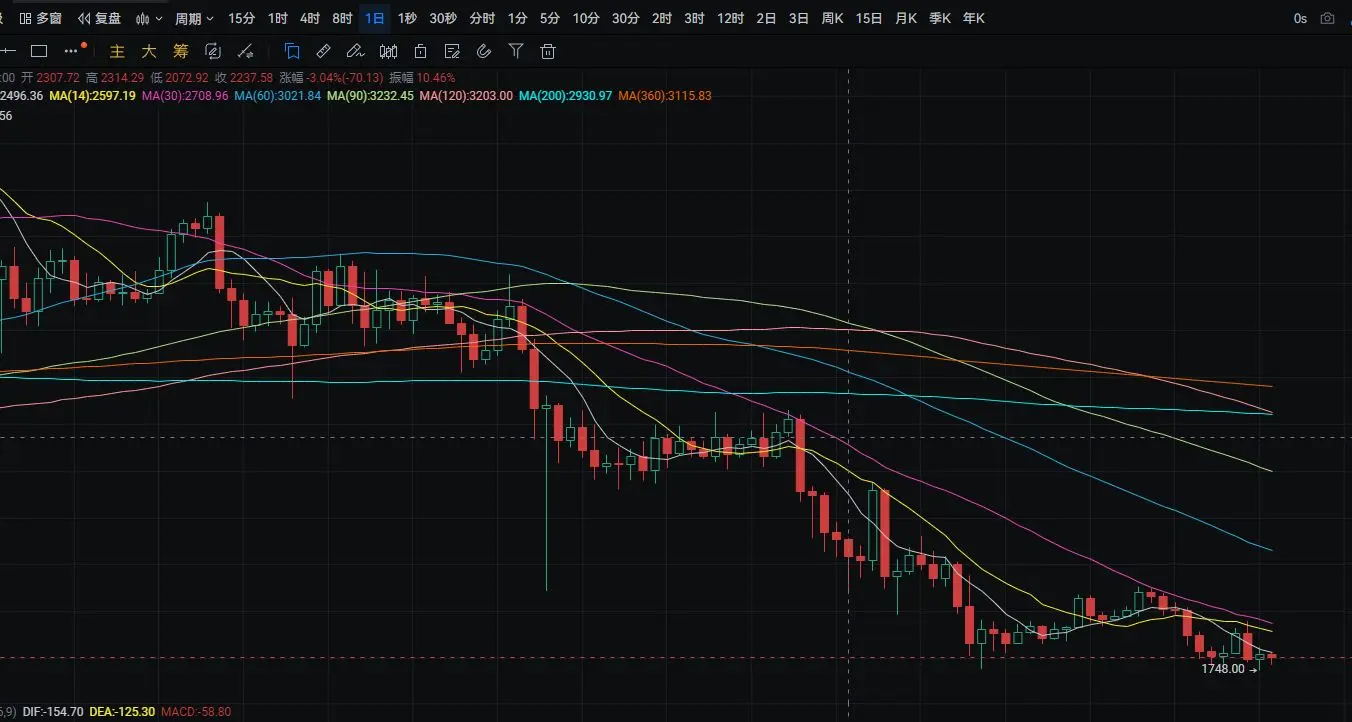
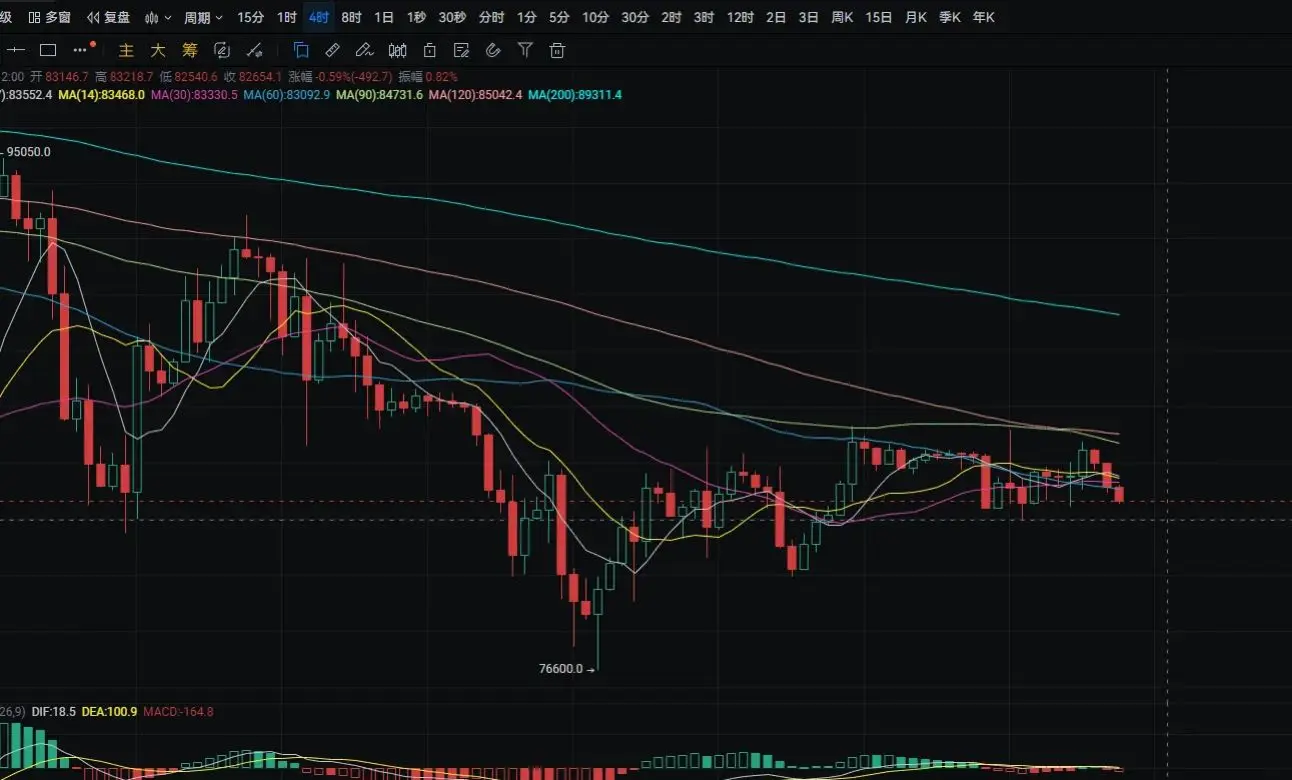
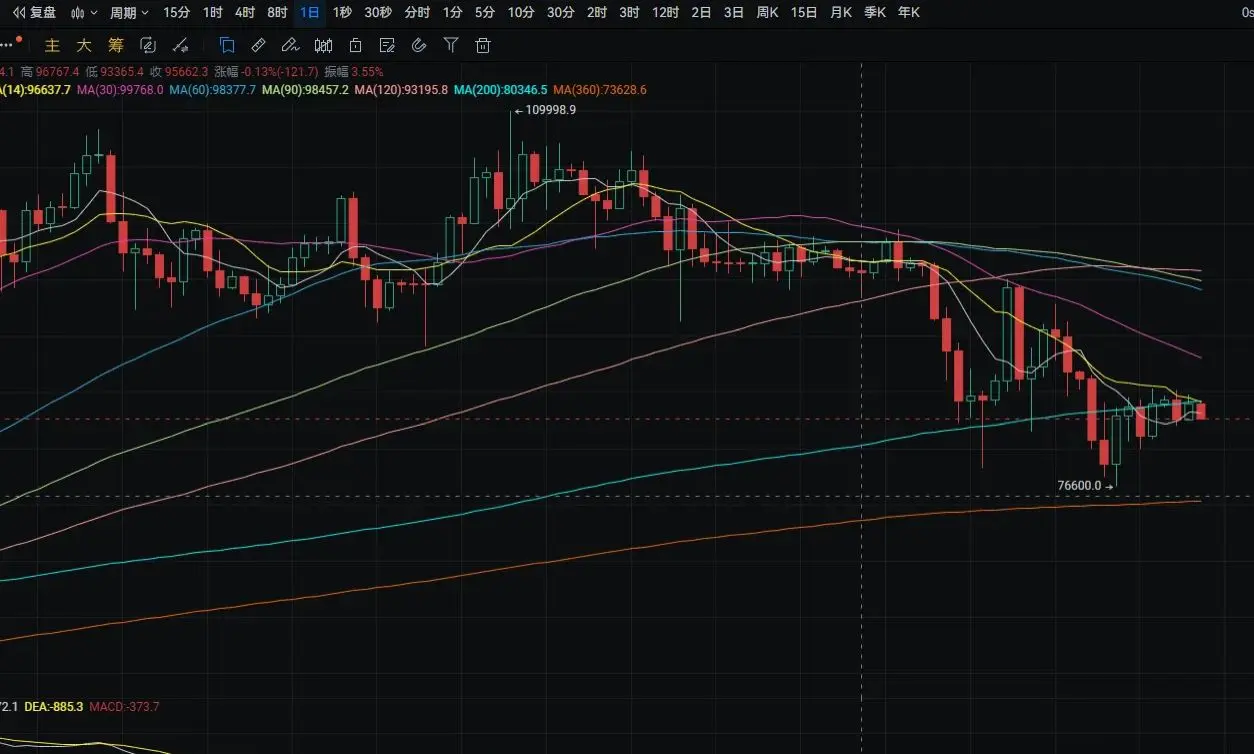
The daily chart for Bitcoin started from around 78400 yesterday, with a lowest dip to around 74500 and a highest spike to around 81250, closing at around 79200. The support level is near 79000; if it falls below, we can look towards the MA360 yearly line. A pullback can be used to buy nearby. The resistance level is at the MA30; if it breaks, we can look towards around 85000. A rebound nearby can be used to sell. The MACD shows increased bearish momentum. On
View OriginalThe daily chart for Bitcoin started from around 78400 yesterday, with a lowest dip to around 74500 and a highest spike to around 81250, closing at around 79200. The support level is near 79000; if it falls below, we can look towards the MA360 yearly line. A pullback can be used to buy nearby. The resistance level is at the MA30; if it breaks, we can look towards around 85000. A rebound nearby can be used to sell. The MACD shows increased bearish momentum. On