Trade
Trading Type
Spot
Trade crypto freely
Pre-Market
Trade new tokens before they are officially listed
Margin
Magnify your profit with leverage
Convert & Block Trading
0 Fees
Trade any size with no fees and no slippage
Alpha
Points
Get promising tokens in streamlined on-chain trading
Leveraged Tokens
Get exposure to leveraged positions simply
Futures
Futures
Hundreds of contracts settled in USDT or BTC
Options
HOT
Trade European-style vanilla options
Unified Account
Maximize your capital efficiency
Demo Trading
Futures Kickoff
Get prepared for your futures trading
Futures Events
Participate in events to win generous rewards
Demo Trading
Use virtual funds to experience risk-free trading
Earn
Launch
CandyDrop
Collect candies to earn airdrops
Launchpool
Quick staking, earn potential new tokens
HODLer Airdrop
Hold GT and get massive airdrops for free
Launchpad
Be early to the next big token project
Alpha Points
NEW
Trade on-chain assets and enjoy airdrop rewards!
Futures Points
NEW
Earn futures points and claim airdrop rewards
Investment
Simple Earn
Earn interests with idle tokens
Auto-Invest
Auto-invest on a regular basis
Dual Investment
Buy low and sell high to take profits from price fluctuations
Soft Staking
Earn rewards with flexible staking
Crypto Loan
0 Fees
Pledge one crypto to borrow another
Lending Center
One-stop lending hub
VIP Wealth Hub
Customized wealth management empowers your assets growth
Private Wealth Management
Customized asset management to grow your digital assets
Quant Fund
Top asset management team helps you profit without hassle
Staking
Stake cryptos to earn in PoS products
Smart Leverage
NEW
No forced liquidation before maturity, worry-free leveraged gains
GUSD Minting
Use USDT/USDC to mint GUSD for treasury-level yields
More
Promotions
Activity Center
Join activities and win big cash prizes and exclusive merch
Referral
20 USDT
Earn 40% commission or up to 500 USDT rewards
Announcements
Announcements of new listings, activities, upgrades, etc
Gate Blog
Crypto industry articles
VIP Services
Huge fee discounts
Proof of Reserves
Gate promises 100% proof of reserves
GateUser-f161e137
No content yet
GateUser-f161e137
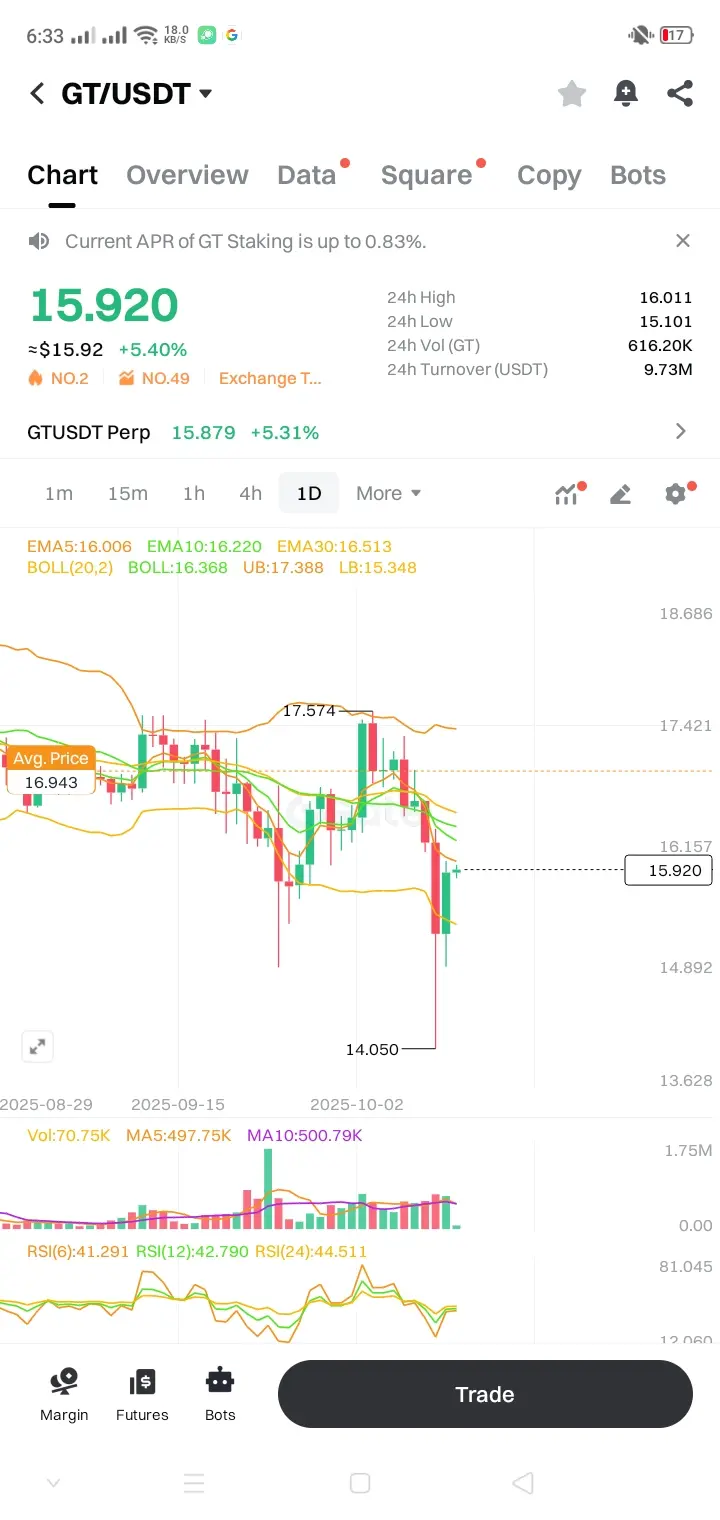
**GT/USDT Signal (1D):**
Trend weak bearish but rebounding.
✅ **Buy zone:** 15.5–15.8
🎯 **Target:** 16.5–17.0
🛑 **Stop-loss:** 14.8
Trend weak bearish but rebounding.
✅ **Buy zone:** 15.5–15.8
🎯 **Target:** 16.5–17.0
🛑 **Stop-loss:** 14.8
GT0,87%

- Reward
- like
- 1
- Repost
- Share
Pavelwill:
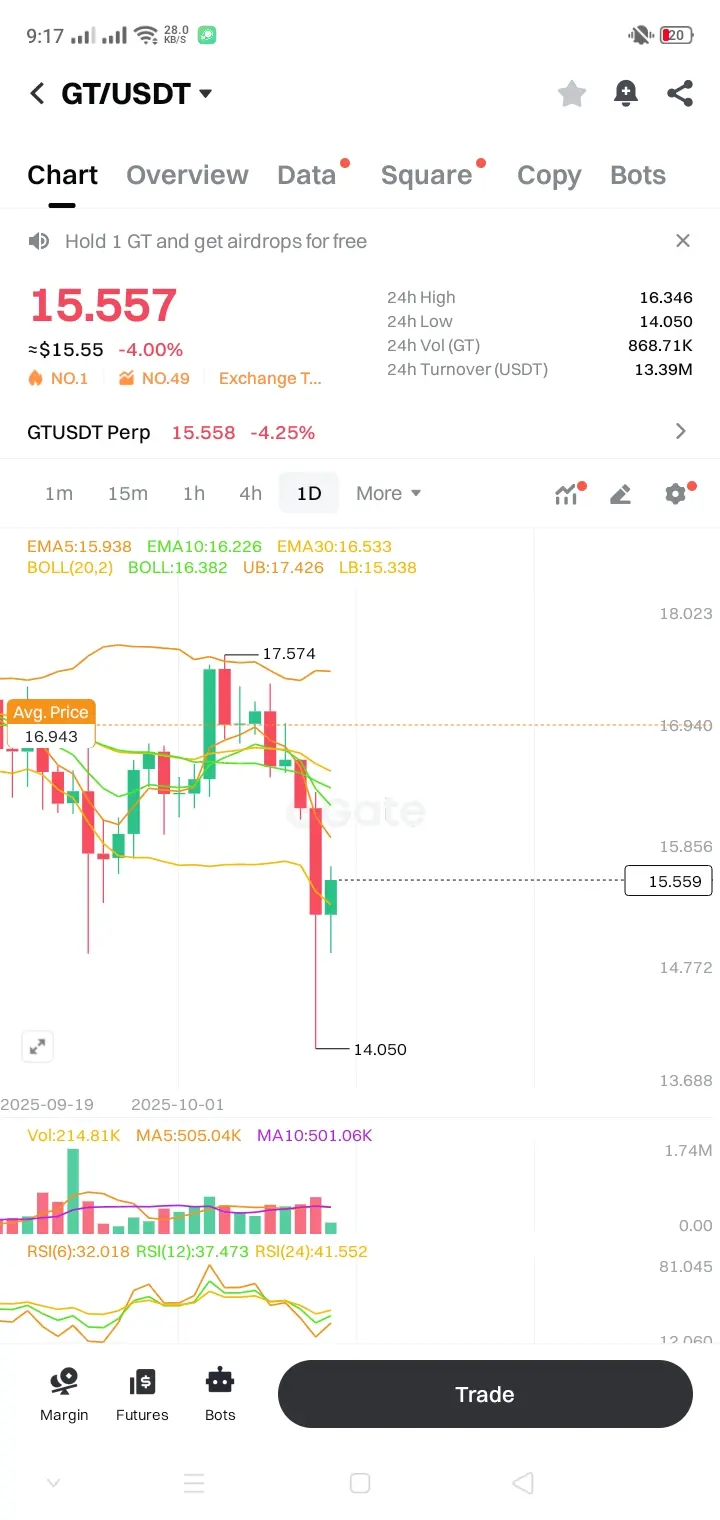
Hold on tight 💪**GT/USDT Signal (1D):**
Bearish but near support.
💰 **Buy zone:** $14.2–$14.5
🎯 **Targets:** $15.9 → $16.3 → $17.0
🛑 **Stop-loss:** $13.9
📉 Wait for candle close above $15.9 for confirmation.
Bearish but near support.
💰 **Buy zone:** $14.2–$14.5
🎯 **Targets:** $15.9 → $16.3 → $17.0
🛑 **Stop-loss:** $13.9
📉 Wait for candle close above $15.9 for confirmation.
GT0,87%

- Reward
- like
- Comment
- Repost
- Share
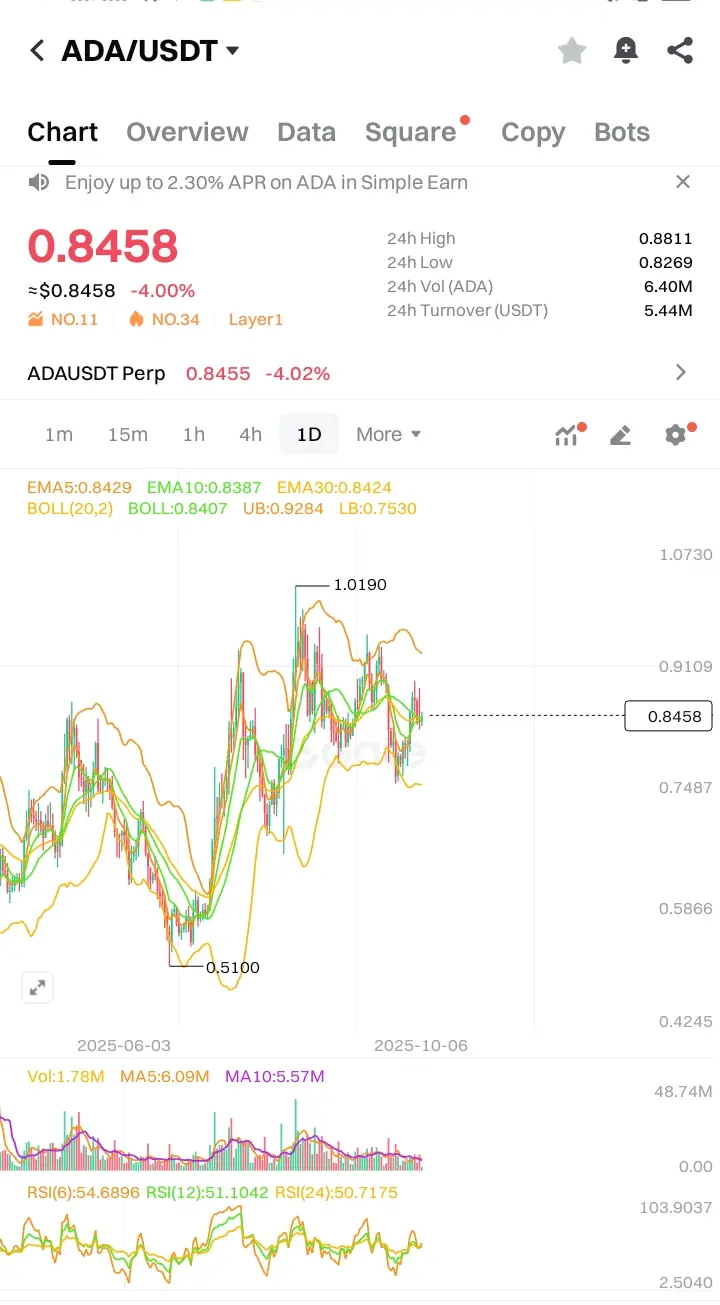
**ADA/USDT Spot Signal (1D):**
* **Buy Zone:** 0.82 – 0.84
* **Target:** 0.90 – 0.92
* **Stop Loss:** <0.81
* **Trend:** Neutral → Mild Bullish (needs breakout above 0.86–0.87 for confirmation)
👉 Signal: **Cautious Long / Accumulation**
* **Buy Zone:** 0.82 – 0.84
* **Target:** 0.90 – 0.92
* **Stop Loss:** <0.81
* **Trend:** Neutral → Mild Bullish (needs breakout above 0.86–0.87 for confirmation)
👉 Signal: **Cautious Long / Accumulation**
ADA7,86%
- Reward
- like
- Comment
- Repost
- Share
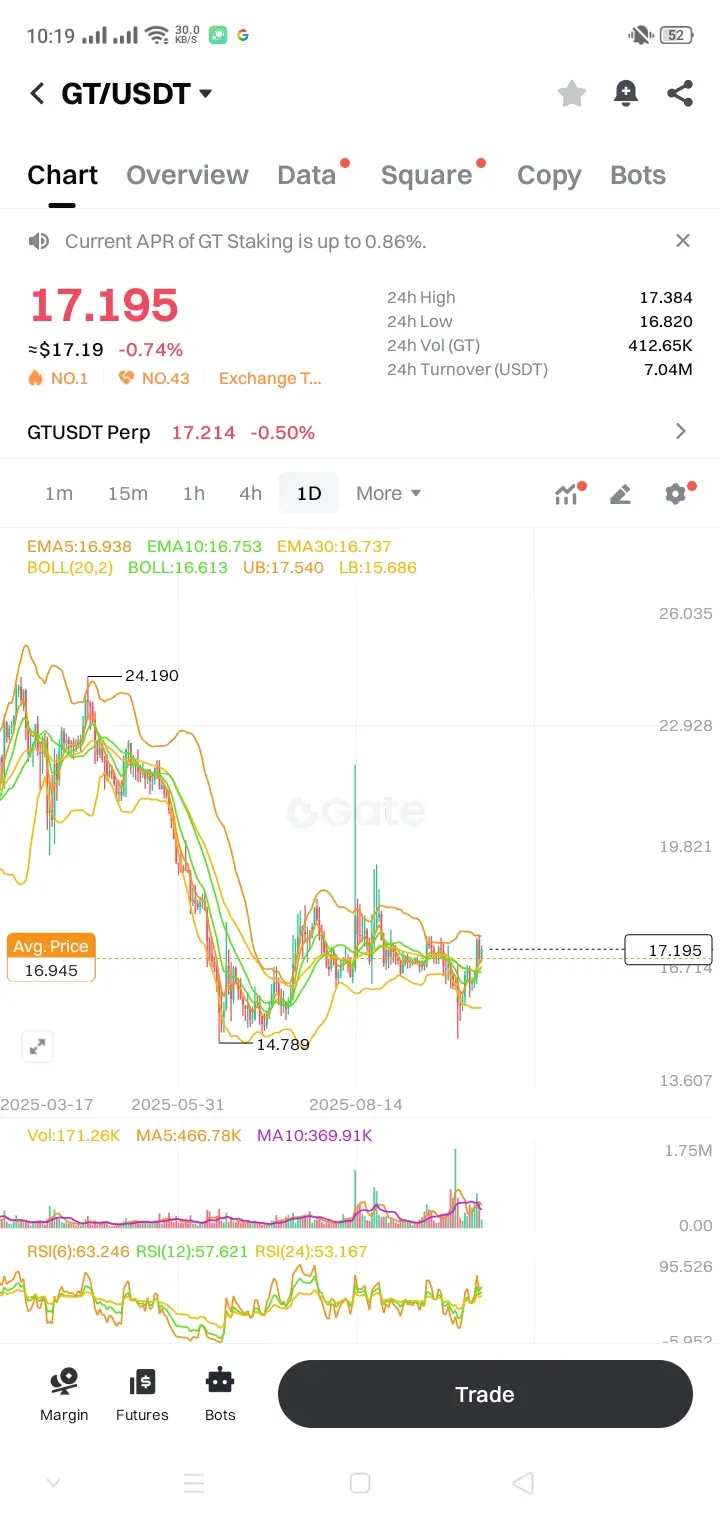
**GT/USDT Spot Signal (Short):**
* Trend: Bullish bias
* Entry: $17.10 – $17.20 (or above $17.40 breakout)
* Target: $18.20 – $19.00
* Stop-loss: $16.70
👉 Signal: **Buy on breakout or dips above $16.70**
* Trend: Bullish bias
* Entry: $17.10 – $17.20 (or above $17.40 breakout)
* Target: $18.20 – $19.00
* Stop-loss: $16.70
👉 Signal: **Buy on breakout or dips above $16.70**
GT0,87%

- Reward
- 3
- 3
- Repost
- Share
Mert55:
Watching Closely 🔍View More
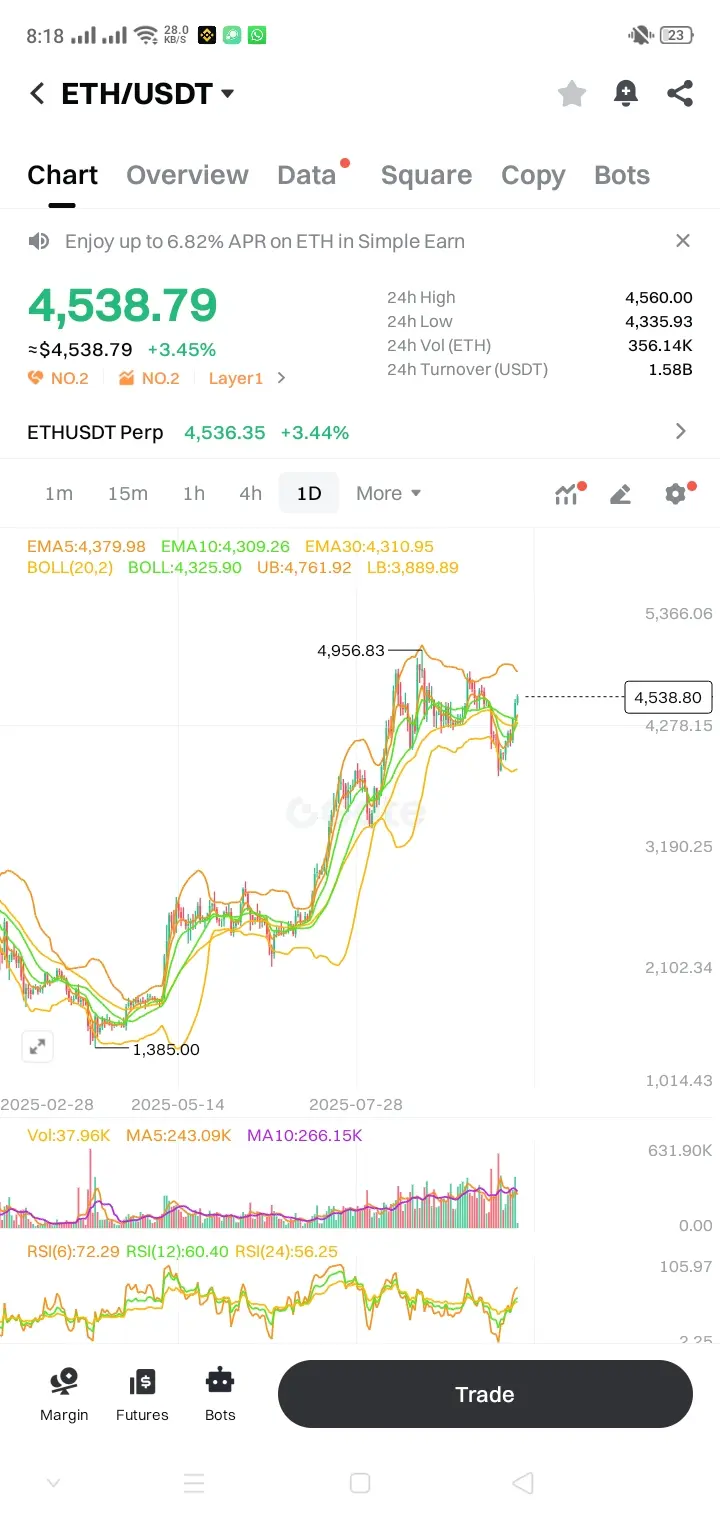
ETH
Trading Plan (Spot)
Entry Zone: $4,480 – $4,520 (current breakout level)
Target 1: $4,650
Target 2: $4,760 (upper Bollinger band)
Target 3: $4,950 (recent swing high)
Stop-loss: below $4,300 (EMA10/30 support)
#eth
Trading Plan (Spot)
Entry Zone: $4,480 – $4,520 (current breakout level)
Target 1: $4,650
Target 2: $4,760 (upper Bollinger band)
Target 3: $4,950 (recent swing high)
Stop-loss: below $4,300 (EMA10/30 support)
#eth
ETH1,96%

- Reward
- like
- Comment
- Repost
- Share
Spot Trading Signal
Short-term (1D view):
Neutral to mild bullish — Possible bounce toward $16.6–$17.0 if support at $16.1 holds.
Support Levels:
$16.10 (immediate)
$15.70 (stronger)
Resistance Levels:
$16.60 (EMA30 & Bollinger Mid)
$17.50 (Bollinger Upper Band)
Suggested Signal:
Conservative Entry: Buy near $16.1–$16.2 (support zone).
Target: $16.6 → $17.0.
Stop-loss: Below $15.7.
⚠️ Market is still in accumulation/sideways phase, so avoid heavy positions unless volume breakout occurs above $17.5.

- Reward
- like
- Comment
- Repost
- Share
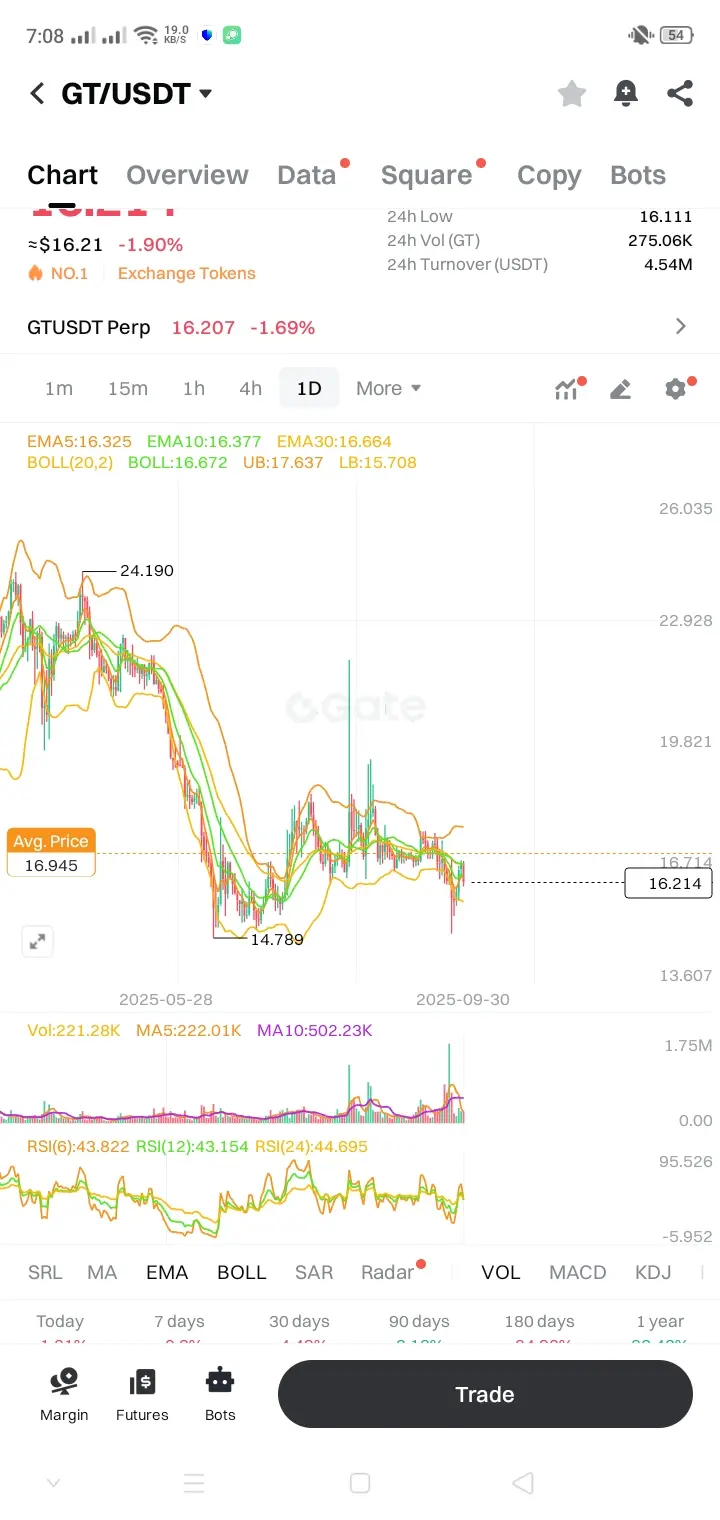
🔎 Chart Insights (1D timeframe)
Current Price: $16.21
24h Range: $16.11 – $16.71
EMA Levels:
EMA5: 16.32
EMA10: 16.37
EMA30: 16.66
➝ Price is slightly below short-term EMAs → mild bearish pressure.
Bollinger Bands (20,2):
Upper Band: 17.63
Basis: 16.67
Lower Band: 15.71
➝ Price ($16.21) is closer to the lower band → near oversold area, potential bounce if support holds.
RSI (Relative Strength Index):
RSI(6): 43.8
RSI(12): 43.1
RSI(24): 44.7
➝ All RSI values are below 50 → bearish but not oversold yet (oversold <30).
Volume: Spikes observed recently, but overall average volume is moderate → no
- Reward
- like
- Comment
- Repost
- Share
### GT/USDT Spot Trading Signal (Short)
- **Current Price**: $15.70
- **Trend**: Bearish (price below EMAs, SAR dots above, negative MACD).
- **Signal**: Sell / Hold Short
- **Entry**: $15.70 or $16.00 (resistance)
- **Targets**: $15.00, $14.50
- **Stop-Loss**: $16.50
- **Timeframe**: 1–3 days
- **Invalidation**: Bullish MACD crossover or volume >50K GT
GT0,87%

- Reward
- 1
- 5
- Repost
- Share
Zenitsuu:
2025 GOGOGO 👊View More
# BTC/USDT Spot Trading Signal (Sep 26, 2025)
- **Current Price:** $108,840 USDT (+0.43%)
- **Signal:** Weak Buy (Short-Term Bounce)
- **Entry:** $108,500–$108,800
- **Stop-Loss:** $107,000
- **Take-Profit:** $110,500 or $112,000
- **Rationale:** Price near lower Bollinger Band (~107,263), RSI ~34 (oversold), neutral oscillators. EMAs overhead as resistance.
- **Risk:** Break below $107,000 targets $100,000. Use 1–2% position size.
Not financial advice—monitor real-time data.
BTC0,6%
- Reward
- like
- Comment
- Repost
- Share
- Reward
- like
- Comment
- Repost
- Share
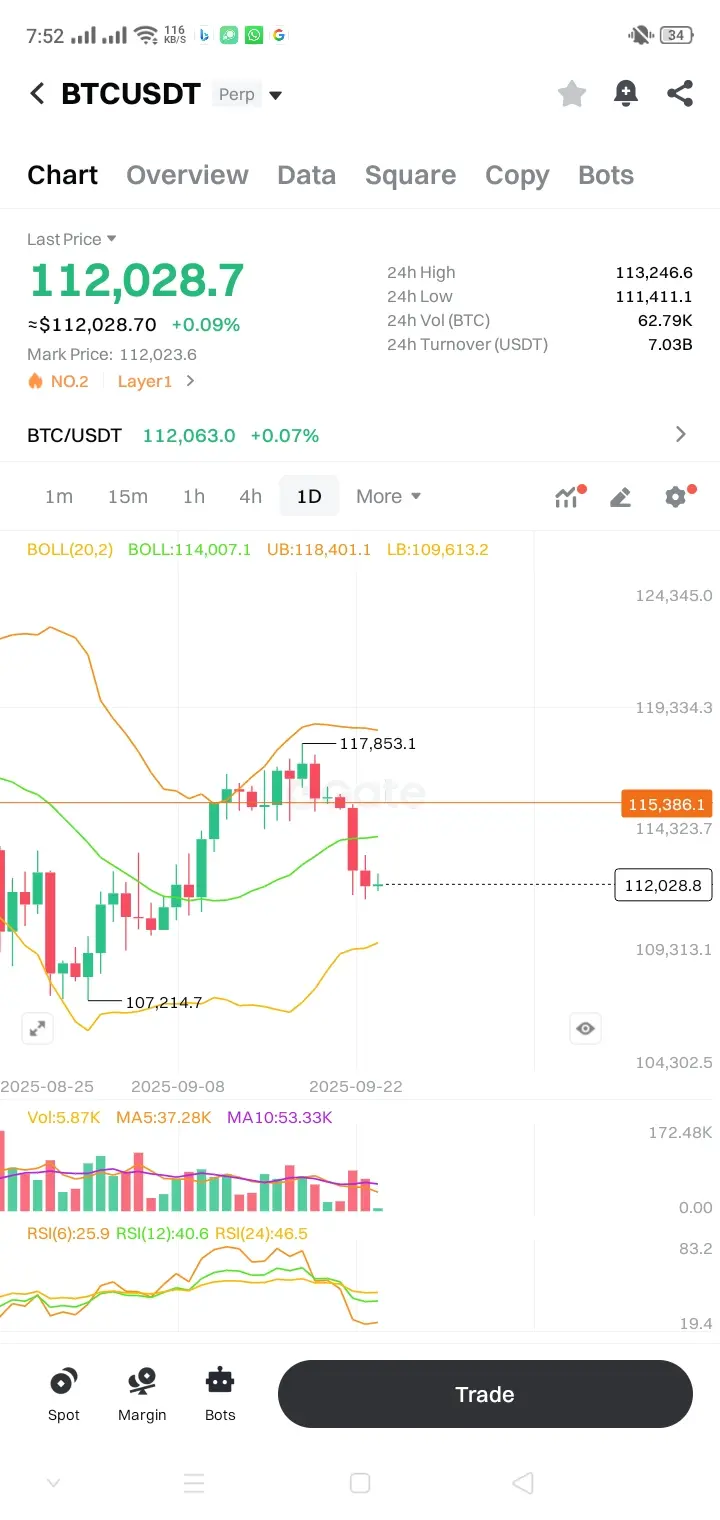
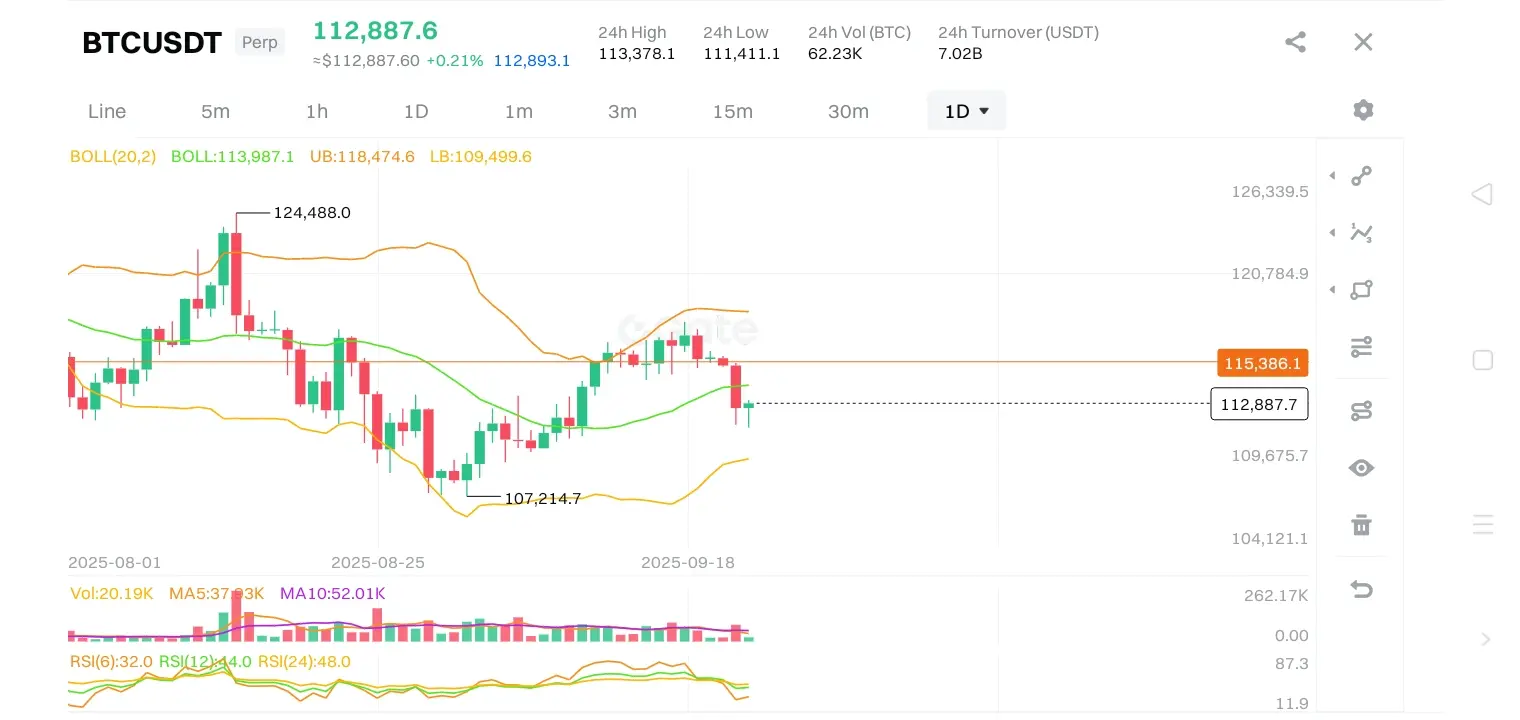
Spot And Future Trade Sngle
Spot Trad Entry 112,100
Spot TP 115,300
Future Trad Entry 112,100
Future TP 115,300
Spot Trad Entry 112,100
Spot TP 115,300
Future Trad Entry 112,100
Future TP 115,300
BTC0,6%
- Reward
- like
- Comment
- Repost
- Share
Future And Spot Trading Signal
Spot Trading Entry (112,900)
Future Trading Entry (112,900)
Spot TP (115,800)
Future TP(115,800)
Spot Trading Entry (112,900)
Future Trading Entry (112,900)
Spot TP (115,800)
Future TP(115,800)
BTC0,6%
- Reward
- like
- Comment
- Repost
- Share
- Reward
- like
- Comment
- Repost
- Share
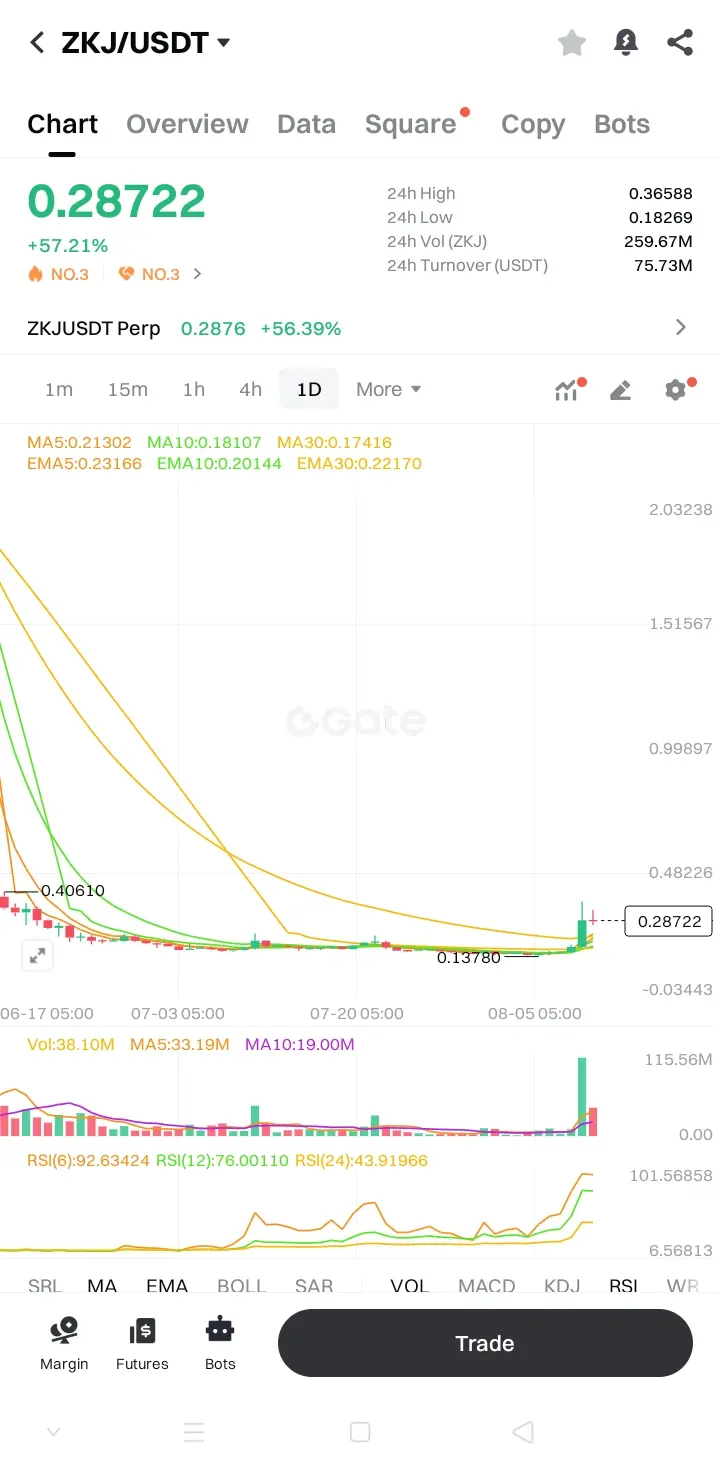
*ZKJ/USDT Spot Trading Signal*
*Current Price:* 0.28722 USDT
*24h Change:* +57.21%
*24h High:* 0.36588 USDT
*24h Low:* 0.18269 USDT
*24h Volume (ZKJ):* 259.67M
*24h Turnover (USDT):* 75.73M
*Technical Analysis:*
The chart shows a significant upward trend in the ZKJ/USDT pair over the past day, with a notable increase in trading volume. The RSI (6) is at 92.63424, indicating a strong bullish momentum. However, the RSI (24) is at 43.91966, suggesting a potential reversal or consolidation in the longer term.
*Trading Signal:*
Buy ZKJ/USDT at the current price of 0.28722 USDT.
*Stop Loss:* 0.18269
- Reward
- like
- Comment
- Repost
- Share
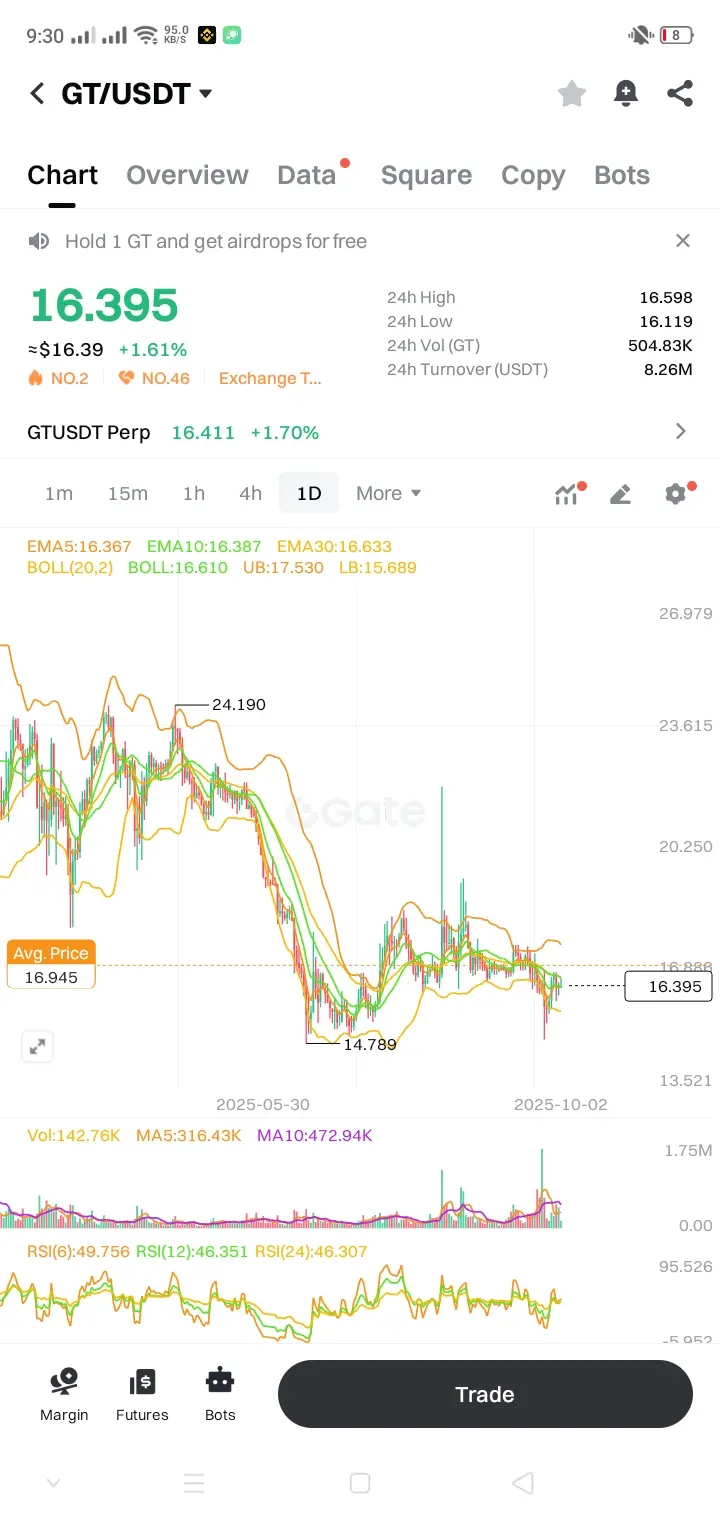
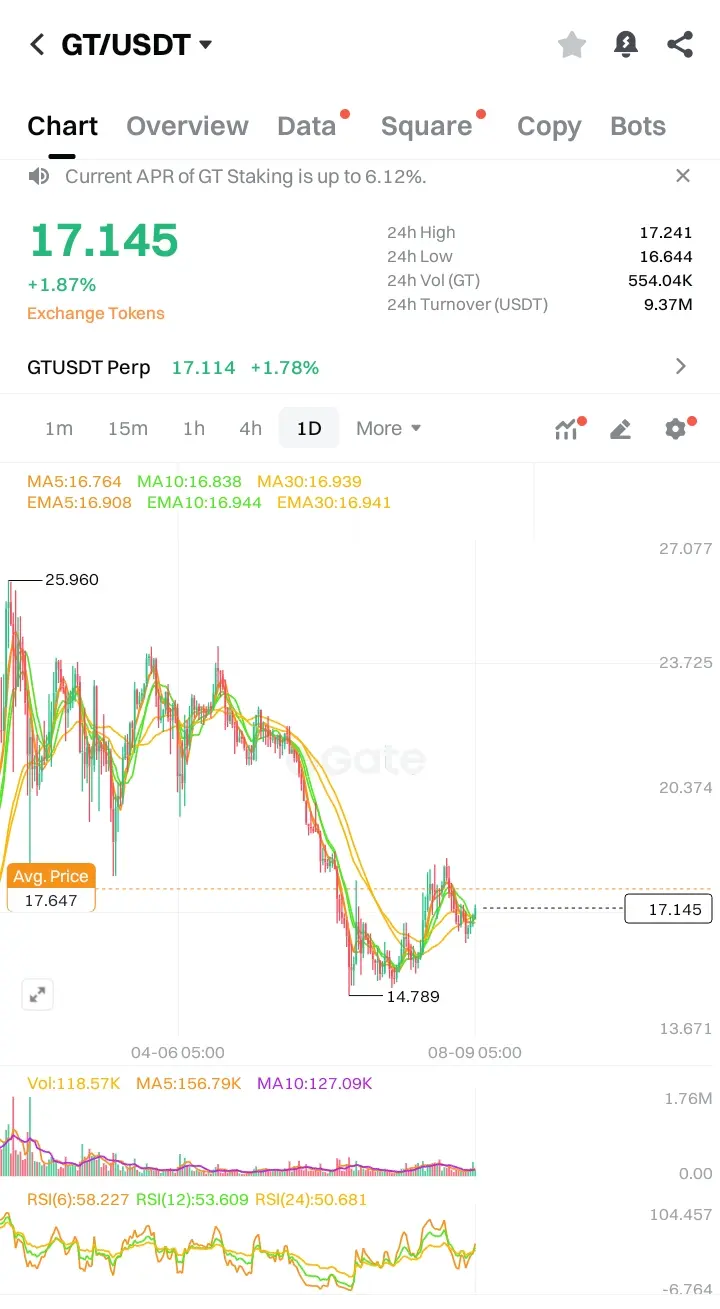
Based on the GT/USDT chart:
1. *Current Price*: 17.145 USDT, with a +1.87% change.
2. *24-hour Trading Range*: High: 17.241, Low: 16.644.
3. *Volume*: 554.04K GT, Turnover: 9.37M USDT.
4. *Moving Averages (MA)*: MA5: 16.764, MA10: 16.838, MA30: 16.939.
5. *Exponential Moving Averages (EMA)*: EMA5: 16.908, EMA10: 16.944, EMA30: 16.941.
6. *RSI Values*: RSI(6): 58.227, RSI(12): 53.609, RSI(24): 50.681.
The chart shows a recovery from a low of 14.789 to the current price of 17.145. The MA and EMA lines are close to the current price, indicating a potential trend stabilization. The RSI values sugg
- Reward
- 1
- Comment
- Repost
- Share
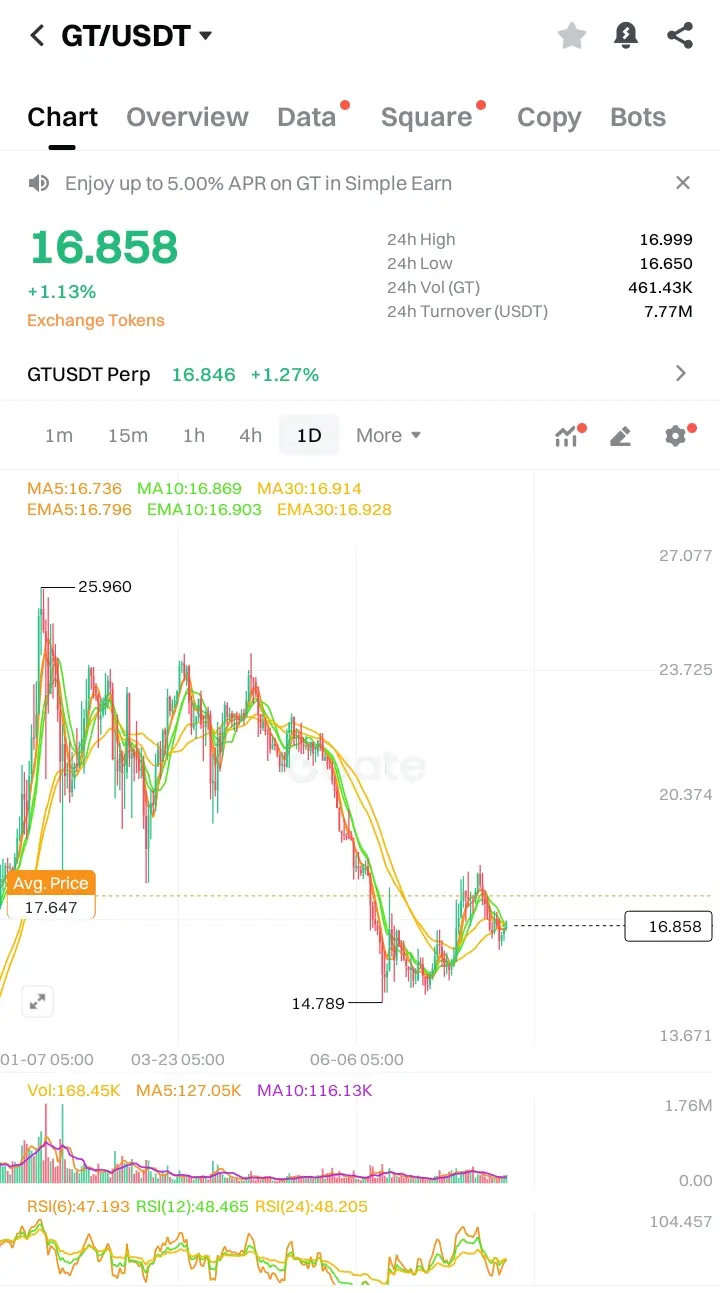
1. *Current Price and Percentage Change*: The current price of GT/USDT is 16.858 USDT, with a 1.13% increase.
2. *24-hour Trading Data*: The 24-hour high is 16.999 USDT, and the low is 16.650 USDT. The trading volume for GT in the last 24 hours is 461.43K, with a turnover of 7.77M USDT.
3. *GTUSDT Perp*: This refers to the perpetual contract for GT/USDT, currently priced at 16.846 USDT with a 1.27% increase.
4. *Chart Timeframe*: The chart is set to display data over a 1-day period, as indicated by the "1D" button being selected.
5. *Moving Averages (MA) and Exponential Moving Averages (EMA)*:
- Reward
- 1
- Comment
- Repost
- Share
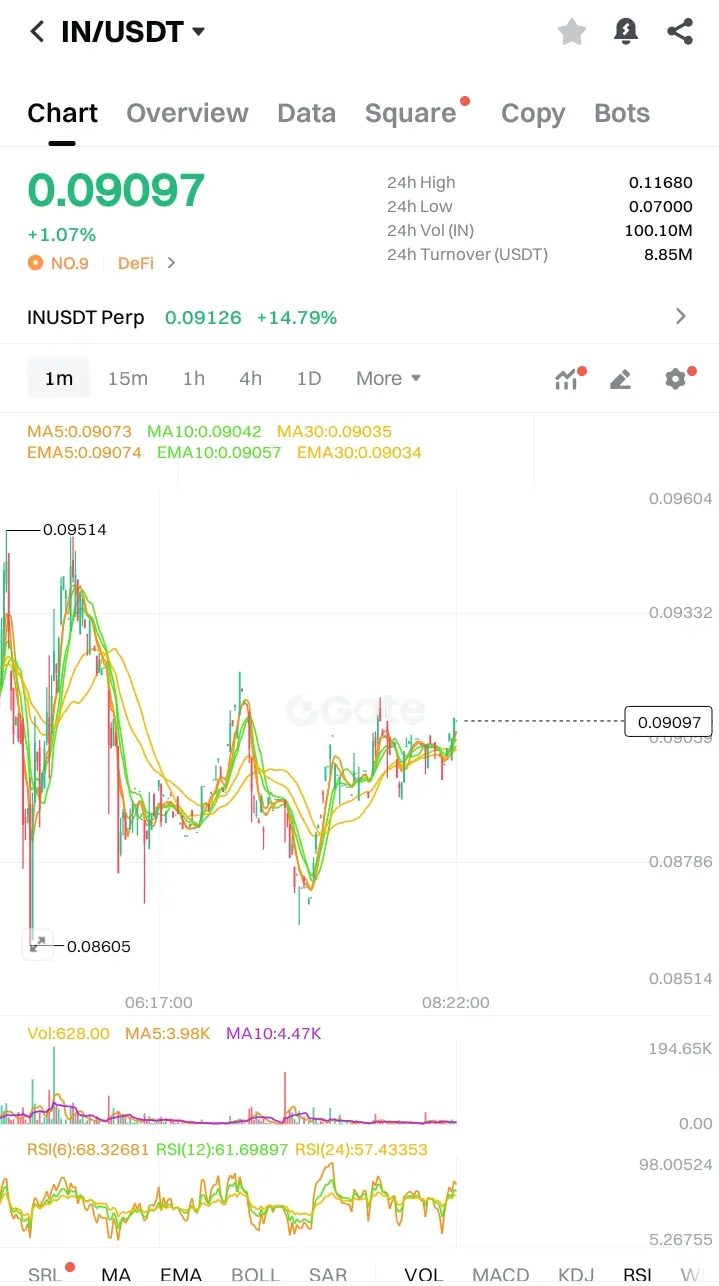
The chart shows a bullish trend for IN/USDT, with the price above EMAS (0.09074, 0.09057, 0.09034) and RSI values (68.32681, 61.69897, 57.43353) indicating no overbought condition. Potential buy signal: consolidate above 0.09514, stop-loss below 0.08605. Potential sell signal: break below 0.08605, stop-loss above 0.09514.
IN6,25%
- Reward
- like
- Comment
- Repost
- Share
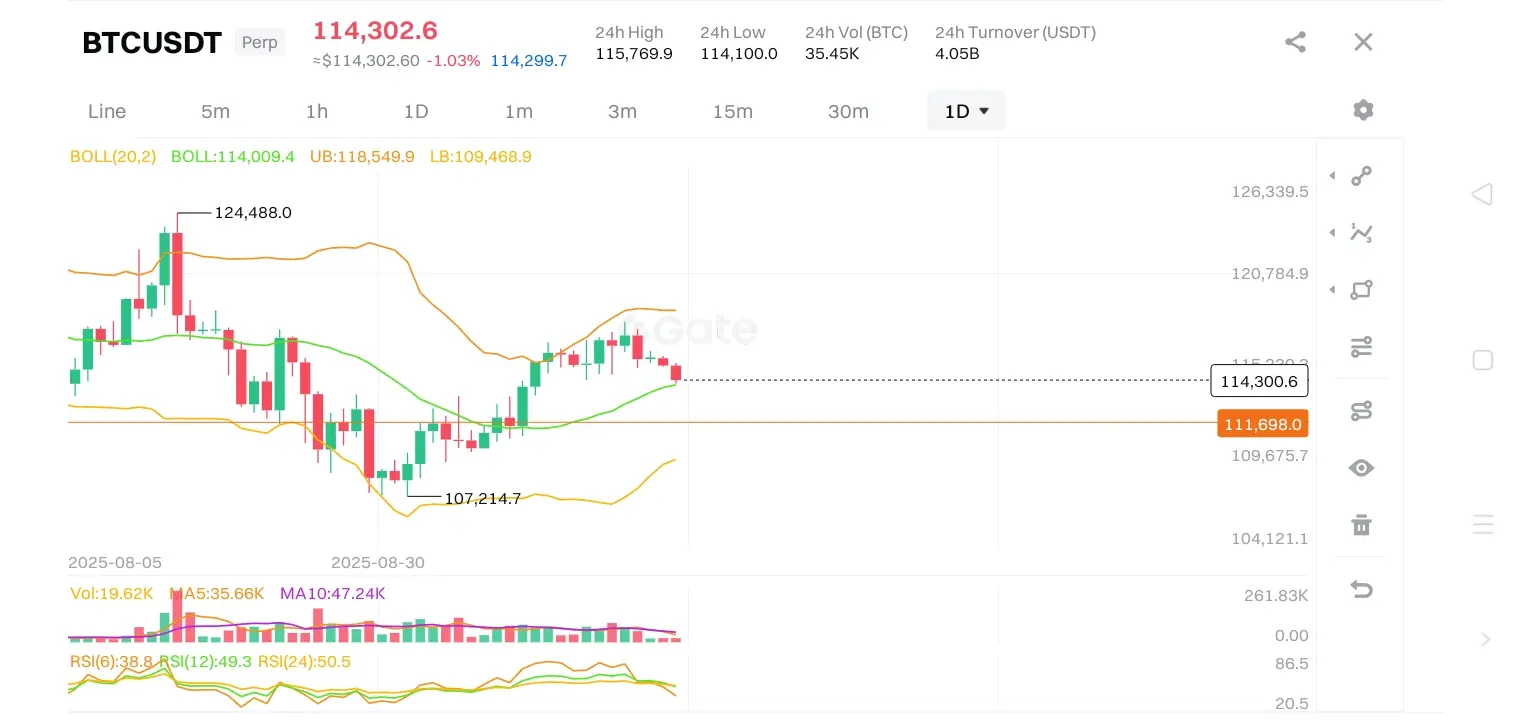
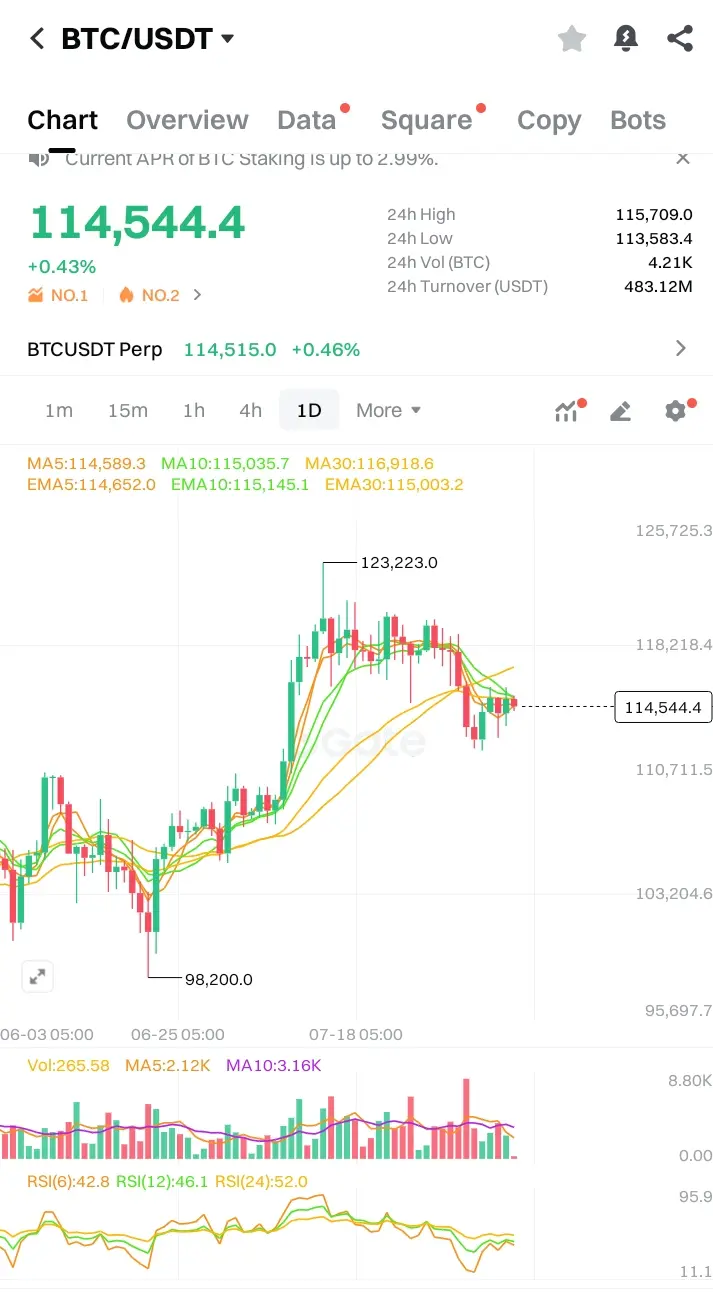
*Chart Overview*
The chart displays the BTC/USDT pair on a 1-day timeframe. The current price is 114,544.4 USDT, with a 24-hour high of 115,709.0 USDT and a low of 113,583.4 USDT.
*SMC & ICT Analysis*
1. *Liquidity Zones*: The chart shows a significant price swing from around 98,200 to 123,223, indicating a potential liquidity zone at the lower end (around 98,200) and the upper end (around 123,223). These zones are likely to be areas where institutional traders have placed their buy or sell orders.
2. *Order Blocks*: There are visible order blocks around the 98,200 and 123,223 levels. An order
- Reward
- 1
- Comment
- Repost
- Share
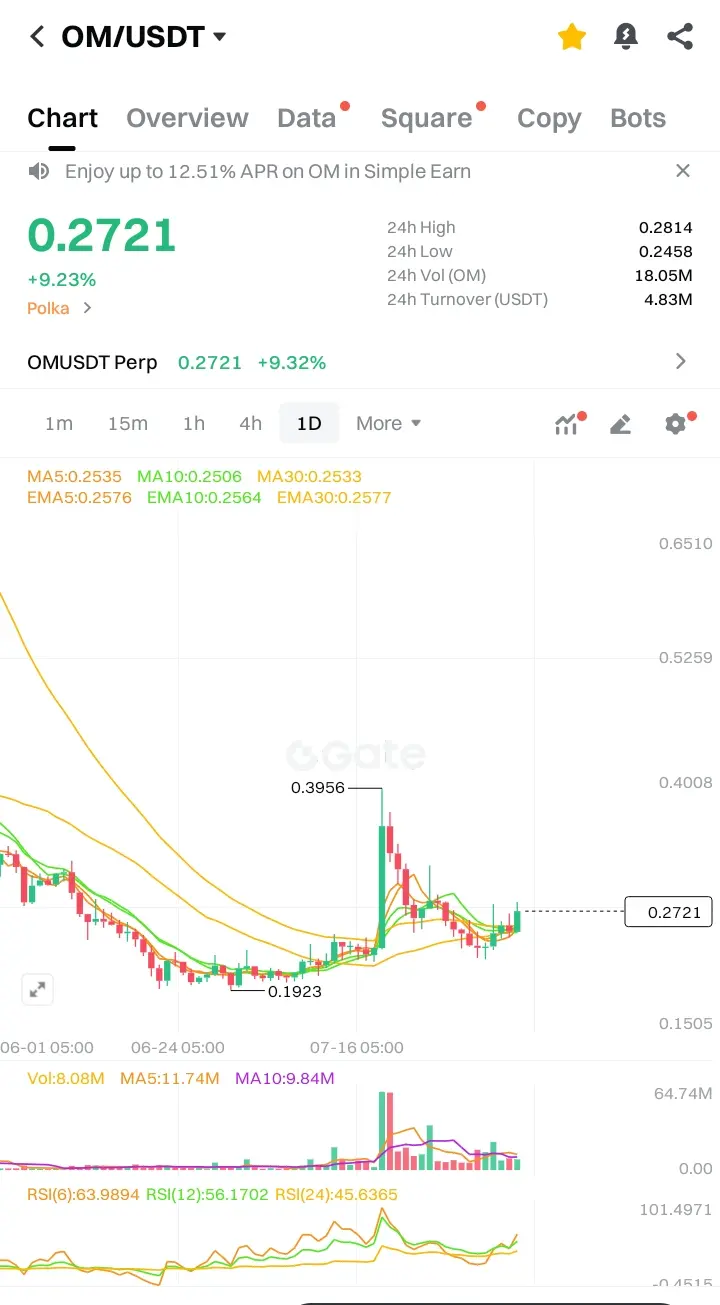
The OM/USDT chart shows a bullish trend with potential for further upside. Consider buying around current levels or on a retrace to EMA support (0.2576 USDT) with a stop-loss below 0.1923 USDT. Monitor price action and adjust strategies accordingly.
- Reward
- 1
- Comment
- Repost
- Share
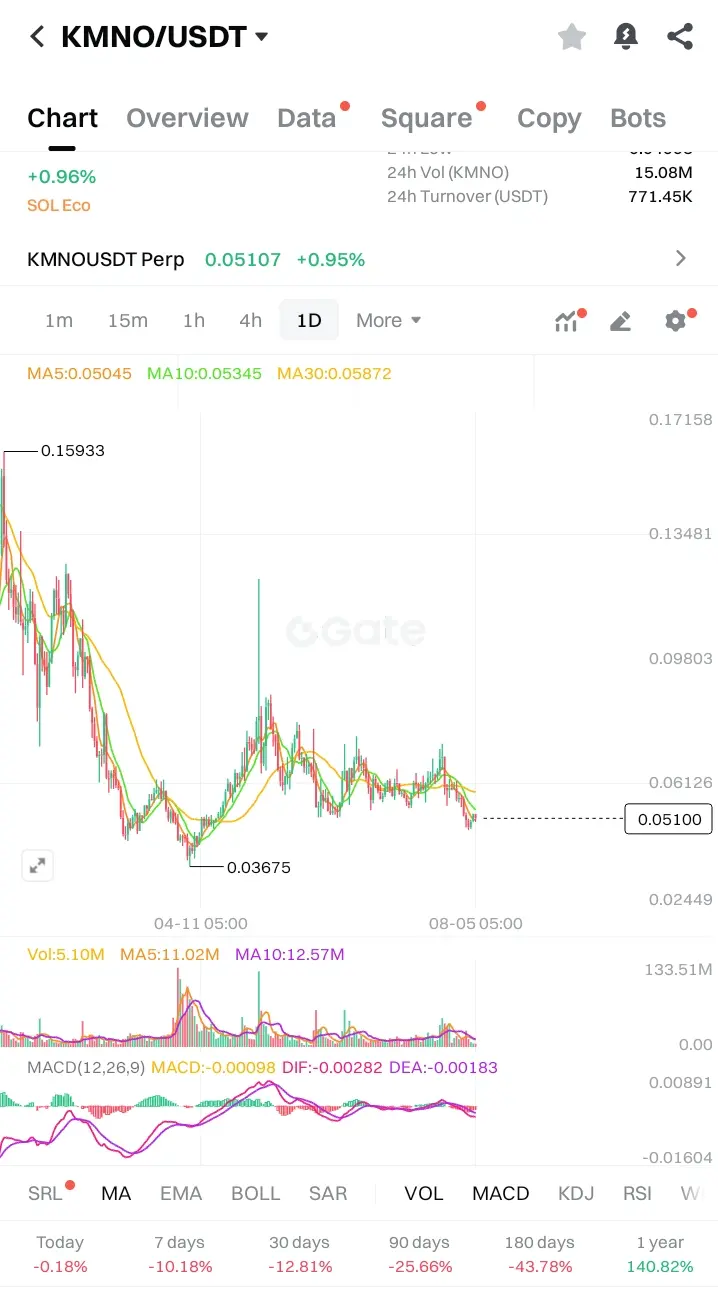
The image shows a chart for the cryptocurrency pair KMNO/USDT, displaying its price movement over time. The chart indicates a downward trend, with the price decreasing from 0.15933 to 0.05100. The current price is 0.05107, with a 0.95% increase.
To predict the future price, we can analyze the chart and look for patterns or trends. The chart shows a significant drop in price from April 11 to August 5, with some fluctuations. The moving averages (MA5, MA10, and MA30) are also decreasing, indicating a bearish trend.
The MACD (Moving Average Convergence Divergence) indicator is negative, suggestin
- Reward
- like
- Comment
- Repost
- Share
Trending Topics
View More19.02K Popularity
48.71K Popularity
58.91K Popularity
90.71K Popularity
3.93K Popularity
Pin