Trade
Basic
Futures
Futures
Hundreds of contracts settled in USDT or BTC
TradFi
Gold
Trade global traditional assets with USDT in one place
Options
Hot
Trade European-style vanilla options
Unified Account
Maximize your capital efficiency
Demo Trading
Futures Kickoff
Get prepared for your futures trading
Futures Events
Participate in events to win generous rewards
Demo Trading
Use virtual funds to experience risk-free trading
Earn
Launch
CandyDrop
Collect candies to earn airdrops
Launchpool
Quick staking, earn potential new tokens
HODLer Airdrop
Hold GT and get massive airdrops for free
Launchpad
Be early to the next big token project
Alpha Points
Trade on-chain assets and enjoy airdrop rewards!
Futures Points
Earn futures points and claim airdrop rewards
Investment
Simple Earn
Earn interests with idle tokens
Auto-Invest
Auto-invest on a regular basis
Dual Investment
Buy low and sell high to take profits from price fluctuations
Soft Staking
Earn rewards with flexible staking
Crypto Loan
0 Fees
Pledge one crypto to borrow another
Lending Center
One-stop lending hub
VIP Wealth Hub
Customized wealth management empowers your assets growth
Private Wealth Management
Customized asset management to grow your digital assets
Quant Fund
Top asset management team helps you profit without hassle
Staking
Stake cryptos to earn in PoS products
Smart Leverage
New
No forced liquidation before maturity, worry-free leveraged gains
GUSD Minting
Use USDT/USDC to mint GUSD for treasury-level yields
More
BullRadar
No content yet
BullRadar
🚨 Crypto market news on September 1, 2025
▪︎ $WLFI listed on mainstream exchanges
The Trump family's token is now live on Binance, OKX, and Bybit, transitioning from a governance tool to the mass market.
▪︎ A giant whale transferred $4 billion BTC → ETH
A major player transferred billions of dollars from Bitcoin to Ethereum, strengthening ETH's market position.
▪︎ Bitcoin remains at around $108,000
The market is awaiting the latest decision from the Federal Reserve. Historically, September has been a weak month for BTC.
▪︎ On-chain data demonstrates confidence
The realized market value of Bit
View Original▪︎ $WLFI listed on mainstream exchanges
The Trump family's token is now live on Binance, OKX, and Bybit, transitioning from a governance tool to the mass market.
▪︎ A giant whale transferred $4 billion BTC → ETH
A major player transferred billions of dollars from Bitcoin to Ethereum, strengthening ETH's market position.
▪︎ Bitcoin remains at around $108,000
The market is awaiting the latest decision from the Federal Reserve. Historically, September has been a weak month for BTC.
▪︎ On-chain data demonstrates confidence
The realized market value of Bit
- Reward
- like
- Comment
- Repost
- Share
🚨 Top Crypto News – September 1, 2025
▪︎ $WLFI hits major exchanges
The Trump family’s token is now listed on Binance, OKX, and Bybit. From governance to the mainstream market.
▪︎ Whale moves $4B from BTC → ETH
A major holder shifts billions, boosting Ethereum’s momentum.
▪︎ Bitcoin around $108,000
Markets await the Fed’s decision. Historically, September has been a tough month for BTC.
▪︎ On-chain strength
Bitcoin’s realized cap hits $1.05T — long-term holders remain confident.
▪︎ Market in the red
93 of the top 100 coins are down. The only gainer today: BNB (+0.5%).
▪︎ September outlook: ra
- Reward
- like
- Comment
- Repost
- Share
🚨 Major crypto events September 1, 2025
▪︎ $WLFI is launching on top exchanges
The Trump family token is now traded on Binance, OKX, and Bybit. From a governance tool, it is turning into a mass asset.
▪︎ The whale moves the market
More than $4 billion has been moved from BTC to ETH. Ethereum receives a strong signal of strength.
▪︎ Bitcoin is holding at $108,000
Investors are waiting for decisions from the Fed. Let’s remember: September is traditionally a difficult month for BTC.
▪︎ On-chain support
The realized market capitalization of Bitcoin has reached $1.05 trillion — long-term holders a
View Original▪︎ $WLFI is launching on top exchanges
The Trump family token is now traded on Binance, OKX, and Bybit. From a governance tool, it is turning into a mass asset.
▪︎ The whale moves the market
More than $4 billion has been moved from BTC to ETH. Ethereum receives a strong signal of strength.
▪︎ Bitcoin is holding at $108,000
Investors are waiting for decisions from the Fed. Let’s remember: September is traditionally a difficult month for BTC.
▪︎ On-chain support
The realized market capitalization of Bitcoin has reached $1.05 trillion — long-term holders a
- Reward
- like
- Comment
- Repost
- Share
🚨 Analysis of the WLFI project (World Liberty Financial)
‼️Don't buy yet‼️
▪︎ What is this?
WLFI is a new DeFi/fintech project with the WLFI token, claimed to be a governance token. The goal is to connect traditional finance and crypto.
▪︎ Tokenomics:
Total supply: ~100 billion WLFI
▪︎ Usage: voting, staking, fees
▪︎ Large shares for early investors and initiators → ⚠️ risk of price pressure upon unlock
▪︎ Who is behind the project?
Associated with the Trump family, which attracted the attention of the media and regulators. The project is structured as a corporation in Delaware.
▪︎ Trading
View Original‼️Don't buy yet‼️
▪︎ What is this?
WLFI is a new DeFi/fintech project with the WLFI token, claimed to be a governance token. The goal is to connect traditional finance and crypto.
▪︎ Tokenomics:
Total supply: ~100 billion WLFI
▪︎ Usage: voting, staking, fees
▪︎ Large shares for early investors and initiators → ⚠️ risk of price pressure upon unlock
▪︎ Who is behind the project?
Associated with the Trump family, which attracted the attention of the media and regulators. The project is structured as a corporation in Delaware.
▪︎ Trading

- Reward
- like
- 2
- Repost
- Share
Latitude:
Is this Trump World Liberty Finance convertible to stable coin such as USDT? YES OR NOView More
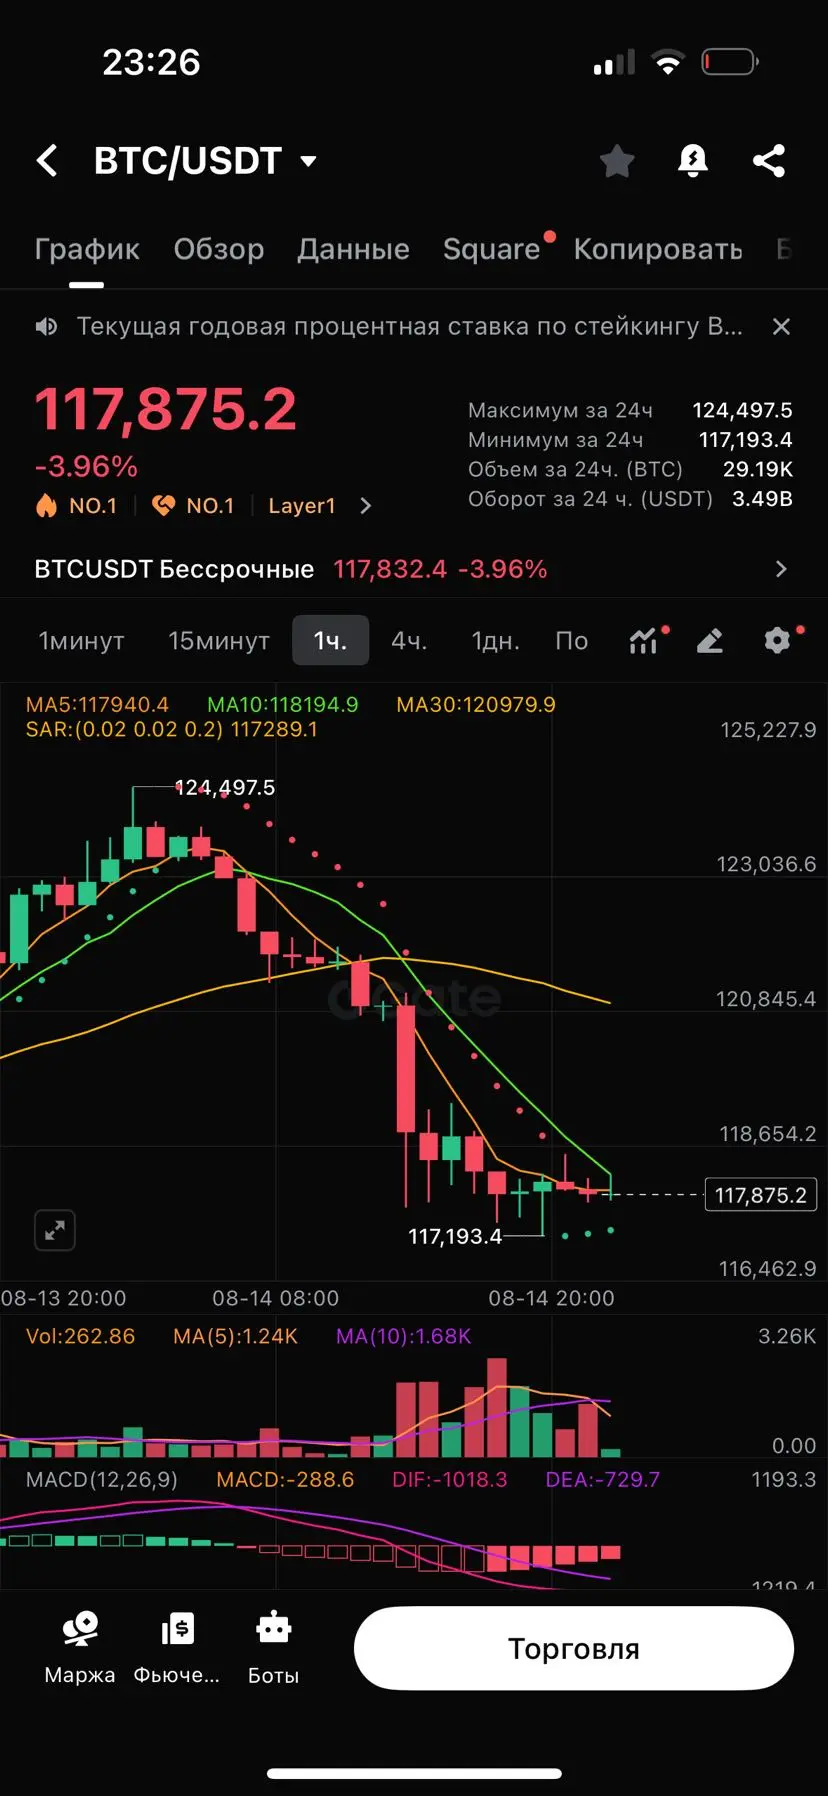
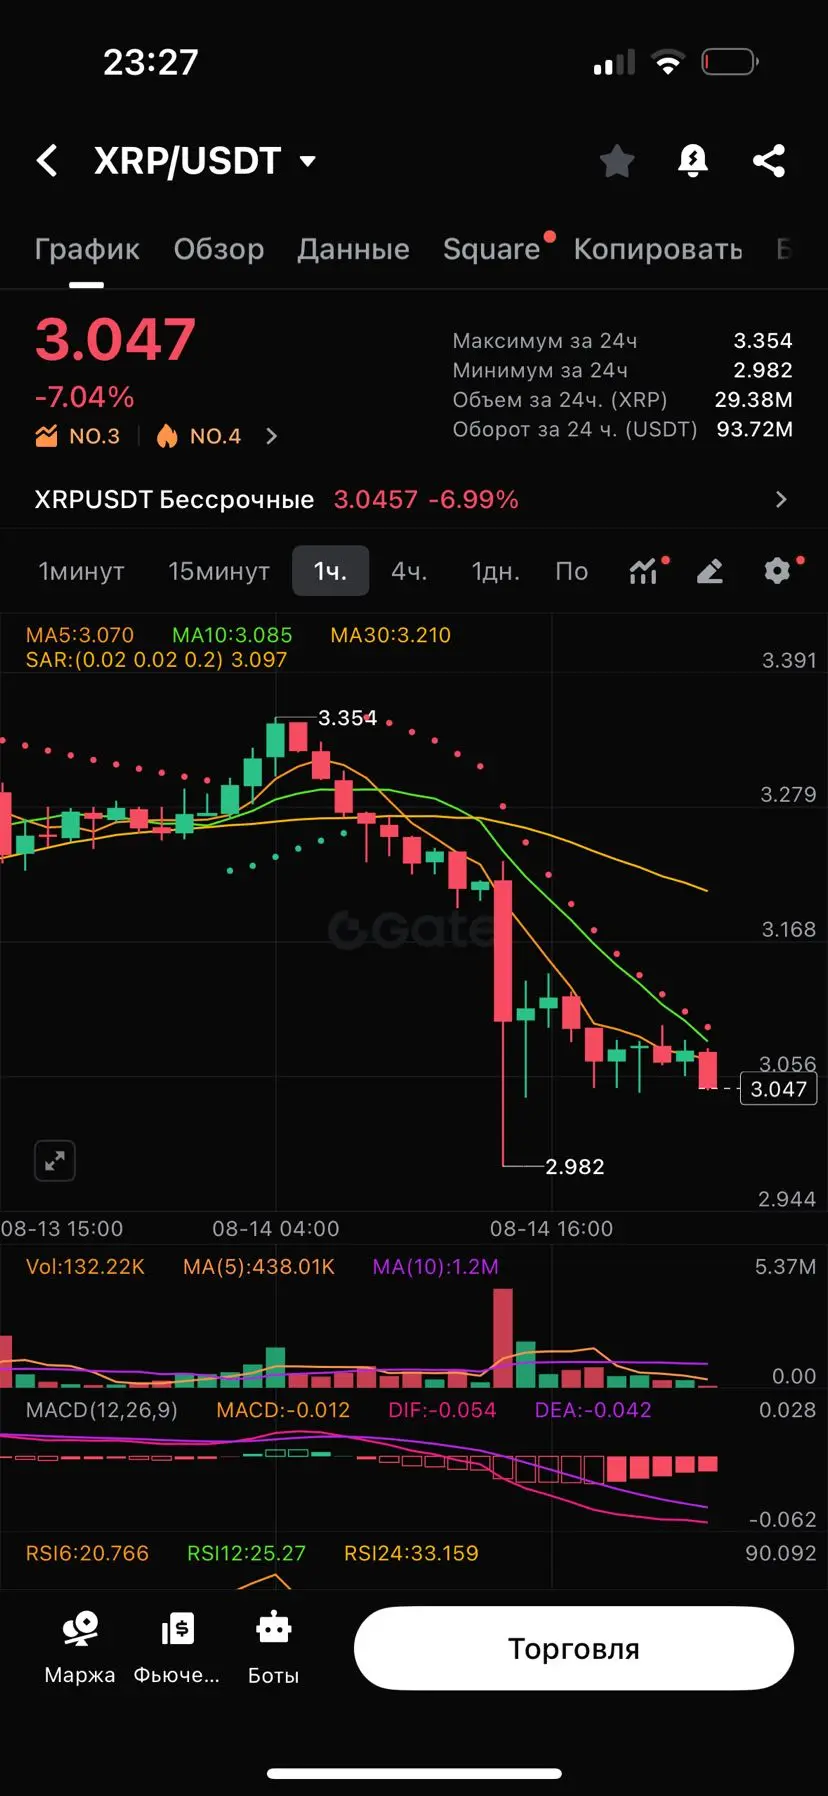
BTC/USDT
Current price: 117 875
The chart shows a strong downward movement, a break below all short-term moving averages, MACD in deep negative territory, RSI in the oversold zone, but without signs of reversal. A short-term correction upwards is possible, but the trend remains down for now. The probable range for today: 116,800 – 119,500.
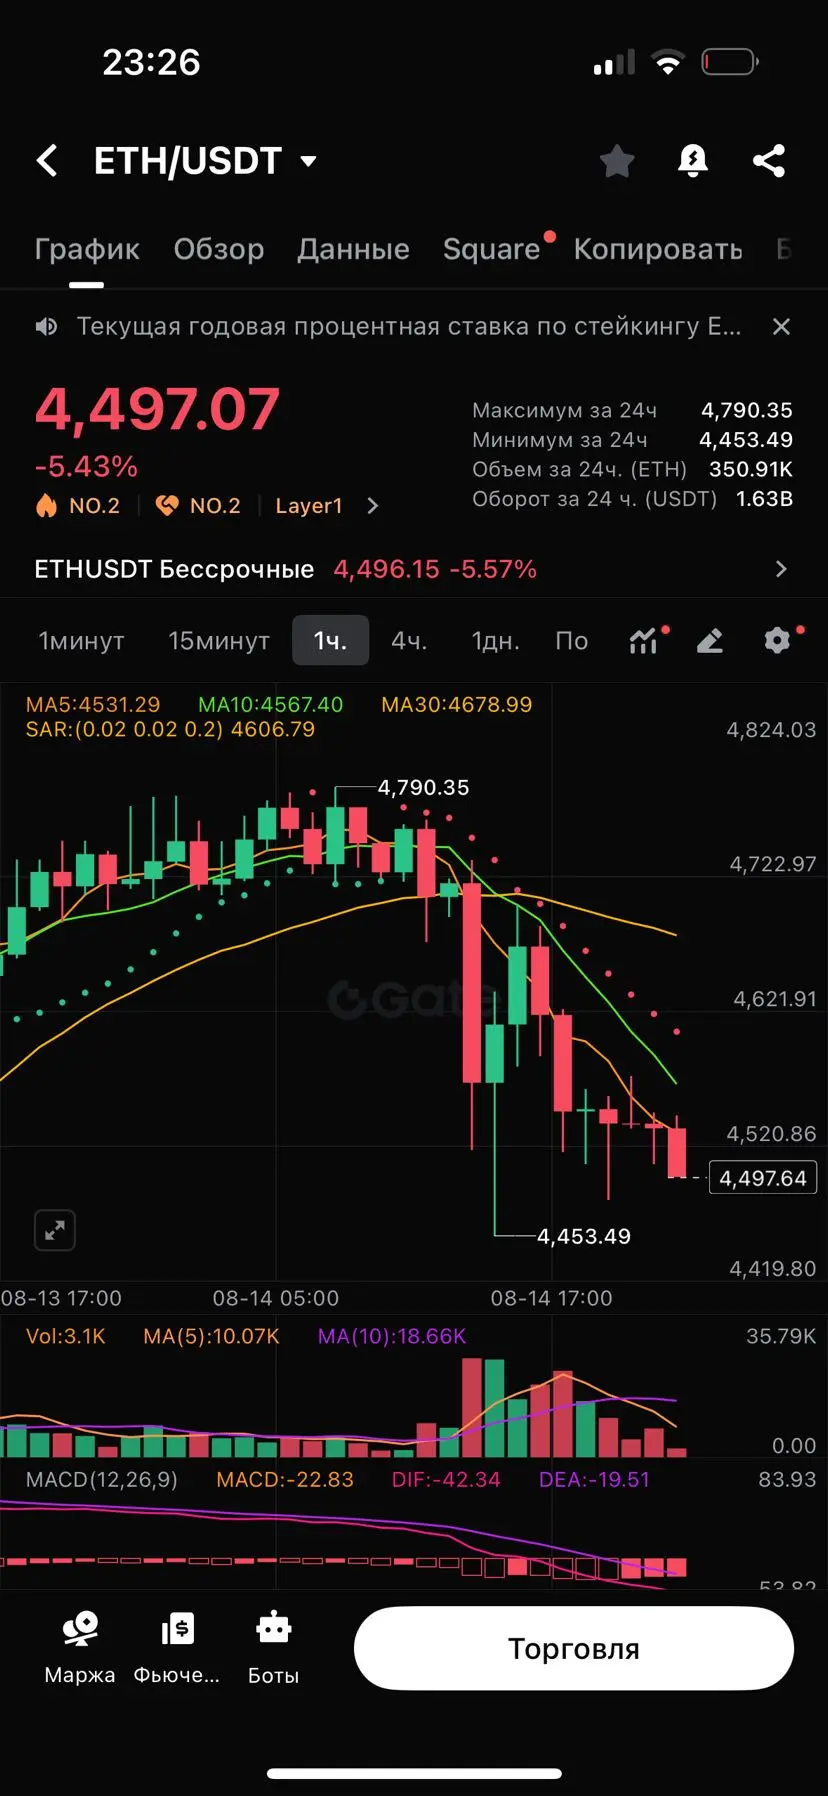
ETH/USDT
Current price: 4 497
The situation is similar to Bitcoin: the trend is descending, breaking MA5, MA10, and MA30 downwards, MACD indicates strong selling pressure. RSI is close to oversold — a small rebound is possible, but the overall direction is d
View OriginalCurrent price: 117 875
The chart shows a strong downward movement, a break below all short-term moving averages, MACD in deep negative territory, RSI in the oversold zone, but without signs of reversal. A short-term correction upwards is possible, but the trend remains down for now. The probable range for today: 116,800 – 119,500.
ETH/USDT
Current price: 4 497
The situation is similar to Bitcoin: the trend is descending, breaking MA5, MA10, and MA30 downwards, MACD indicates strong selling pressure. RSI is close to oversold — a small rebound is possible, but the overall direction is d
- Reward
- 1
- Comment
- Repost
- Share
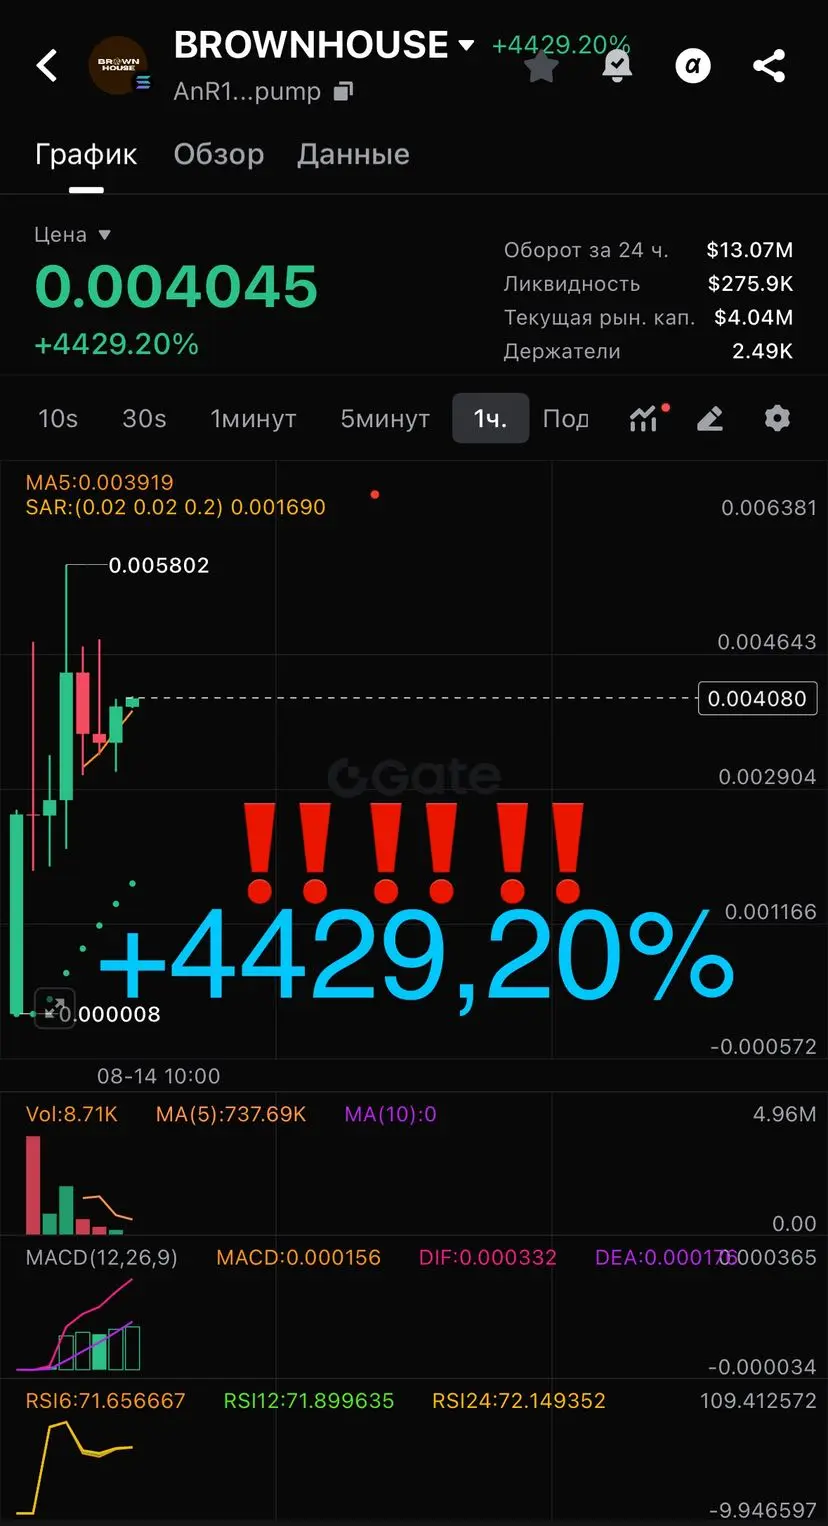
The situation with BROWNHOUSE/USDT is currently highly speculative — a rise of +4429% in a day indicates a pump, which means a high probability of a sharp pullback. The 1-hour chart shows that the price has already peaked at 0.005802 and has started to form a pullback, but it is still holding above MA5 (0.003919), and the RSI is around 72 — that is, in the overbought zone.
💥 My plan for today (scalping):
📊 Long — only on pullback!
• Entry: 0.00380–0.00400 (waiting for MA50 retest)
• Leverage: x5 (not higher, maximum risk)
• Stop: 0.00350 ( below this level may go into a dump )
• Take pro
View Original💥 My plan for today (scalping):
📊 Long — only on pullback!
• Entry: 0.00380–0.00400 (waiting for MA50 retest)
• Leverage: x5 (not higher, maximum risk)
• Stop: 0.00350 ( below this level may go into a dump )
• Take pro
- Reward
- like
- Comment
- Repost
- Share
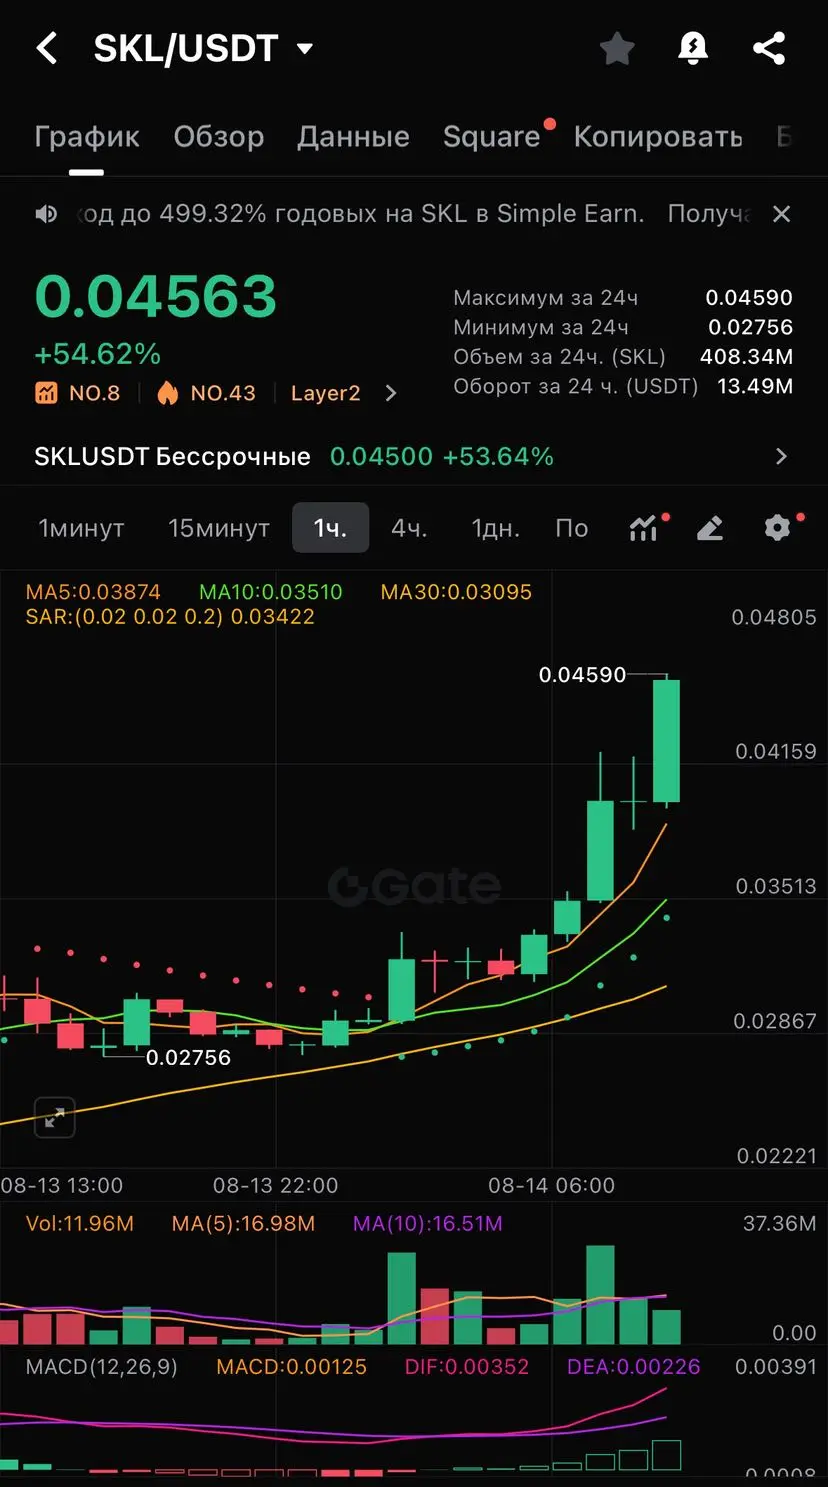
On the SKL/USDT 1-hour chart, there is currently a strong bullish momentum, the price has broken through MA5, MA10, and MA30, volumes are significantly increasing, MACD and RSI confirm the bullish trend, but RSI is already close to the overbought zone. It is possible to work in long, but with a careful stop, as a correction may occur after a sharp pump.
⸻
💎 Signal for SKL/USDT
📊 Long
🎯 Entry: 0.04550–0.04500 (better to wait for a slight correction)
📈 Leverage: x5–x10
🛡 Stop: 0.04390
💰 Take Profit:
• TP1: 0.04650
• TP2: 0.04780
• TP3: 0.04920
⚠️ Risk: high ( rise already +54%, a pullba
⸻
💎 Signal for SKL/USDT
📊 Long
🎯 Entry: 0.04550–0.04500 (better to wait for a slight correction)
📈 Leverage: x5–x10
🛡 Stop: 0.04390
💰 Take Profit:
• TP1: 0.04650
• TP2: 0.04780
• TP3: 0.04920
⚠️ Risk: high ( rise already +54%, a pullba
SKL-1,1%
- Reward
- like
- Comment
- Repost
- Share
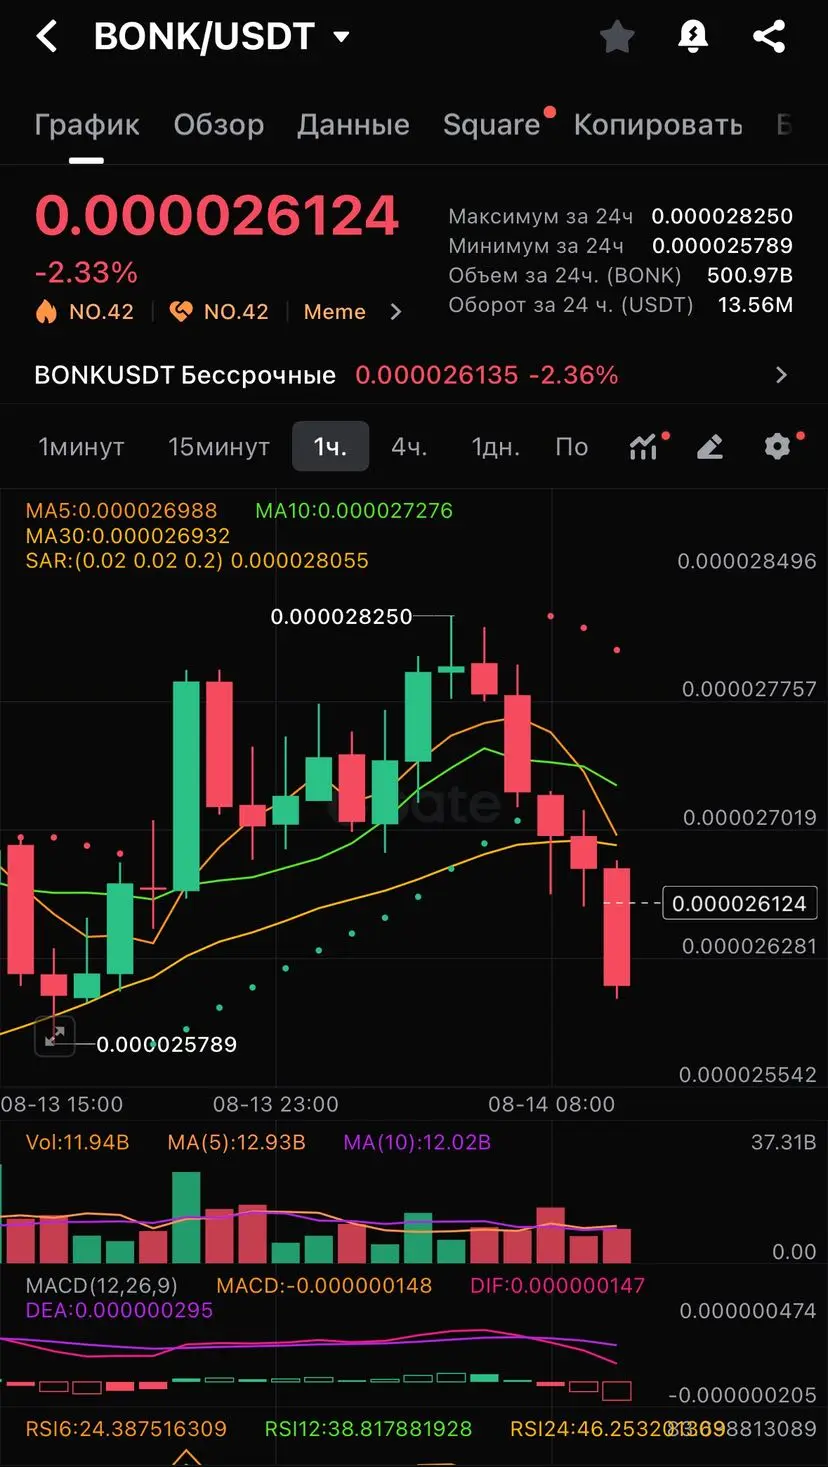
💎 Signal for BONK/USDT
📊 Short
🎯 Entry: 0.00002620–0.00002630
📈 Leverage: x5–x10
🛡 Stop: 0.00002705
💰 Take Profit:
• TP1: 0.00002555
• TP2: 0.00002500
• TP3: 0.00002440
⚠️ Risk: medium ( may be a bounce from the support zone 0.00002550)
⏳ Timeframe: 1h
📊 Short
🎯 Entry: 0.00002620–0.00002630
📈 Leverage: x5–x10
🛡 Stop: 0.00002705
💰 Take Profit:
• TP1: 0.00002555
• TP2: 0.00002500
• TP3: 0.00002440
⚠️ Risk: medium ( may be a bounce from the support zone 0.00002550)
⏳ Timeframe: 1h
BONK-0,23%
- Reward
- 1
- 1
- Repost
- Share
OptimusGG :
:
GOBUY!👌👌👌💎 Signal for OKB/USDT
📊 Long ( only from support )
🎯 Entry: $101.50–103.00
📈 Leverage: x3–x5 ( due to high volatility)
🛡 Stop: $96.80
💰 Take Profit:
• TP1: $110.00
• TP2: $118.00
• TP3: $126.00
⚠️ Risk: high ( after the pump, a deep correction is possible )
⏳ Timeframe: 1h / 4h
📊 Long ( only from support )
🎯 Entry: $101.50–103.00
📈 Leverage: x3–x5 ( due to high volatility)
🛡 Stop: $96.80
💰 Take Profit:
• TP1: $110.00
• TP2: $118.00
• TP3: $126.00
⚠️ Risk: high ( after the pump, a deep correction is possible )
⏳ Timeframe: 1h / 4h
OKB0,41%
- Reward
- like
- Comment
- Repost
- Share
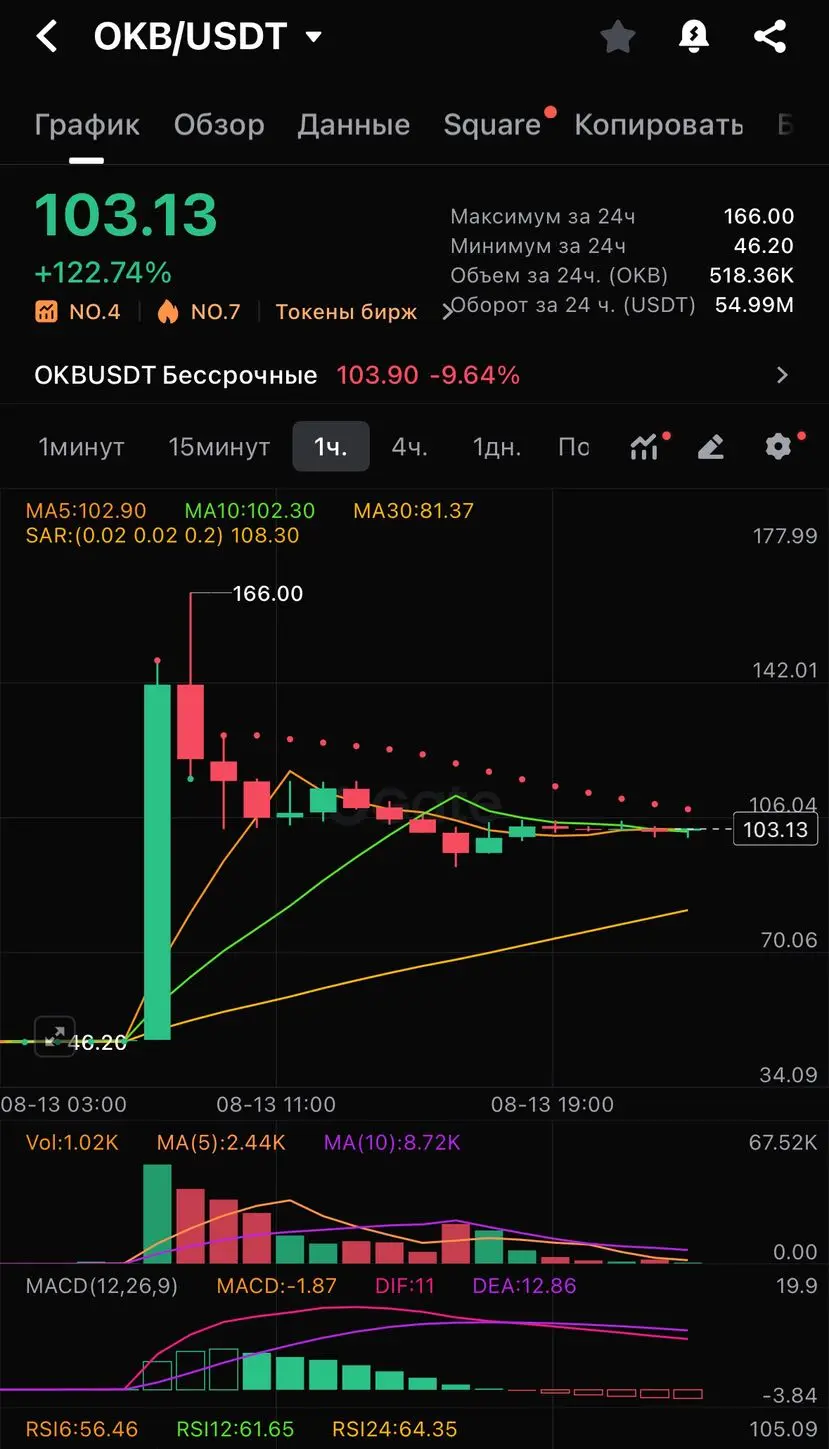
For OKB/USDT, after a wild pump of (+122% in a day, it has now entered a phase of correction and consolidation.
The signal will be cautious because the volatility is simply astronomical 🚀.
⸻
💎 Signal for OKB/USDT
📊 Long ) only from support (
🎯 Entry: $101.50–103.00
📈 Leverage: x3–x5 ) due to high volatility(
🛡 Stop: $96.80
💰 Take Profit:
• TP1: $110.00
• TP2: $118.00
• TP3: $126.00
⚠️ Risk: high ) after the pump, a deep correction is possible (
⏳ Timeframe: 1h / 4h
OKB0,41%

- Reward
- like
- 1
- Repost
- Share
JustInTime:
Hurry up and enter a position!🚗🚨🚨🚨IT'S HAPPENING🚨🚨🚨
📊 ARB/USDT Forecast
🎯 Entry Point (LONG)
• Entry is possible during the retest of the zone $0.5400–$0.5500 with confirmation by volume.
• Alternative — entry at the current price with partial take profit at the first take.
🛡 Stop-Loss
• $0.5150 — slightly below the breakout zone to protect against a false pullback.
💰 Take-Profit
• TP1: $0.5950 — the nearest resistance.
• TP2: $0.6300 — if the momentum is maintained.
• TP3: $0.6700 — psychological level and maximum of the last weeks.
⚠ Note
• The RSI on the 1D is already in the overbought zone (81), a short
ARB-1,44%
- Reward
- like
- Comment
- Repost
- Share
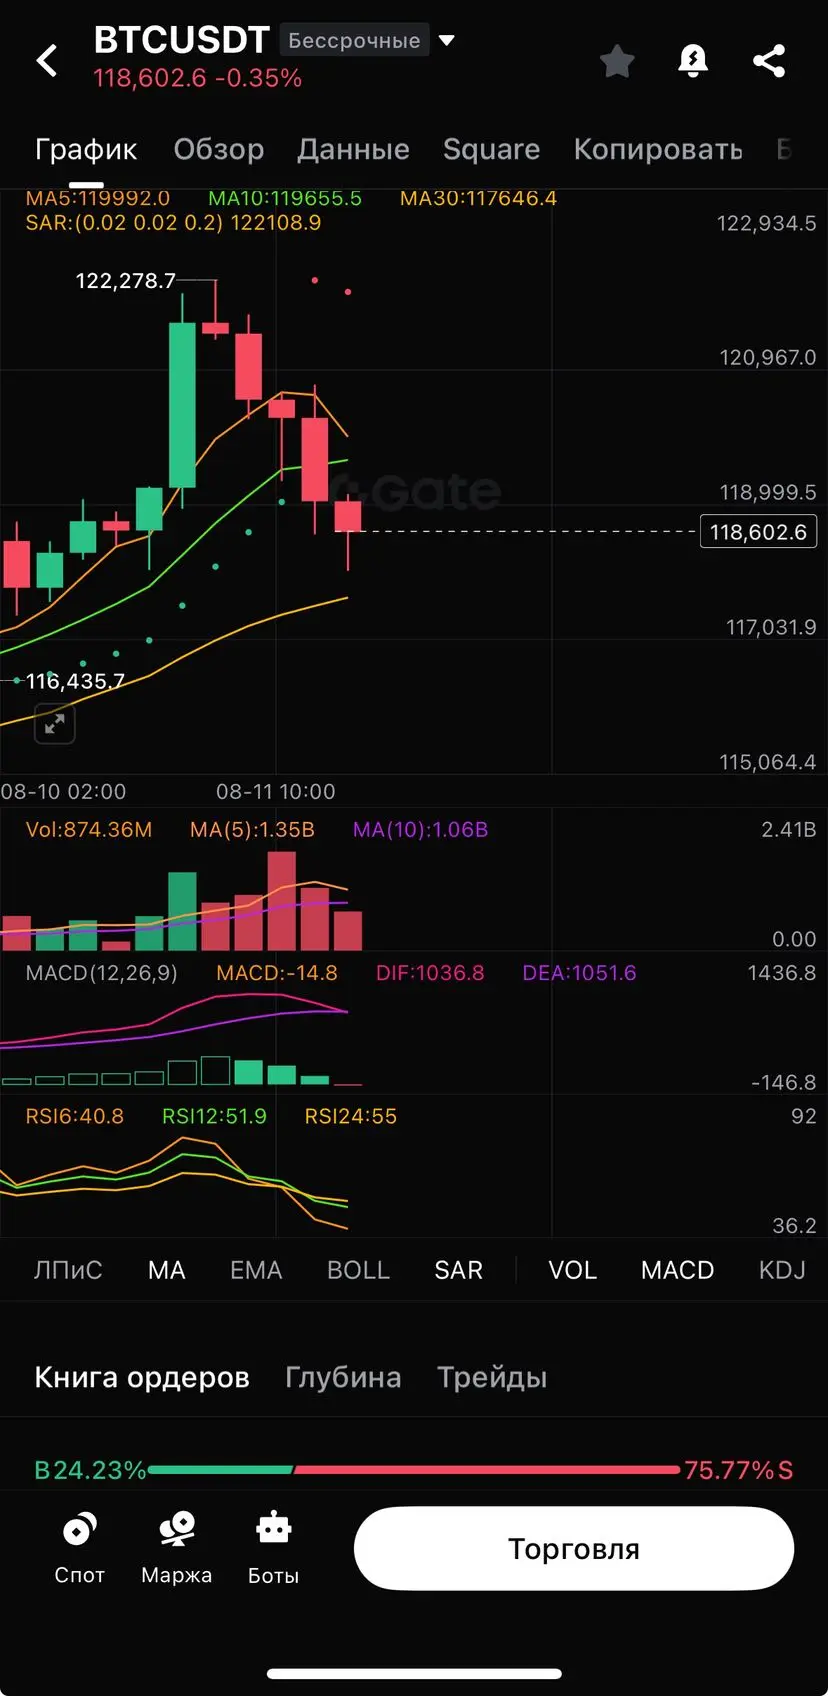
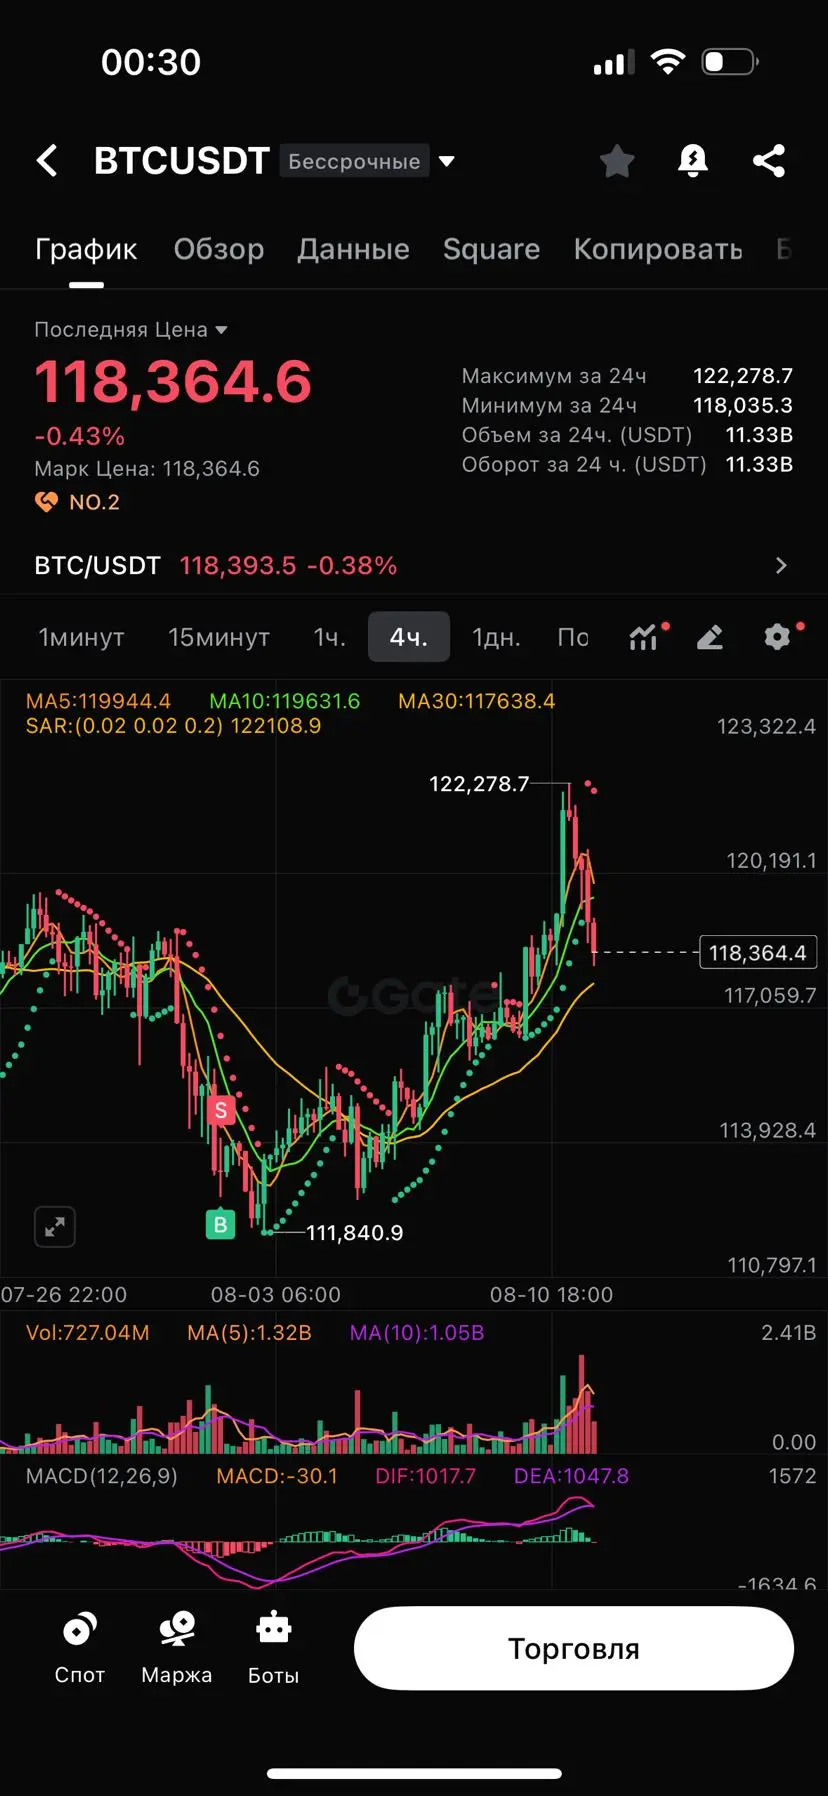
#BTC Let's break down this BTC/USDT chart step by step so that even a newbie can understand what's going on here.
⸻
📊 Analysis of the BTC/USDT chart for newbies
1️⃣ Timeframe
Judging by the appearance of the candles and their density, a 4-hour chart is selected here (each candle represents 4 hours of price movement).
⸻
2️⃣ Price and Change
• Current price: 118,602.6 USDT
• Change per candle: –0.35%
The price has dropped from the local maximum of 122,278.7 and has settled below the moving averages MA5 and MA10.
⸻
3️⃣ Moving Averages (MA)
• MA5 (orange): 119,992 — shows the average price for
View Original⸻
📊 Analysis of the BTC/USDT chart for newbies
1️⃣ Timeframe
Judging by the appearance of the candles and their density, a 4-hour chart is selected here (each candle represents 4 hours of price movement).
⸻
2️⃣ Price and Change
• Current price: 118,602.6 USDT
• Change per candle: –0.35%
The price has dropped from the local maximum of 122,278.7 and has settled below the moving averages MA5 and MA10.
⸻
3️⃣ Moving Averages (MA)
• MA5 (orange): 119,992 — shows the average price for
- Reward
- like
- Comment
- Repost
- Share
#Bitcoin BTC #CryptoTrading Whales #MarketMove BullRun #BTCPrice CryptoNews #Gateio USDT
⸻
Post (EN):
🚨🚨🚨🚨 Bitcoin Whales on the Move!🚨🚨🚨🚨🚨🚨🚨🐳🐋🐳🐋🐳🐋🐳🐋🐳
Market trackers have spotted unusual whale activity — over $100B in BTC potentially set to hit the market today.
Large inflows into top-tier exchanges signal that major players are preparing for an aggressive move. Whether it’s a rapid push above key resistance at $120K or a strategic shakeout, volatility is almost guaranteed.
Stay alert — this could be the most explosive BTC session of the month.

- Reward
- 2
- 1
- Repost
- Share
ContractHundredTimesK:
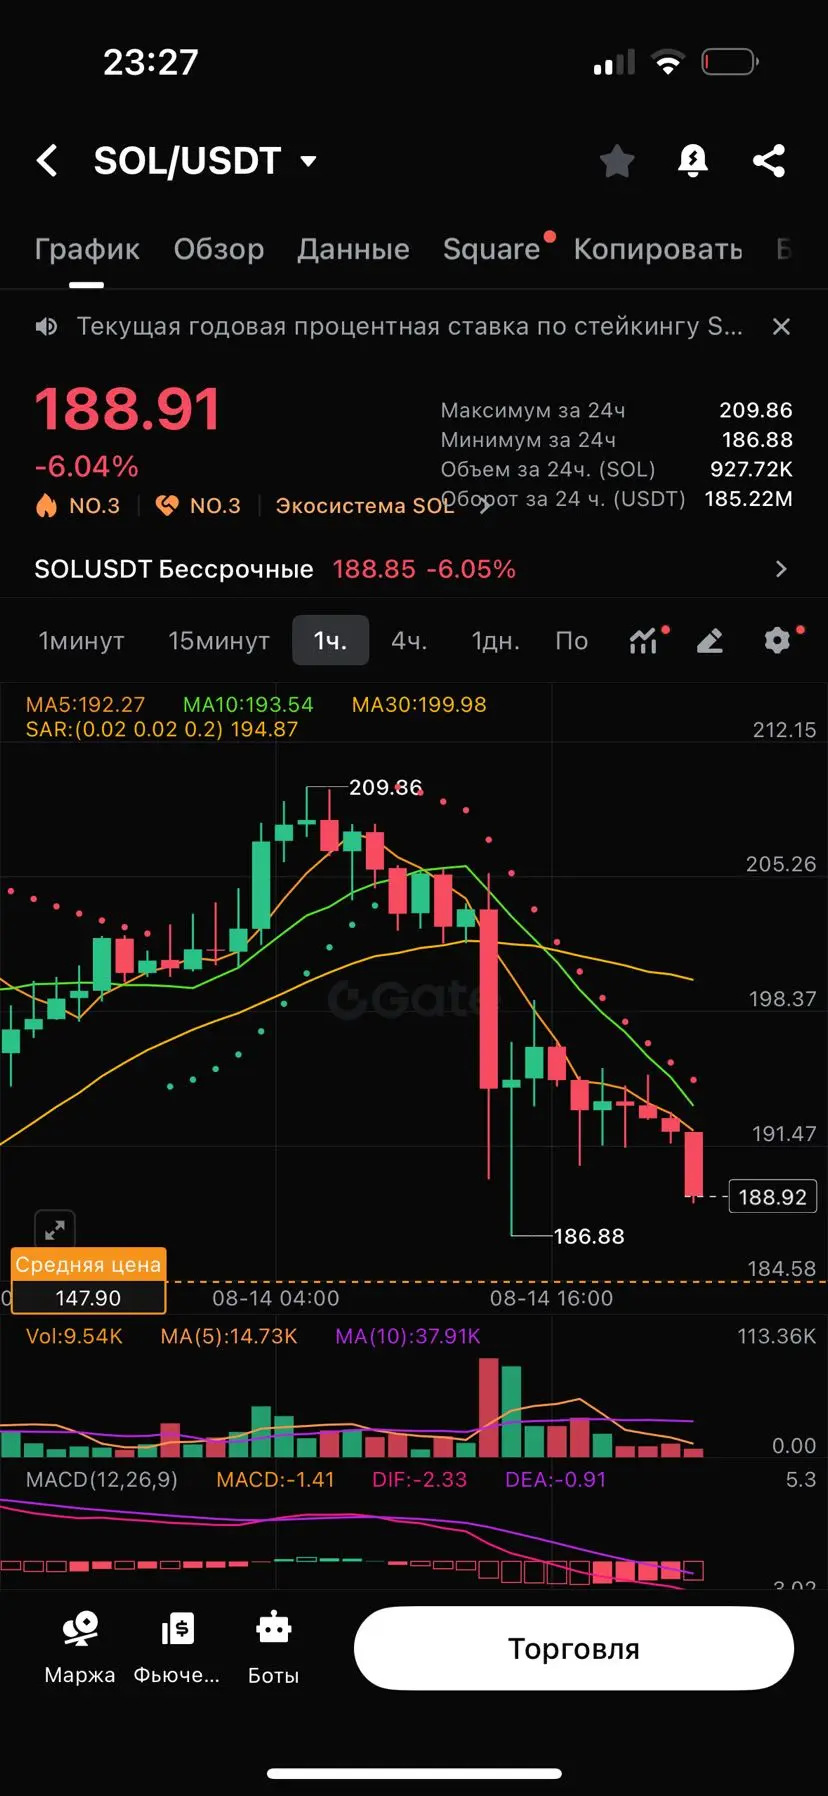
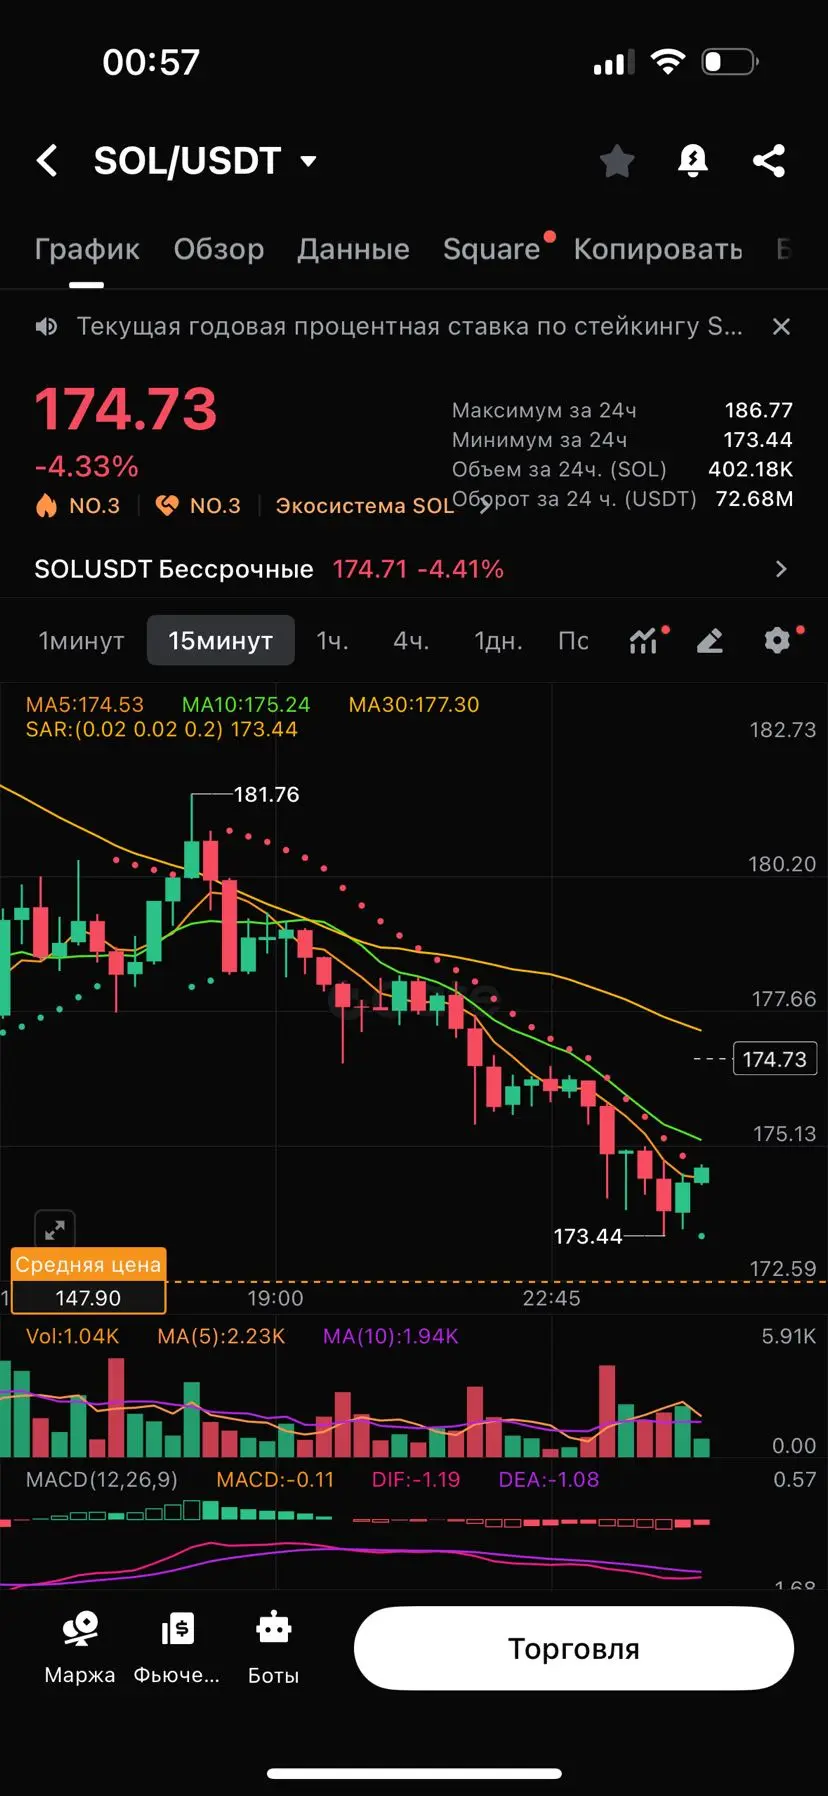
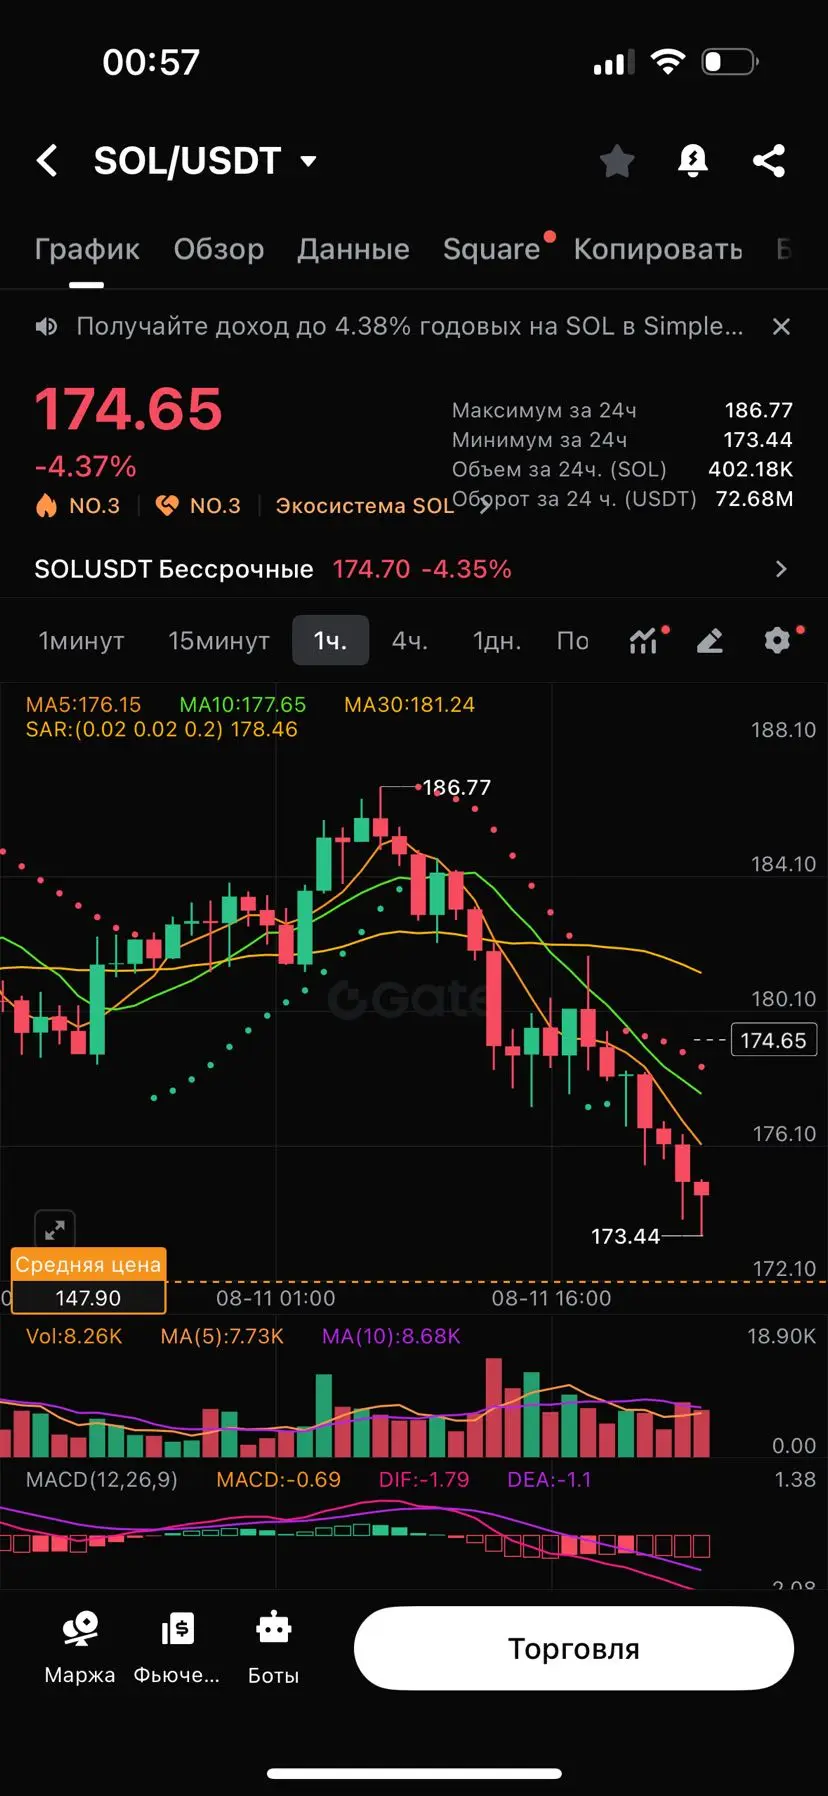
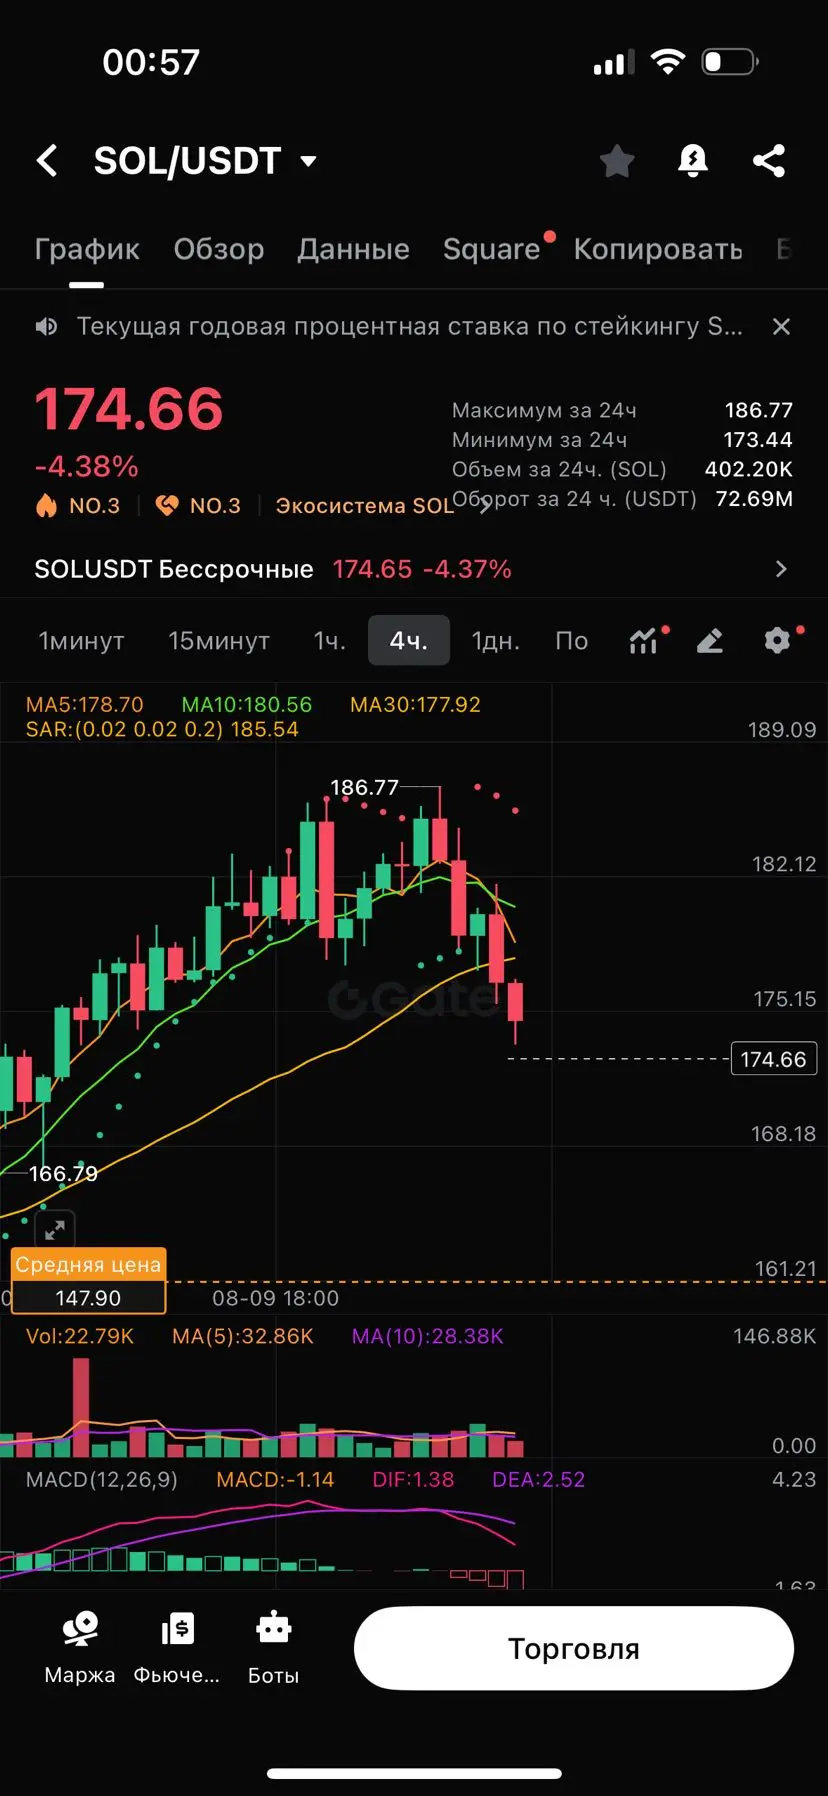
Hold on tight, we are about to To da moon 🛫SOL/USDT is trading near $174.70, down about 4.3% in the last 24h after hitting a high of $186.77.
On the 4H chart, price has broken below the short-term MA5 and MA10, with Parabolic SAR and MACD both signaling continued bearish momentum.
If price fails to reclaim $176–177 resistance, further downside towards $172 and $168 support zones is possible. A break back above $178 could signal a short-term reversal attempt.#SOL Solana #CryptoTrading Altcoin #BearishTrend MarketAnalysis #TradingSignals Gateio #USDT CryptoUpdate
- Reward
- like
- Comment
- Repost
- Share
LIORA/USDT has risen over 84% in the past 24 hours, reaching a high of 0.14438, and is currently consolidating around 0.137.
The 4-hour chart shows that after a rapid rise, the price has entered a short consolidation period, with the RSI operating at a high level (>75), and the MACD still maintaining a bullish trend.
As long as the price remains stable above 0.135, it is expected to test the resistance level of 0.144 again and challenge 0.150. If it falls below 0.130, it may pull back to the support at 0.118.
(See attached chart for key support and resistance levels) #LIORA
LIORA-1,73%

- Reward
- like
- Comment
- Repost
- Share
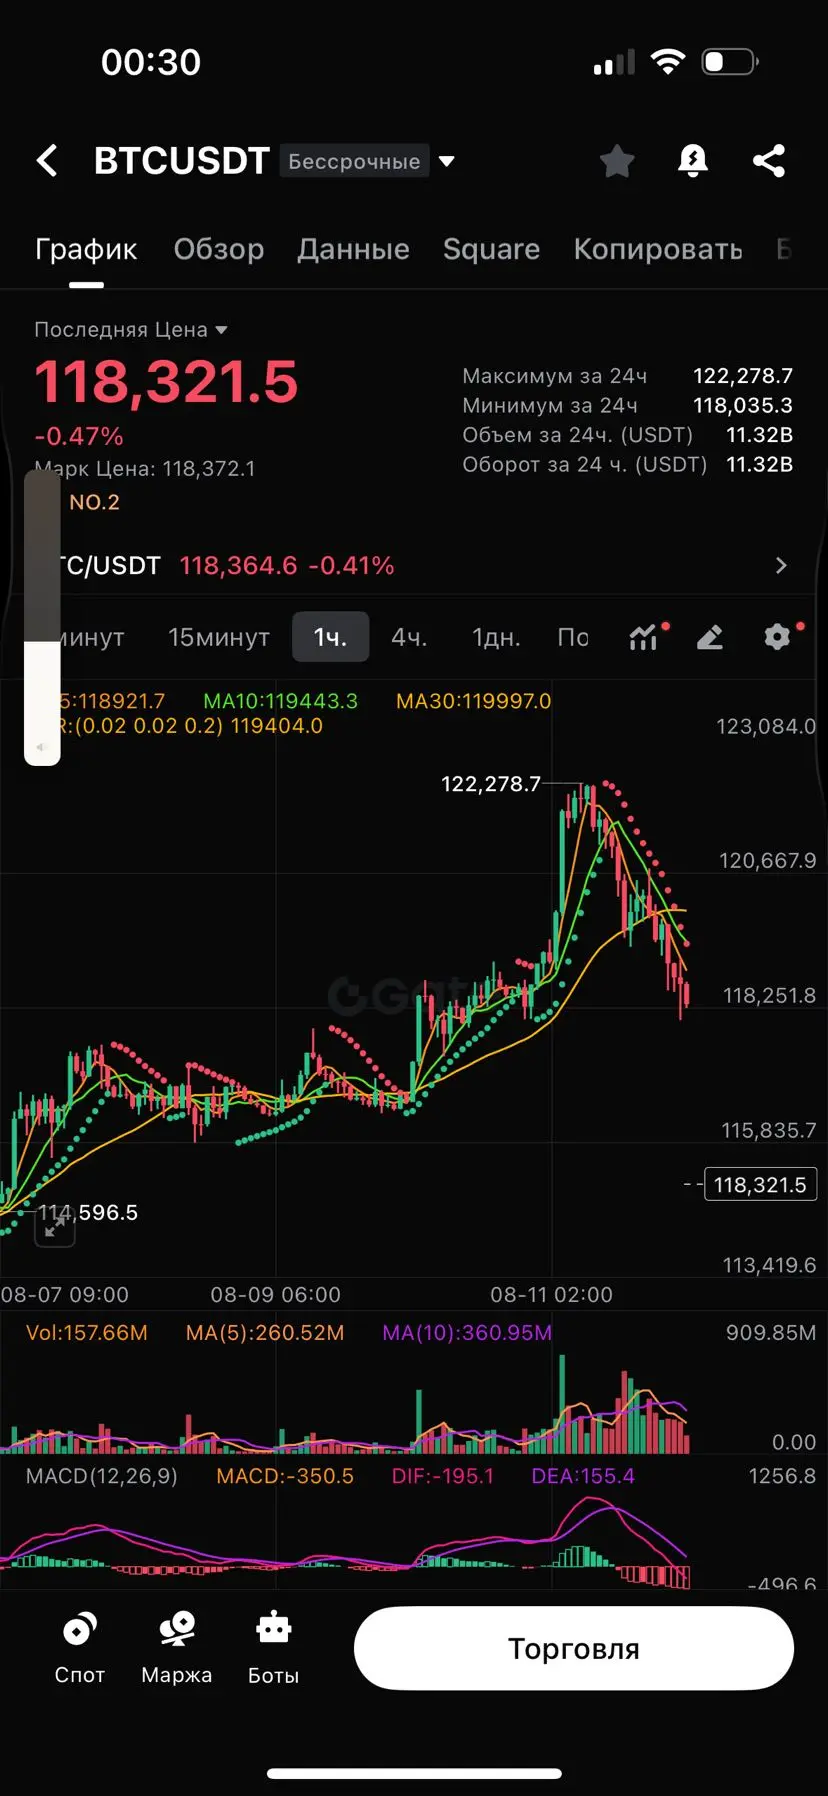
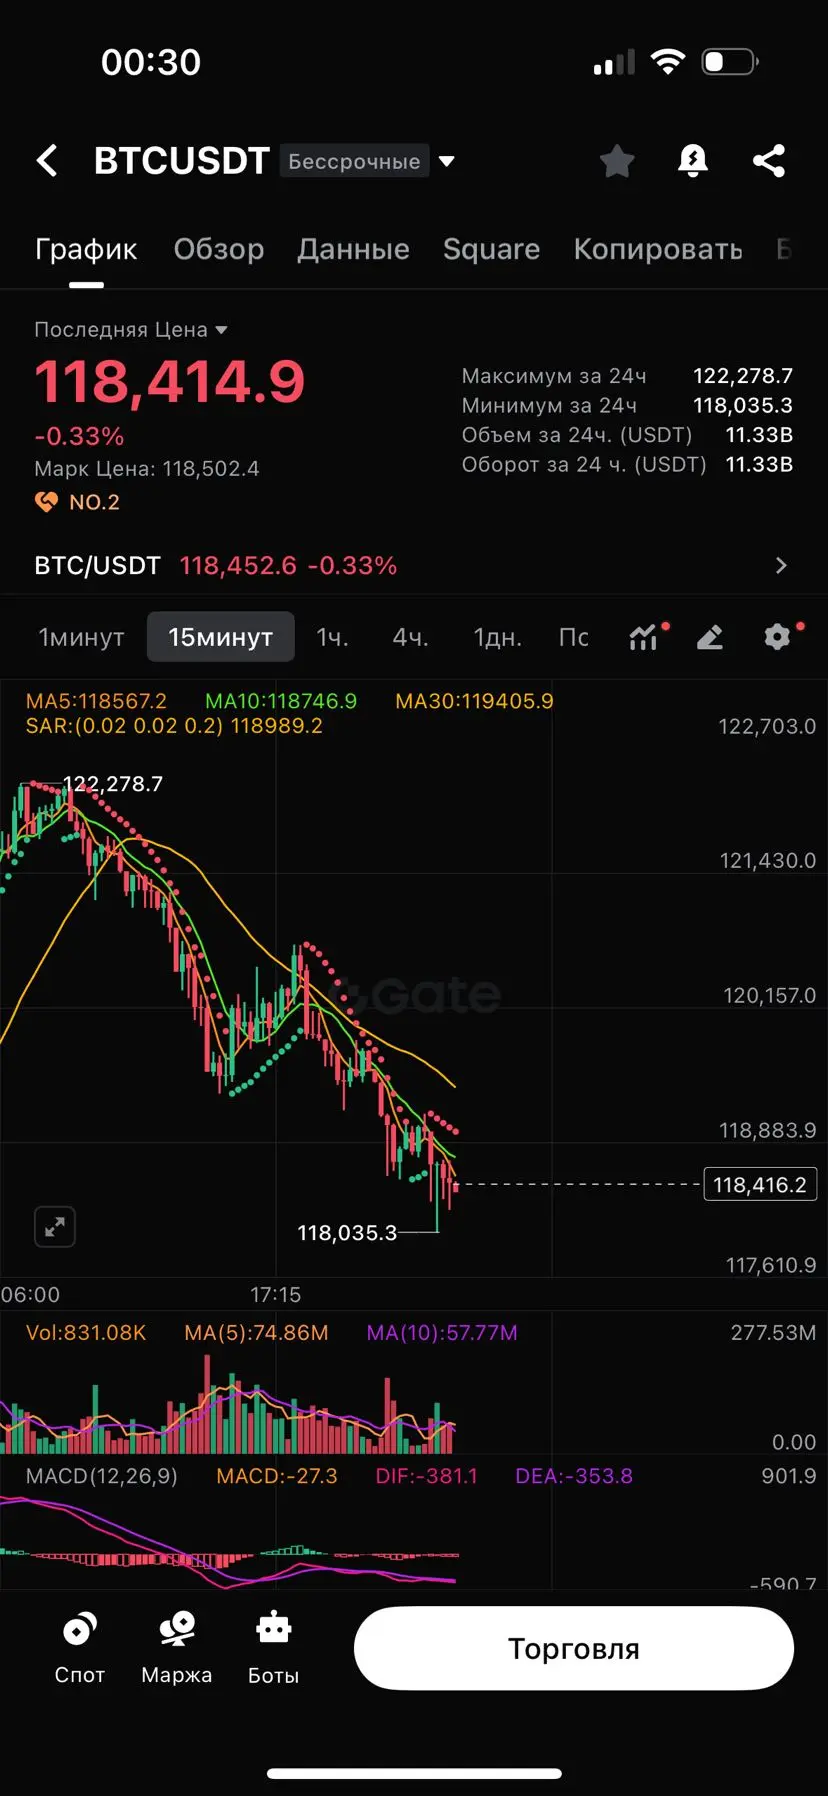
📉 BTC has settled at $118,400 — where to next?
Text:
Bitcoin is trading around $118,400, after a recent pullback from the local high of $122,278.
On the 4H chart, it can be seen that the price has approached the support zone of $118,000–118,400, where the MA30 is located and there has already been a rebound at the beginning of the month.
MACD on all timeframes shows a weakening of the bearish momentum, which may lead to consolidation before a new movement.
A consolidation above $118,600 will open the way to $120,000, while a break below $118,000 could take the price down to $116,500.
BTC-0,78%
- Reward
- like
- 2
- Repost
- Share
BullRadar:
Jump in 🚀View More
Trending Topics
View More29.28K Popularity
68.19K Popularity
13.62K Popularity
39.98K Popularity
253.42K Popularity
Pin