Trade
Basic
Futures
Futures
Hundreds of contracts settled in USDT or BTC
TradFi
Gold
Trade global traditional assets with USDT in one place
Options
Hot
Trade European-style vanilla options
Unified Account
Maximize your capital efficiency
Demo Trading
Futures Kickoff
Get prepared for your futures trading
Futures Events
Participate in events to win generous rewards
Demo Trading
Use virtual funds to experience risk-free trading
Earn
Launch
CandyDrop
Collect candies to earn airdrops
Launchpool
Quick staking, earn potential new tokens
HODLer Airdrop
Hold GT and get massive airdrops for free
Launchpad
Be early to the next big token project
Alpha Points
Trade on-chain assets and enjoy airdrop rewards!
Futures Points
Earn futures points and claim airdrop rewards
Investment
Simple Earn
Earn interests with idle tokens
Auto-Invest
Auto-invest on a regular basis
Dual Investment
Buy low and sell high to take profits from price fluctuations
Soft Staking
Earn rewards with flexible staking
Crypto Loan
0 Fees
Pledge one crypto to borrow another
Lending Center
One-stop lending hub
VIP Wealth Hub
Customized wealth management empowers your assets growth
Private Wealth Management
Customized asset management to grow your digital assets
Quant Fund
Top asset management team helps you profit without hassle
Staking
Stake cryptos to earn in PoS products
Smart Leverage
New
No forced liquidation before maturity, worry-free leveraged gains
GUSD Minting
Use USDT/USDC to mint GUSD for treasury-level yields
More
AdriGurgenidze
No content yet
AdriGurgenidze
 0
0
Gate Alpha Issue 30 Point Treasure Hunt is now live!
You only need to spend 1 point to participate in the lottery and unlock airdrop rewards for a limited time!
🪙 Points Treasure Hunt
- Participation Criteria: ≥ 100 points
- Maximum investment per round: 10 points
- Reward per round: 700 UAI
- Total rounds: 20
- The activity will automatically end once 1000 points are reached
🗓 Event Time: December 13, 15:00 – 21:00 (UTC+8)
📲 Update Gate App to v7.20+ or visit the Gate Alpha web to access the point system and participate!
https://www.gate.com/announcements/article/48688$BTC #PostonSquaret
BTC-0,36%


MC:$3.55KHolders:3
0.00%
- Reward
- 4
- 4
- Repost
- Share
User_any :
:
HODL Tight 💪View More
#PostonSquaretoEarn$50
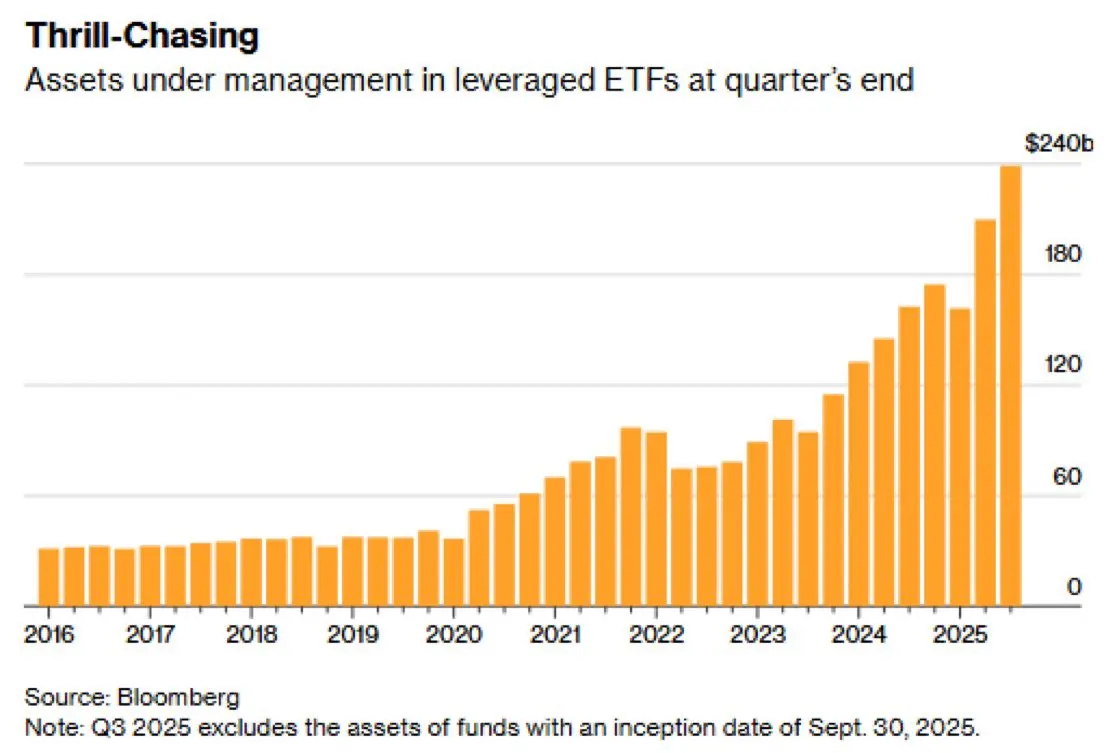
Crypto speculation at 2024 lows as TradFi leveraged ETFs hit record $239B
Crypto investor demand for memecoins remains at lows not seen since 2024, despite a growing speculative appetite that has boosted TradFi leveraged ETFs to a record $239 billion.
Traditional finance leveraged investment products are at a record high, but the appetite for speculative assets remains muted in the cryptocurrency market.
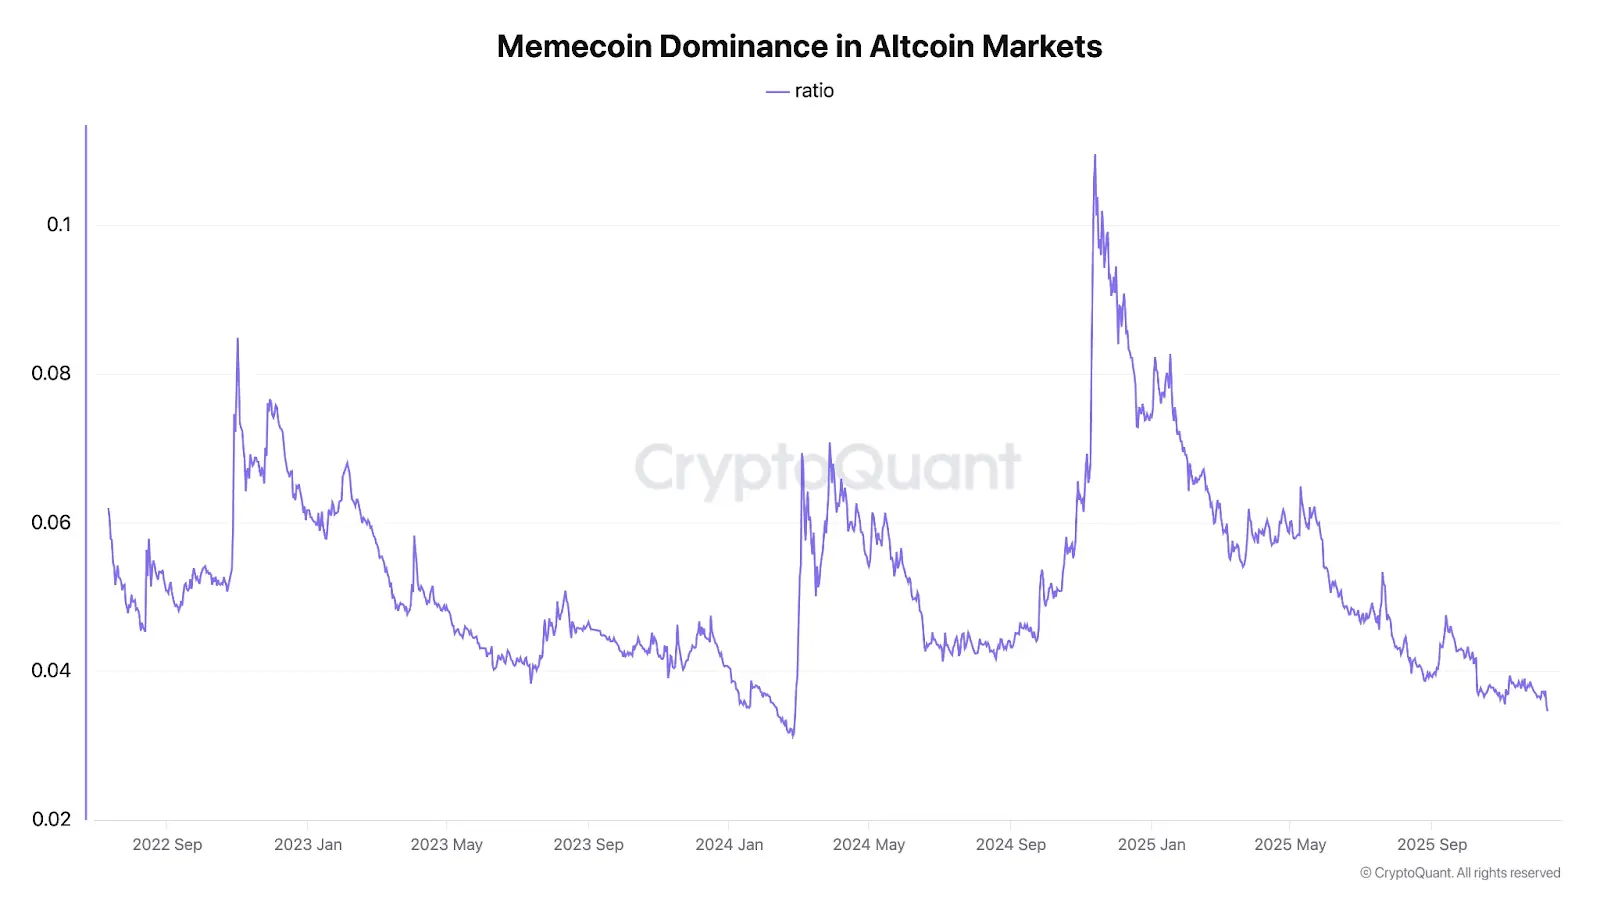
Speculative appetite is cooling among crypto investors, with memecoin dominance versus altcoins hitting a near two-year low last seen in February 2024, according to cr
Crypto speculation at 2024 lows as TradFi leveraged ETFs hit record $239B
Crypto investor demand for memecoins remains at lows not seen since 2024, despite a growing speculative appetite that has boosted TradFi leveraged ETFs to a record $239 billion.
Traditional finance leveraged investment products are at a record high, but the appetite for speculative assets remains muted in the cryptocurrency market.
Speculative appetite is cooling among crypto investors, with memecoin dominance versus altcoins hitting a near two-year low last seen in February 2024, according to cr
MC:$3.55KHolders:3
0.01%
- Reward
- 5
- 5
- Repost
- Share
EagleEye:
impressive insights and updates thanksView More
💰 #CryptoMarketRebound,
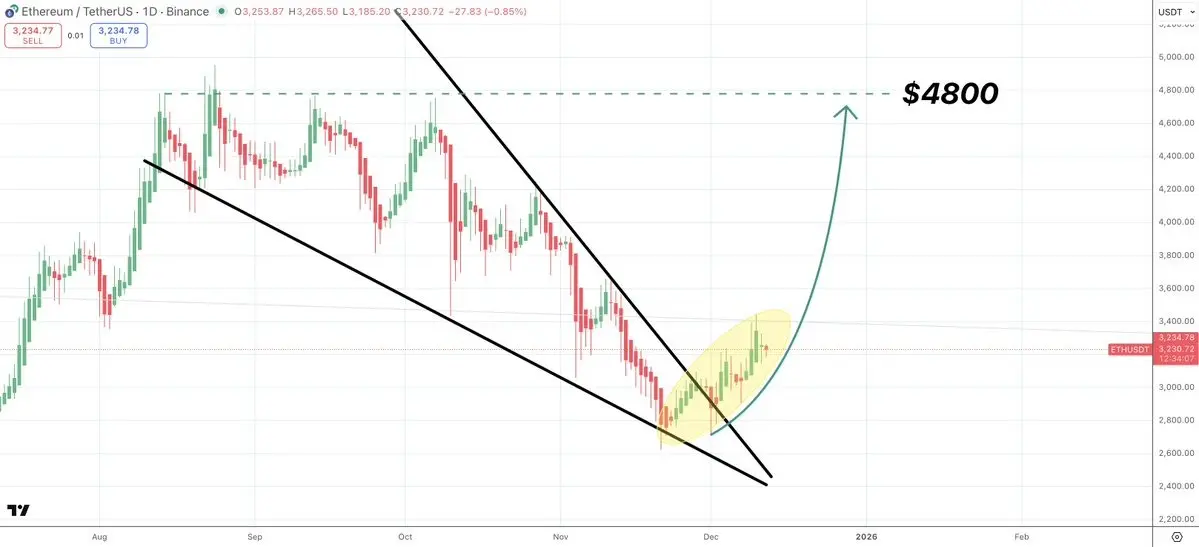
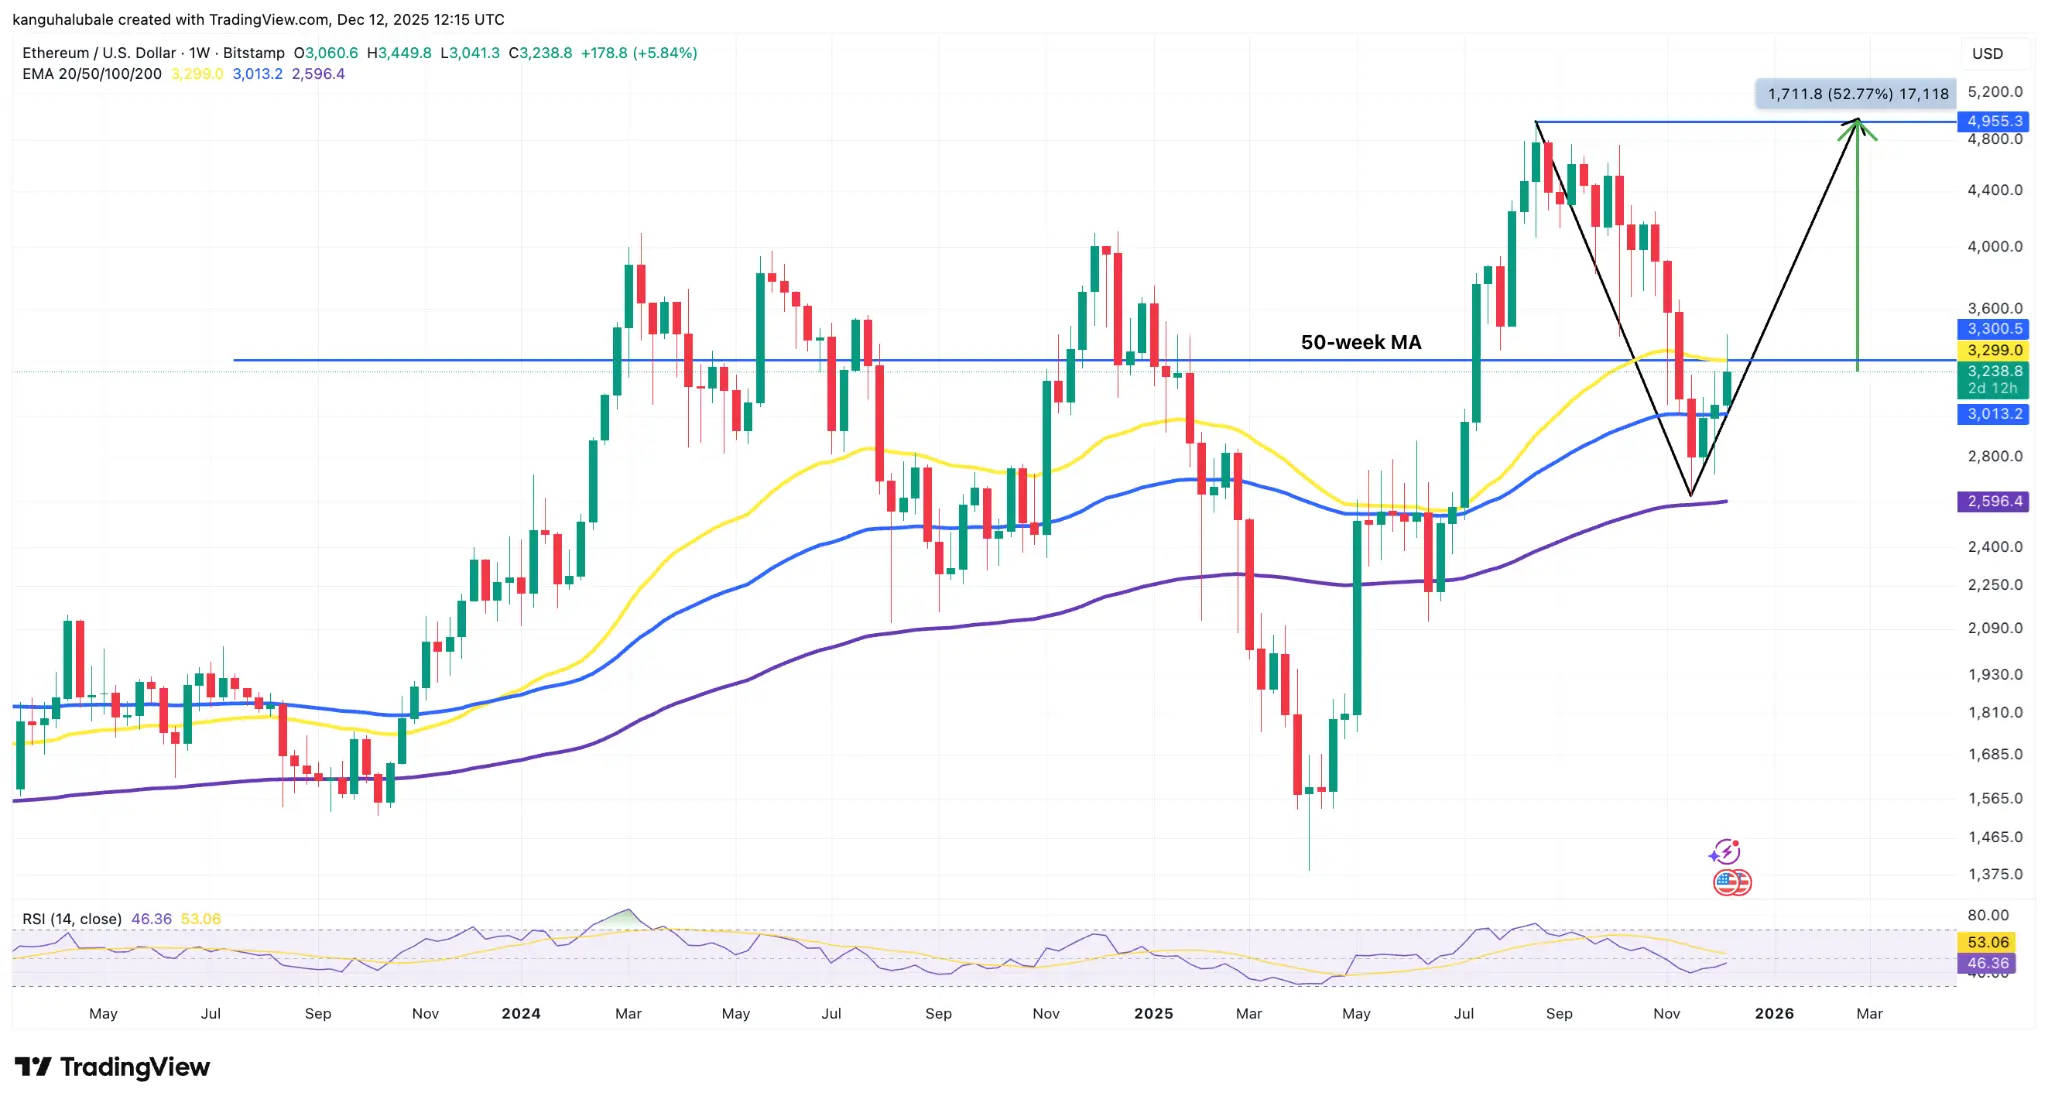
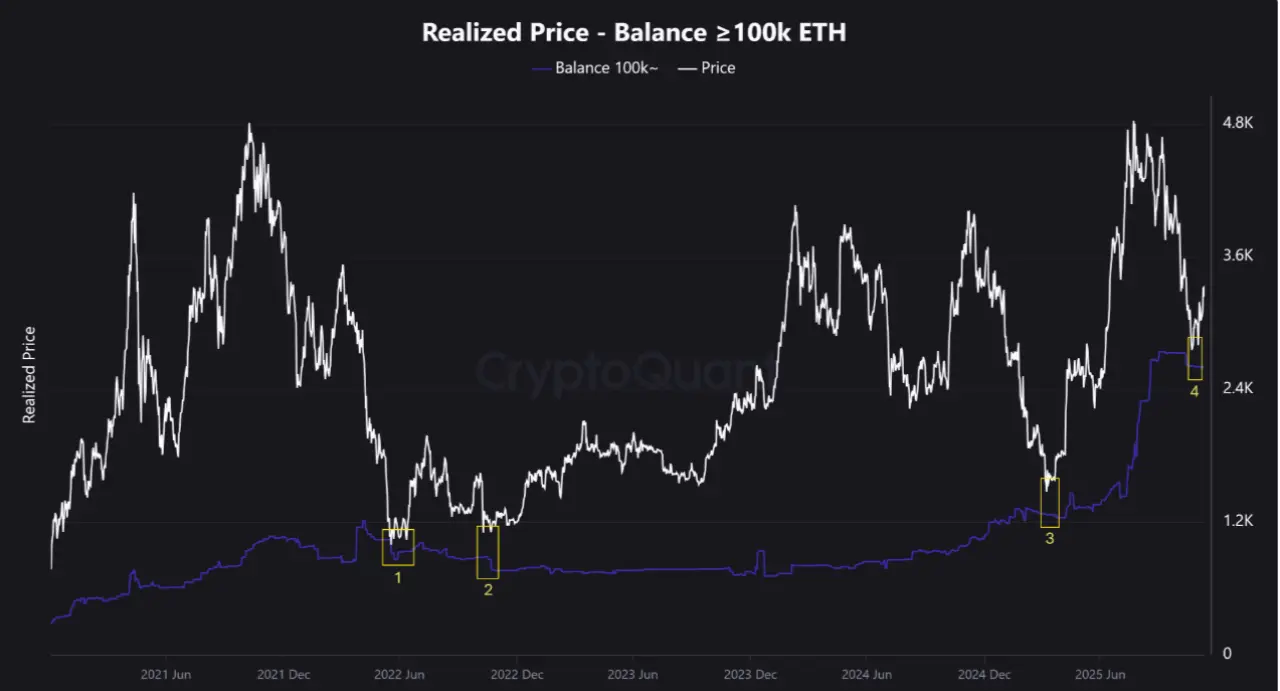
Ether price rallied 260% last time this happened: Can ETH reach $5K?
A buying opportunity from Ether’s realized price projected a major rally, as analysts said a return to $5,000 in 2026 is plausible.
Ether
ETH
$3,085
traded close to a level that has previously marked market bottoms, as classic chart patterns suggested a possible rally to $5,000.
Key takeaways:
Ether price traded closer to its realized price, historically a buying opportunity that has led to major rallies.
V-shaped recovery and falling wedge patterns emerge, targeting $5,000 ETH price.
Ether pric
MC:$3.58KHolders:3
0.04%
- Reward
- 6
- 4
- Repost
- Share
User_any:
HODL Tight 💪View More
💰 💰 #CryptoMarketRebound
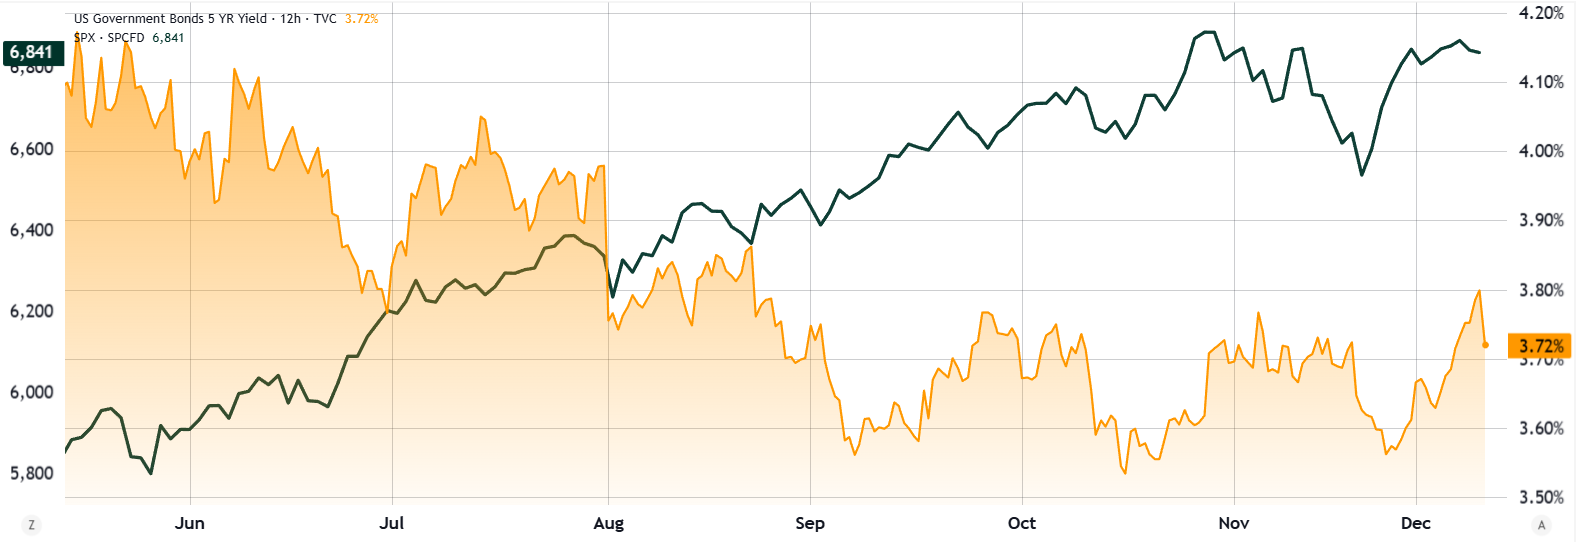
The Fed’s split decision on Wednesday to cap interest rates at 3.75% was widely expected, and Fed Chair Jerome Powell struck a restrained tone during the press conference following the committee meeting. Powell highlighted the ongoing risks tied to labor market weakness and stubborn inflation. Two Fed members, however, voted to keep rates at 4%, an unusually sharp divergence for a committee that typically shows strong internal alignment.
More notable was the Fed’s announcement that it will begin purchasing short-dated government bonds to “help manage liquidity levels
BTC-0,36%
- Reward
- 4
- 4
- Repost
- Share
User_any:
1000x Vibes 🤑View More
🎉 December Miracle Feast is in full swing 🎉
🔥 100,000 USDT prize pool is accelerating in distribution!
Daily trading check-ins are still valid, with a total of 260 USDT available
Rush for trading rankings, the top individual can still win up to 3,000 USDT
✨ Newcomer bonus 1.5x bonus is still available
Join now and seize the opportunity for big rewards!
🔖 Participate now: https://www.gate.com/campaigns/3449
🔍 Event details: https://www.gate.com/announcements/article/48519
#PostonSquaretoEarn$50 $XRP
XRP4,29%


- Reward
- 3
- 3
- Repost
- Share
Discovery:
Watching Closely 🔍View More
🏎️ Red Bull Year-End Sprint Race Countdown
Get ready to hit the 50,000 GT prize pool, 24H countdown begins
Contract and Spot Trading dual tracks launched simultaneously, participate to win prizes
Join now: https://www.gate.com/competition/f1rb/2025
#RedBull #GateRedBullRacingTour $BTC $GT
Get ready to hit the 50,000 GT prize pool, 24H countdown begins
Contract and Spot Trading dual tracks launched simultaneously, participate to win prizes
Join now: https://www.gate.com/competition/f1rb/2025
#RedBull #GateRedBullRacingTour $BTC $GT


- Reward
- 3
- 2
- Repost
- Share
Discovery:
Watching Closely 🔍View More
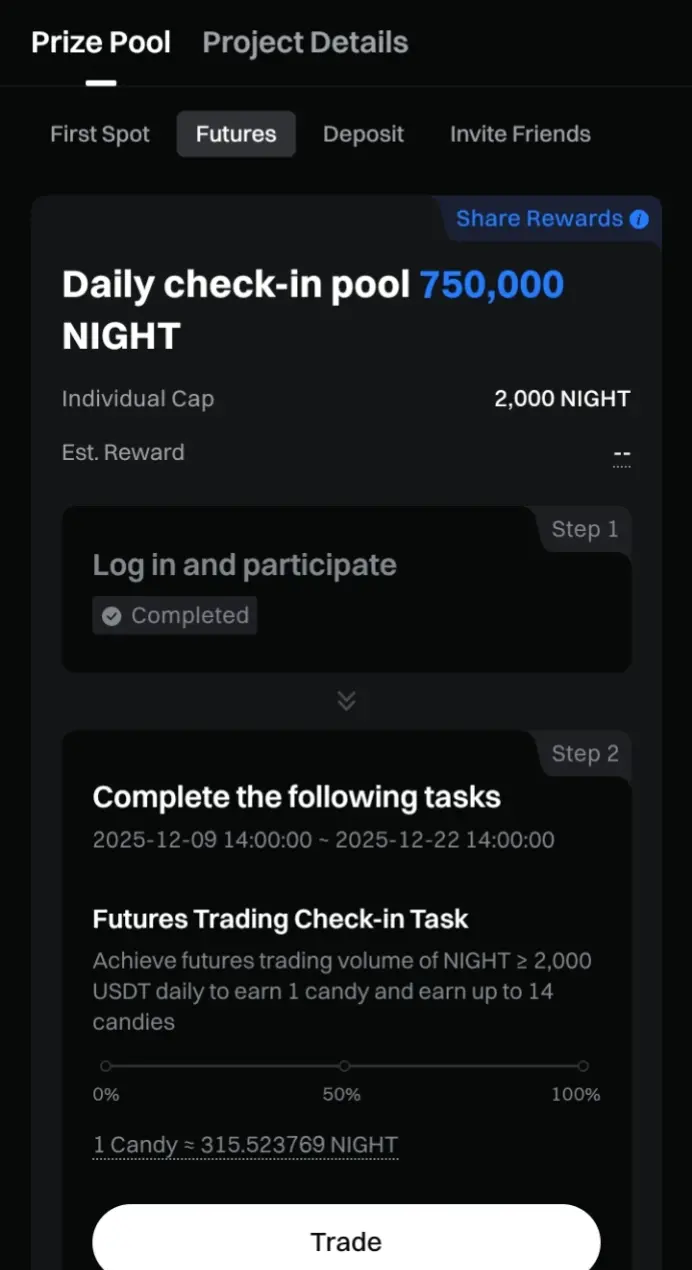
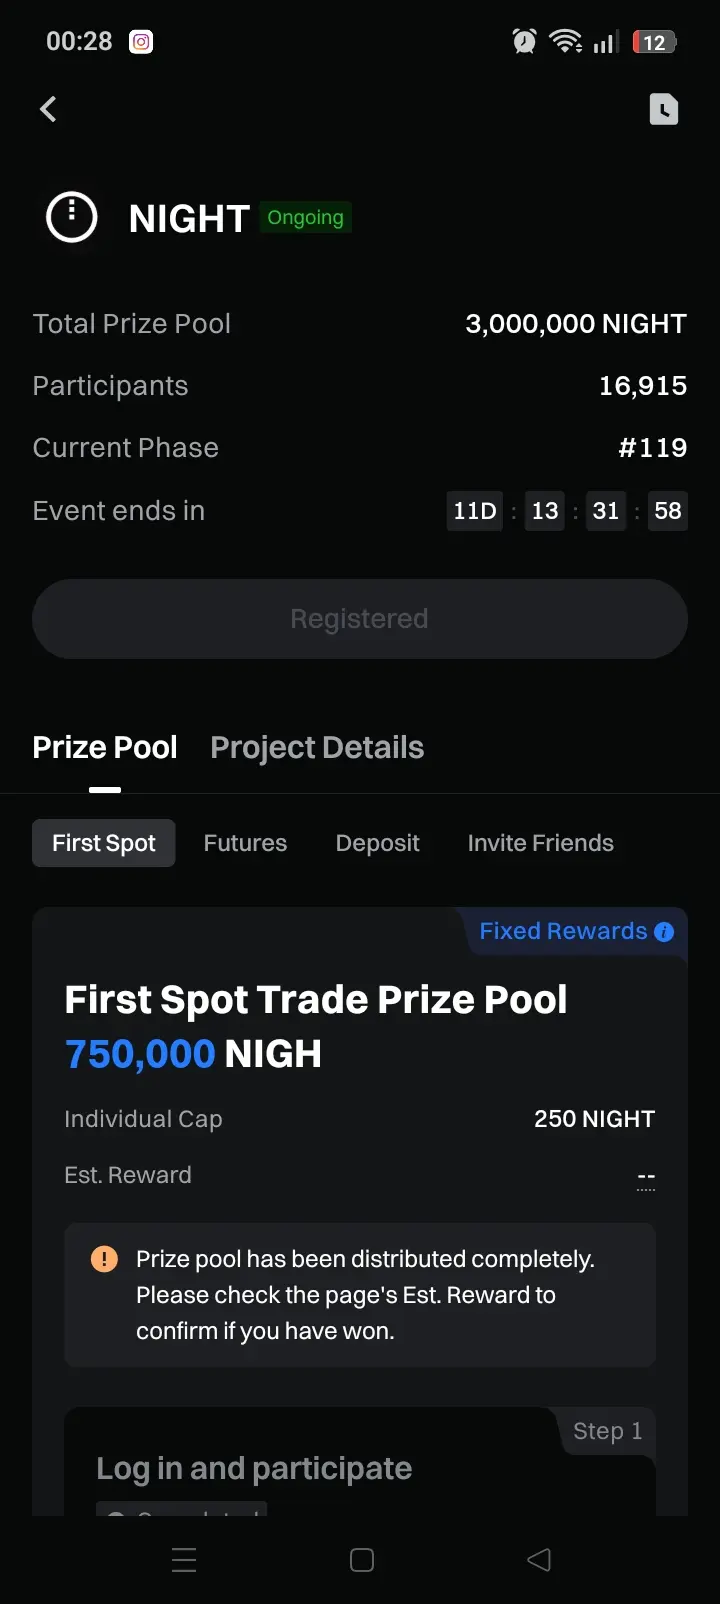
🔥 #PostToWinNIGHT 🔥
Hello friends, today I want to talk about Candydrops, what is candy how can we use it?! I will explain this question for you. I always join Lanchpools candy's and holder airdrops and earn endless airdrop. how???get more info$👇👇👇
1. First Spot Trading Pool Rules:
Users who make their first-ever spot trade on Gate and execute a NIGHT spot trade ≥ 500 USDT will receive a fixed 250 NIGHT reward (first-come, first-served). Total prize pool: 750,000 NIGHT, distributed after the event.
2. Daily Check-in Rules:
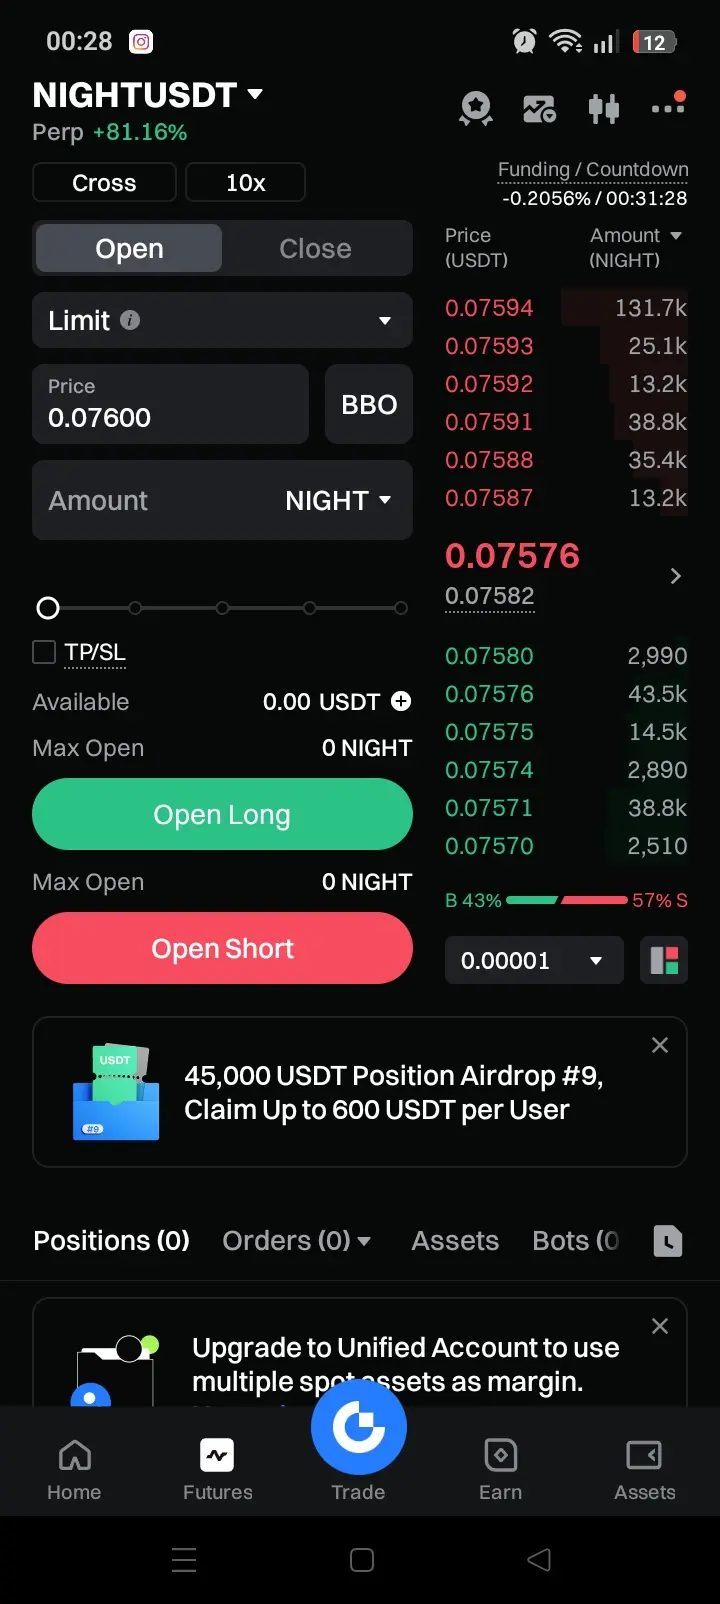
During the event, users who achieve a daily NIGHT futures trading
Hello friends, today I want to talk about Candydrops, what is candy how can we use it?! I will explain this question for you. I always join Lanchpools candy's and holder airdrops and earn endless airdrop. how???get more info$👇👇👇
1. First Spot Trading Pool Rules:
Users who make their first-ever spot trade on Gate and execute a NIGHT spot trade ≥ 500 USDT will receive a fixed 250 NIGHT reward (first-come, first-served). Total prize pool: 750,000 NIGHT, distributed after the event.
2. Daily Check-in Rules:
During the event, users who achieve a daily NIGHT futures trading
NIGHT-2,1%

- Reward
- 3
- 2
- Repost
- Share
Discovery:
teşekkürler güzel bilgiler içinView More
#FedRateCutPrediction
Bitcoin catches a bid, but data shows pro traders skeptical of rally above $92K
Bitcoin's rejection at the short-term range highs was caused by macroeconomic uncertainty, liquidations and stagnant spot ETF flows. Will clearer signals from the US economy boost BTC volumes?
Key takeaways:
Economic uncertainty, a delayed jobs report and weakness in the housing market are causing traders to retreat from Bitcoin.
Pro traders are incurring high costs to protect against Bitcoin price drops, while in China, stablecoins are being sold at a discount to exit the crypto market.
$94,
BTC-0,36%
MC:$3.54KHolders:1
0.00%
- Reward
- 1
- 1
- Repost
- Share
Discovery:
Watching Closely 🔍#JoinCreatorCertificationProgramToEarn$10,000
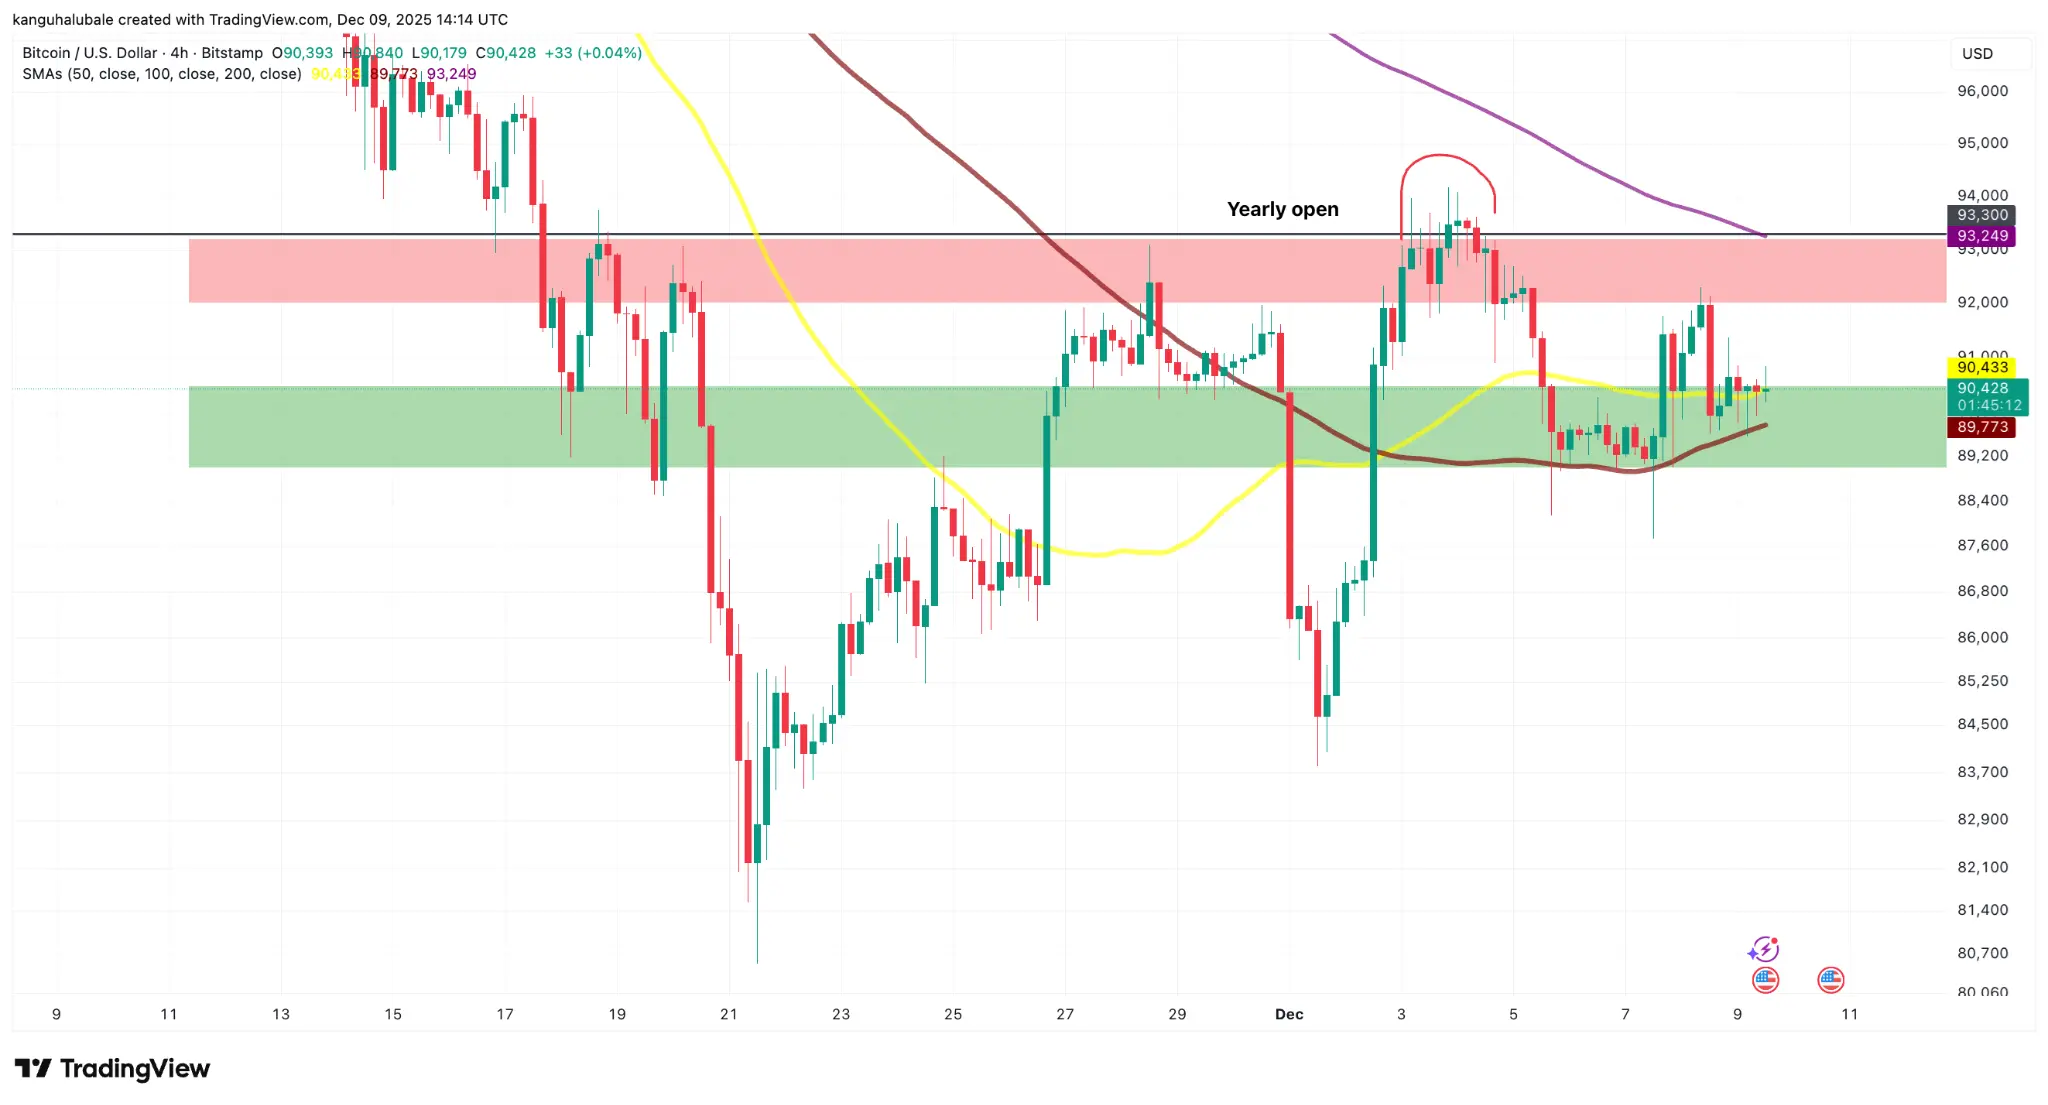
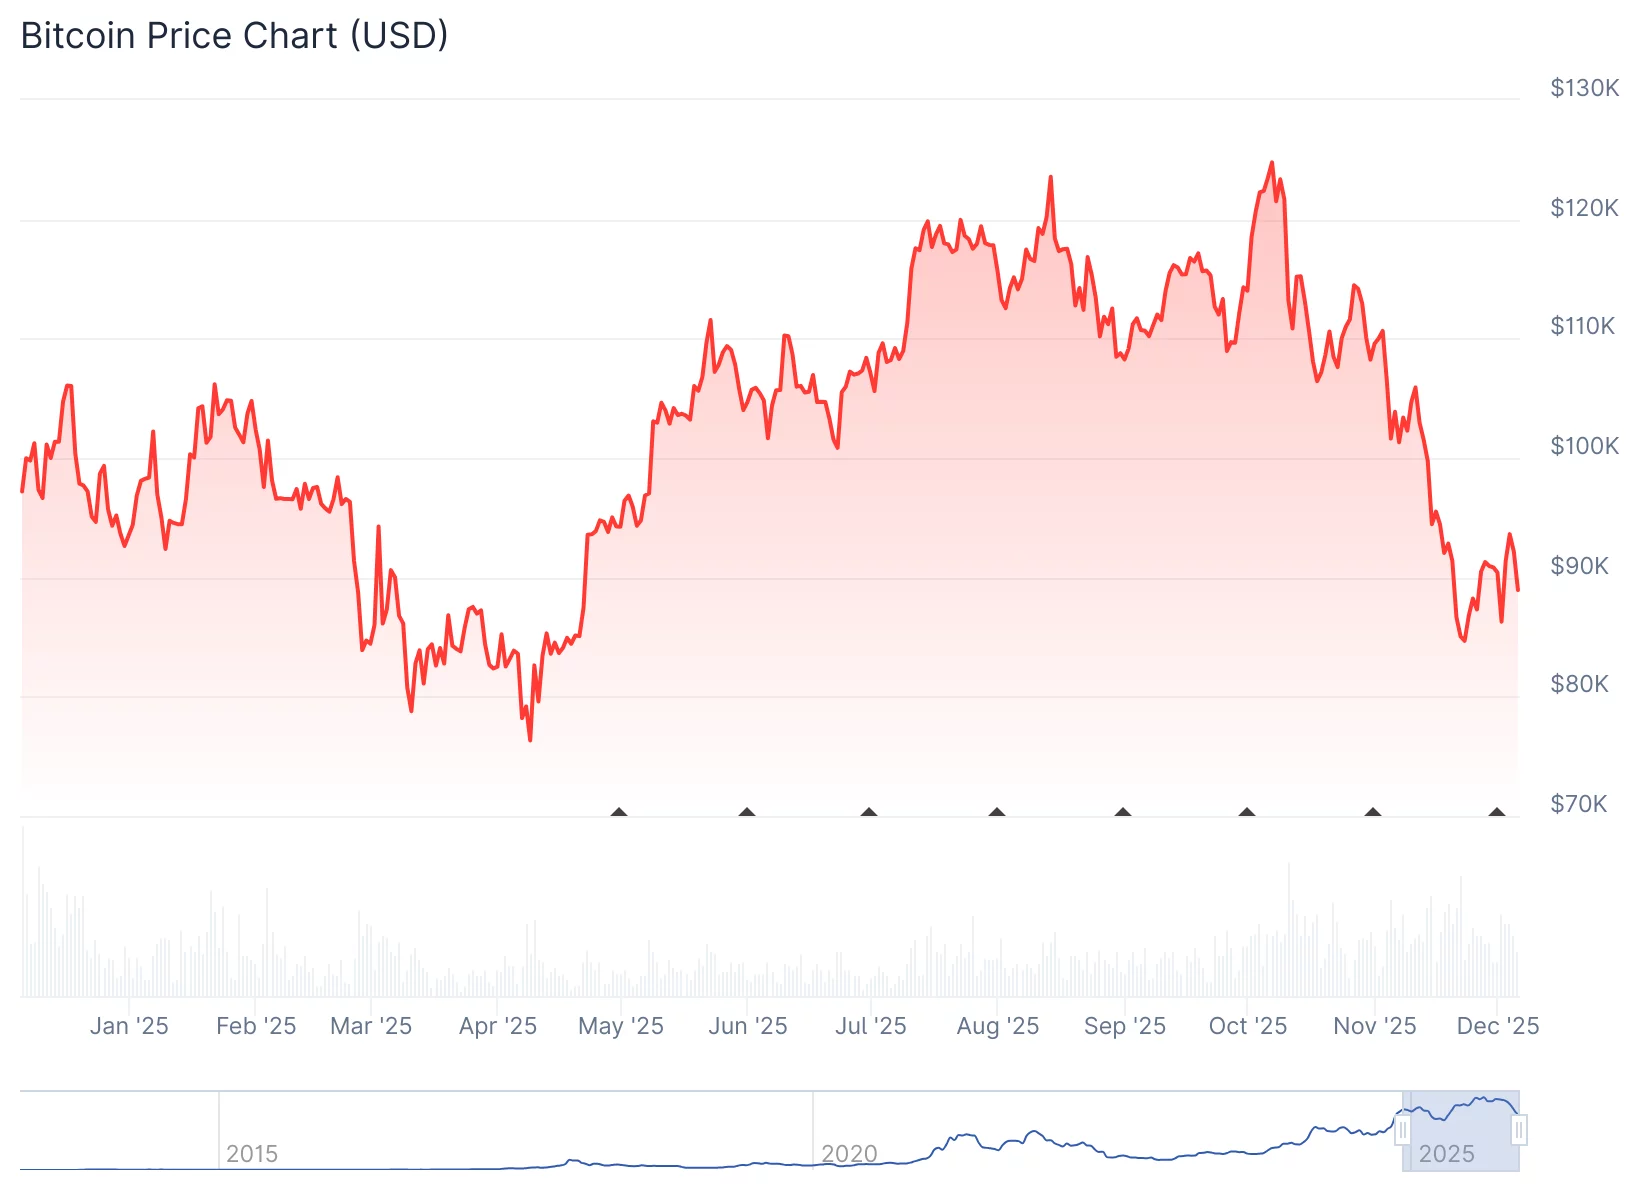
BTC price stuck between two trendlines
Bitcoin’s recent recovery was rejected by resistance from the yearly open at $93,300, which coincides with the 200-period simple moving average (SMA), as shown on the four-hour chart below.
This move, however, saw BTC/USD find support at the $89,000-$90,500 demand zone, where the 50 and 100 SMAs currently are.
BTC price stuck between two trendlines
Bitcoin’s recent recovery was rejected by resistance from the yearly open at $93,300, which coincides with the 200-period simple moving average (SMA), as shown on
BTC price stuck between two trendlines
Bitcoin’s recent recovery was rejected by resistance from the yearly open at $93,300, which coincides with the 200-period simple moving average (SMA), as shown on the four-hour chart below.
This move, however, saw BTC/USD find support at the $89,000-$90,500 demand zone, where the 50 and 100 SMAs currently are.
BTC price stuck between two trendlines
Bitcoin’s recent recovery was rejected by resistance from the yearly open at $93,300, which coincides with the 200-period simple moving average (SMA), as shown on
BTC-0,36%

MC:$3.57KHolders:2
0.00%
- Reward
- 1
- 3
- Repost
- Share
Discovery:
Buy To Earn 💎View More
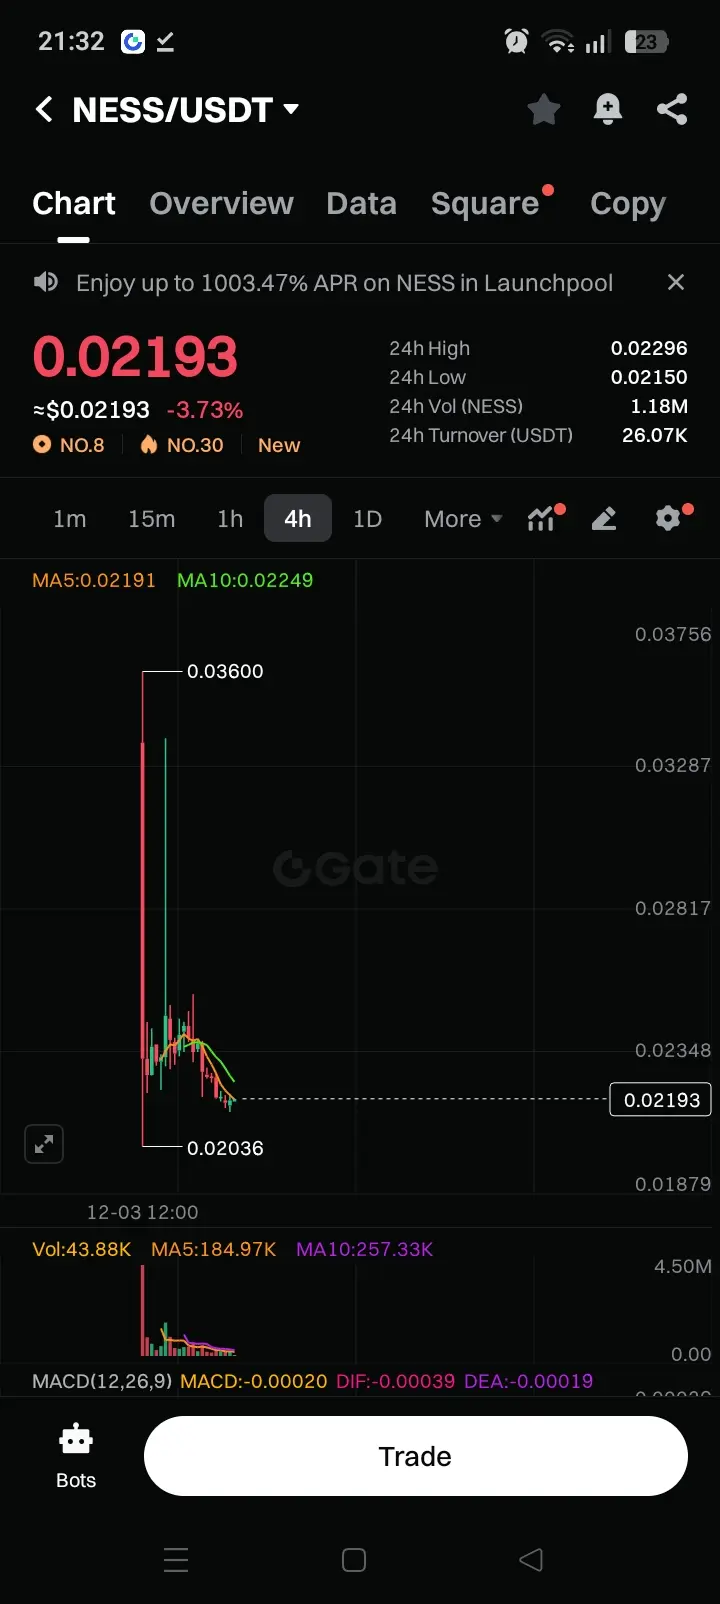
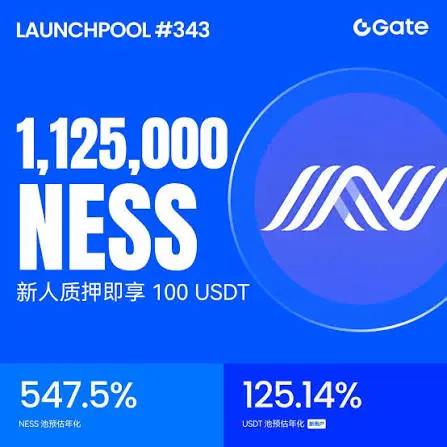
#PostToWinNESS
Today I want to talk about GAte's airdrop system, I joined and earnd lot's of airdrop from gate. there holder airdrop lanchpool candy and other airdrops which you can join and earn money from this activity's. today I want to give info about $Ness
Gate will list Ness LAB (NESS) for spot About Ness LAB (NESS)
Ness Lab is an innovative platform designed to advance the information economy by enabling meaningful connections, collaboration, and knowledge sharing among users. At the core of the ecosystem is the NESS Token, a blockchain-based digital asset that powers participation an

MC:$3.69KHolders:3
0.00%
- Reward
- 8
- 3
- Repost
- Share
EagleEye:
It’s just the best 👌View More
#MyFirstPostOnSquare
Hello world, it's been a long time since I left here, but I've decided to come back. I'm here now and I'm never leaving again.
Latest news in the crypto world
Trump boom? More like a whiff
The broader crypto market has shed more than $1 trillion in value since a harsh liquidation wave in early October triggered a prolonged rout. Retail traders, accustomed to the dizzying highs of early 2024, have proven less able to stomach the drop.
Institutions can hold through the pain — but the outflows suggest many are choosing not to.
And for those clinging to the political narrativ
BTC-0,36%

- Reward
- 5
- 5
- Repost
- Share
RK-G-01:
DYOR 🤓View More
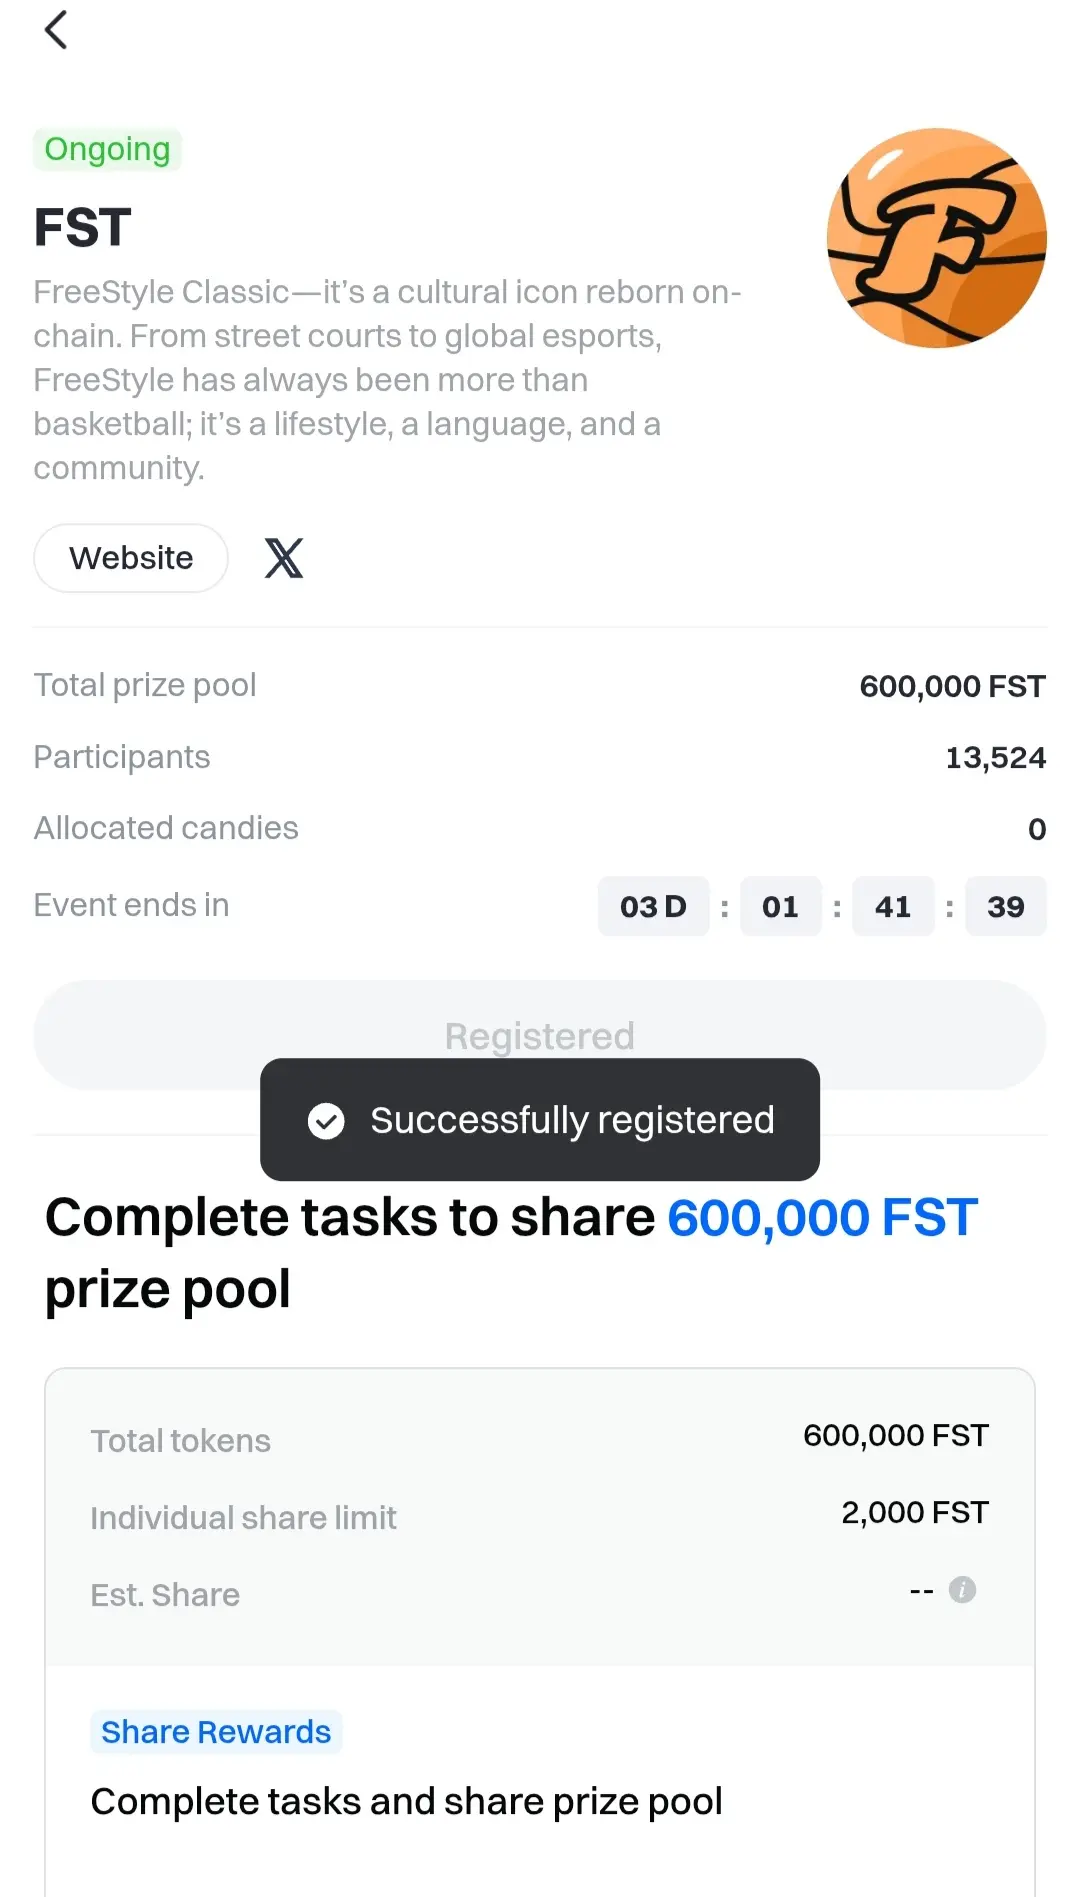
🍬#FST Creative Contest 🍬
If you remember few days ago i talked about another token and my goal from another airdrops and share the result of this events. now i am happy giving information about FST token firstly i want to give short and important info about this token, then i also share activty link and you can click and get more info about this airdrop. just few steps you need to do. first ypu must to join and then you can start to trade, that's all super easy and interesting actvty and now time to start together. 💪💪💪💪
1️⃣Project Introduction
FreeStyle Classic is more than entertain

- Reward
- 21
- 5
- Repost
- Share
JOHAR09:
Bull Run 🐂View More
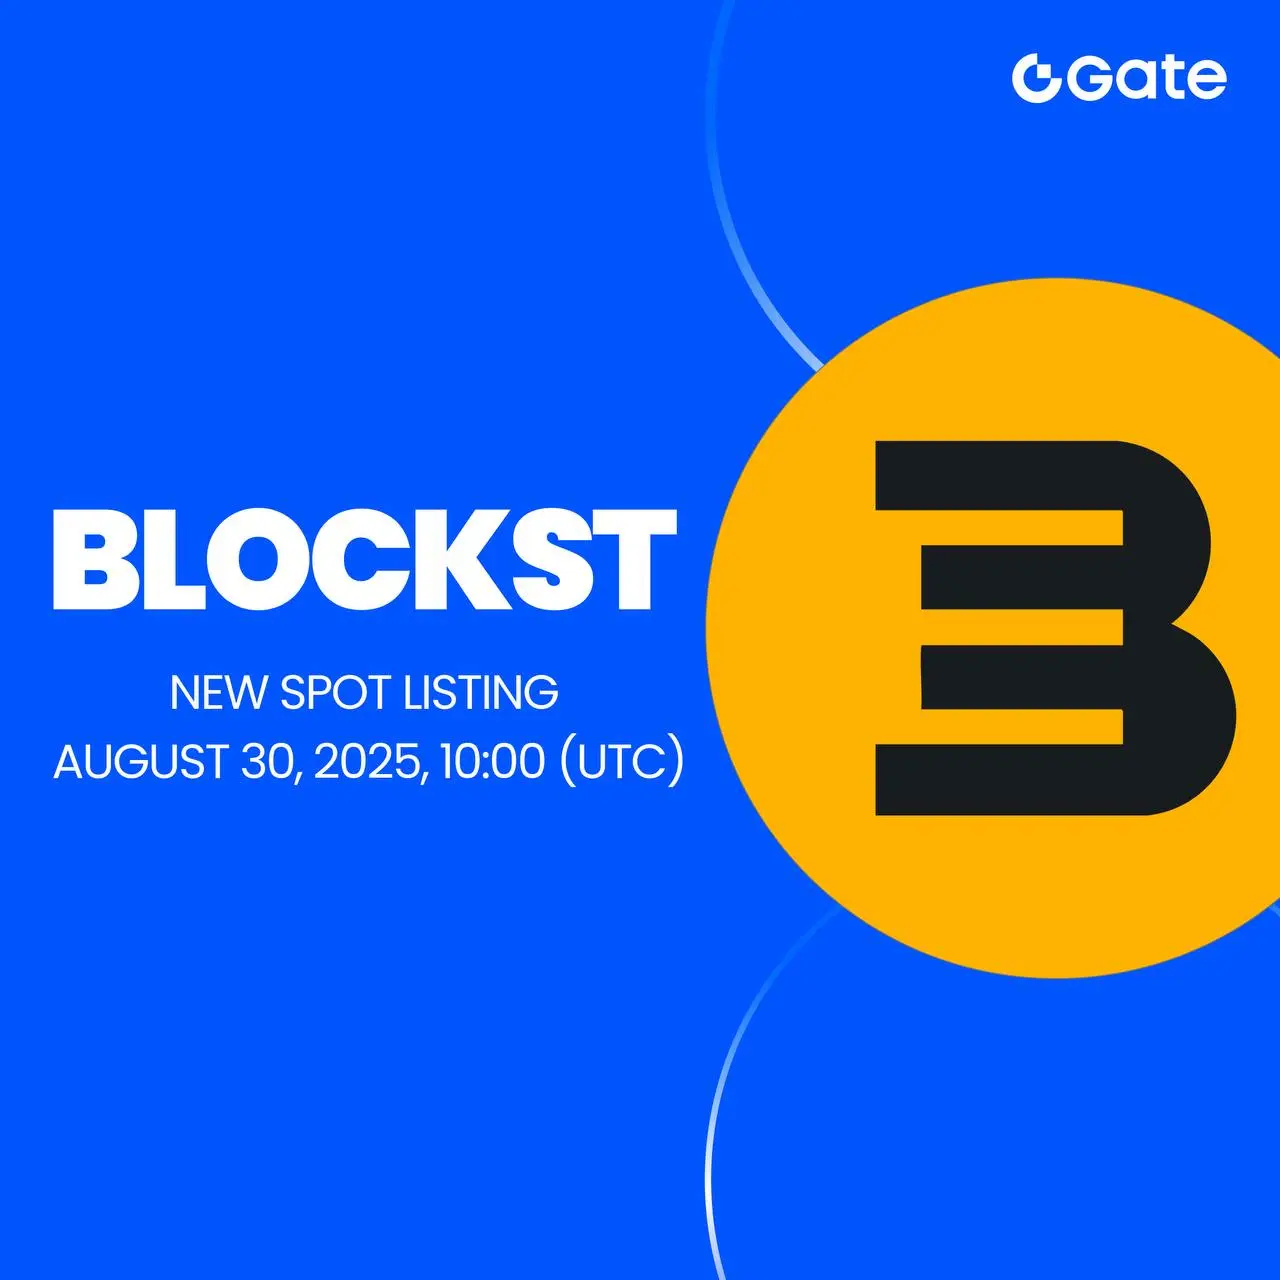
Gate New Listing: $BLOCKST
🔹 Trading Pair: $BLOCKST / $USDT
🔹 Trading Starts: 10:00 AM, August 30th (UTC)
Trade: https://gate.com/trade/BLOCKST_USDT
Details: https://gate.com/article/46851
🔹 Trading Pair: $BLOCKST / $USDT
🔹 Trading Starts: 10:00 AM, August 30th (UTC)
Trade: https://gate.com/trade/BLOCKST_USDT
Details: https://gate.com/article/46851
[The user has shared his/her trading data. Go to the App to view more.]
- Reward
- 13
- 7
- Repost
- Share
JOHAR09:
Bull Run 🐂View More
- Reward
- 5
- 6
- Repost
- Share
JOHAR09:
Bull Run 🐂View More
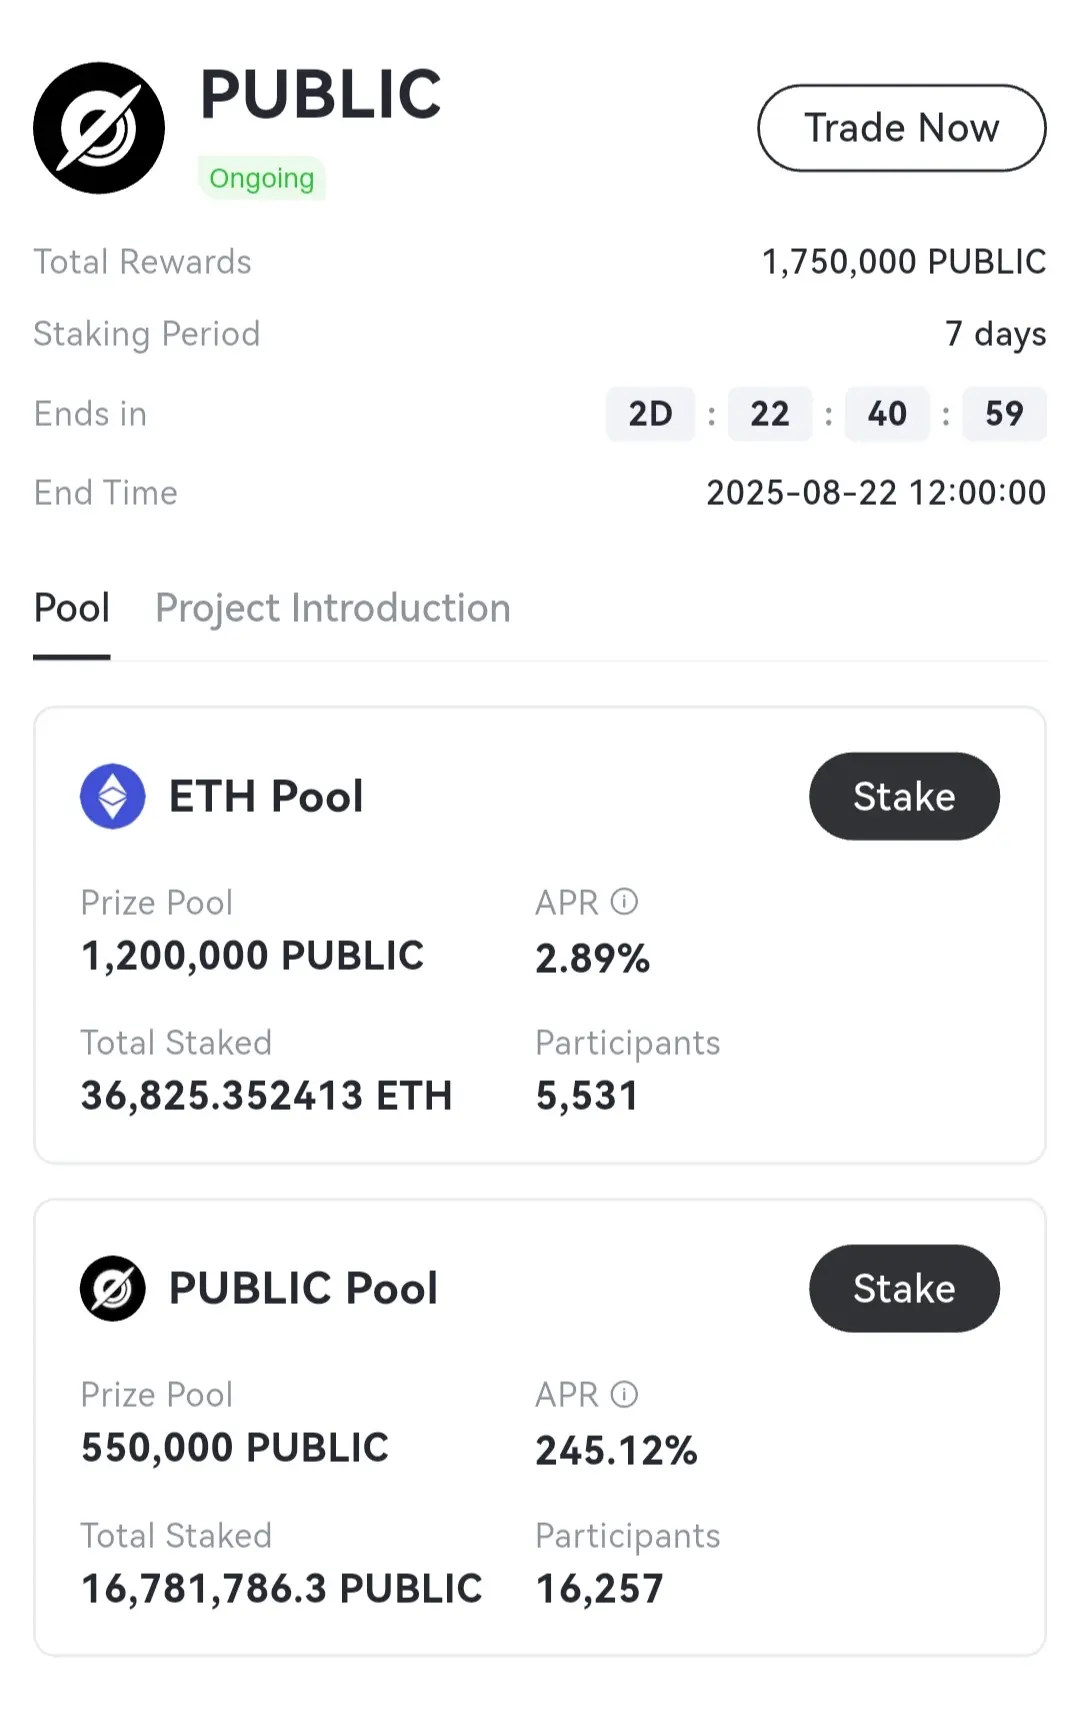
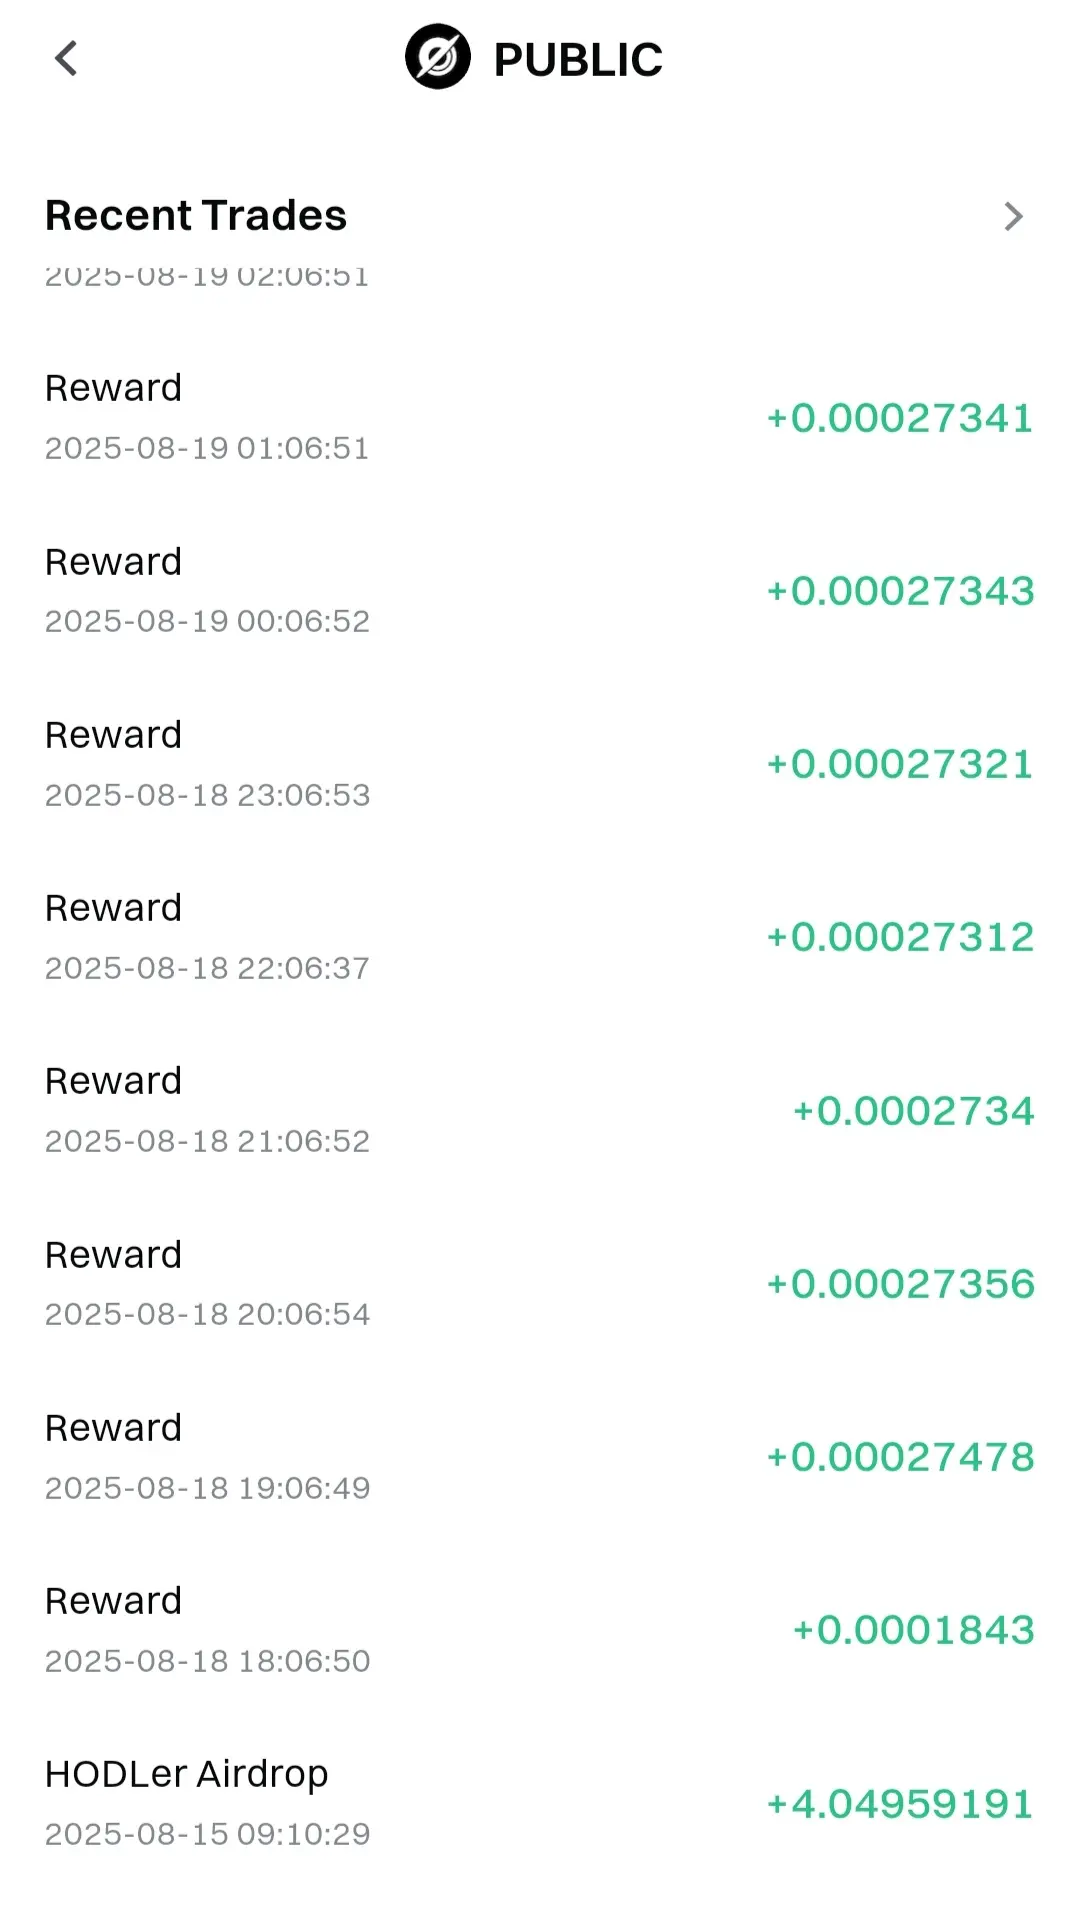
📢#PUBLIC Creative Contest
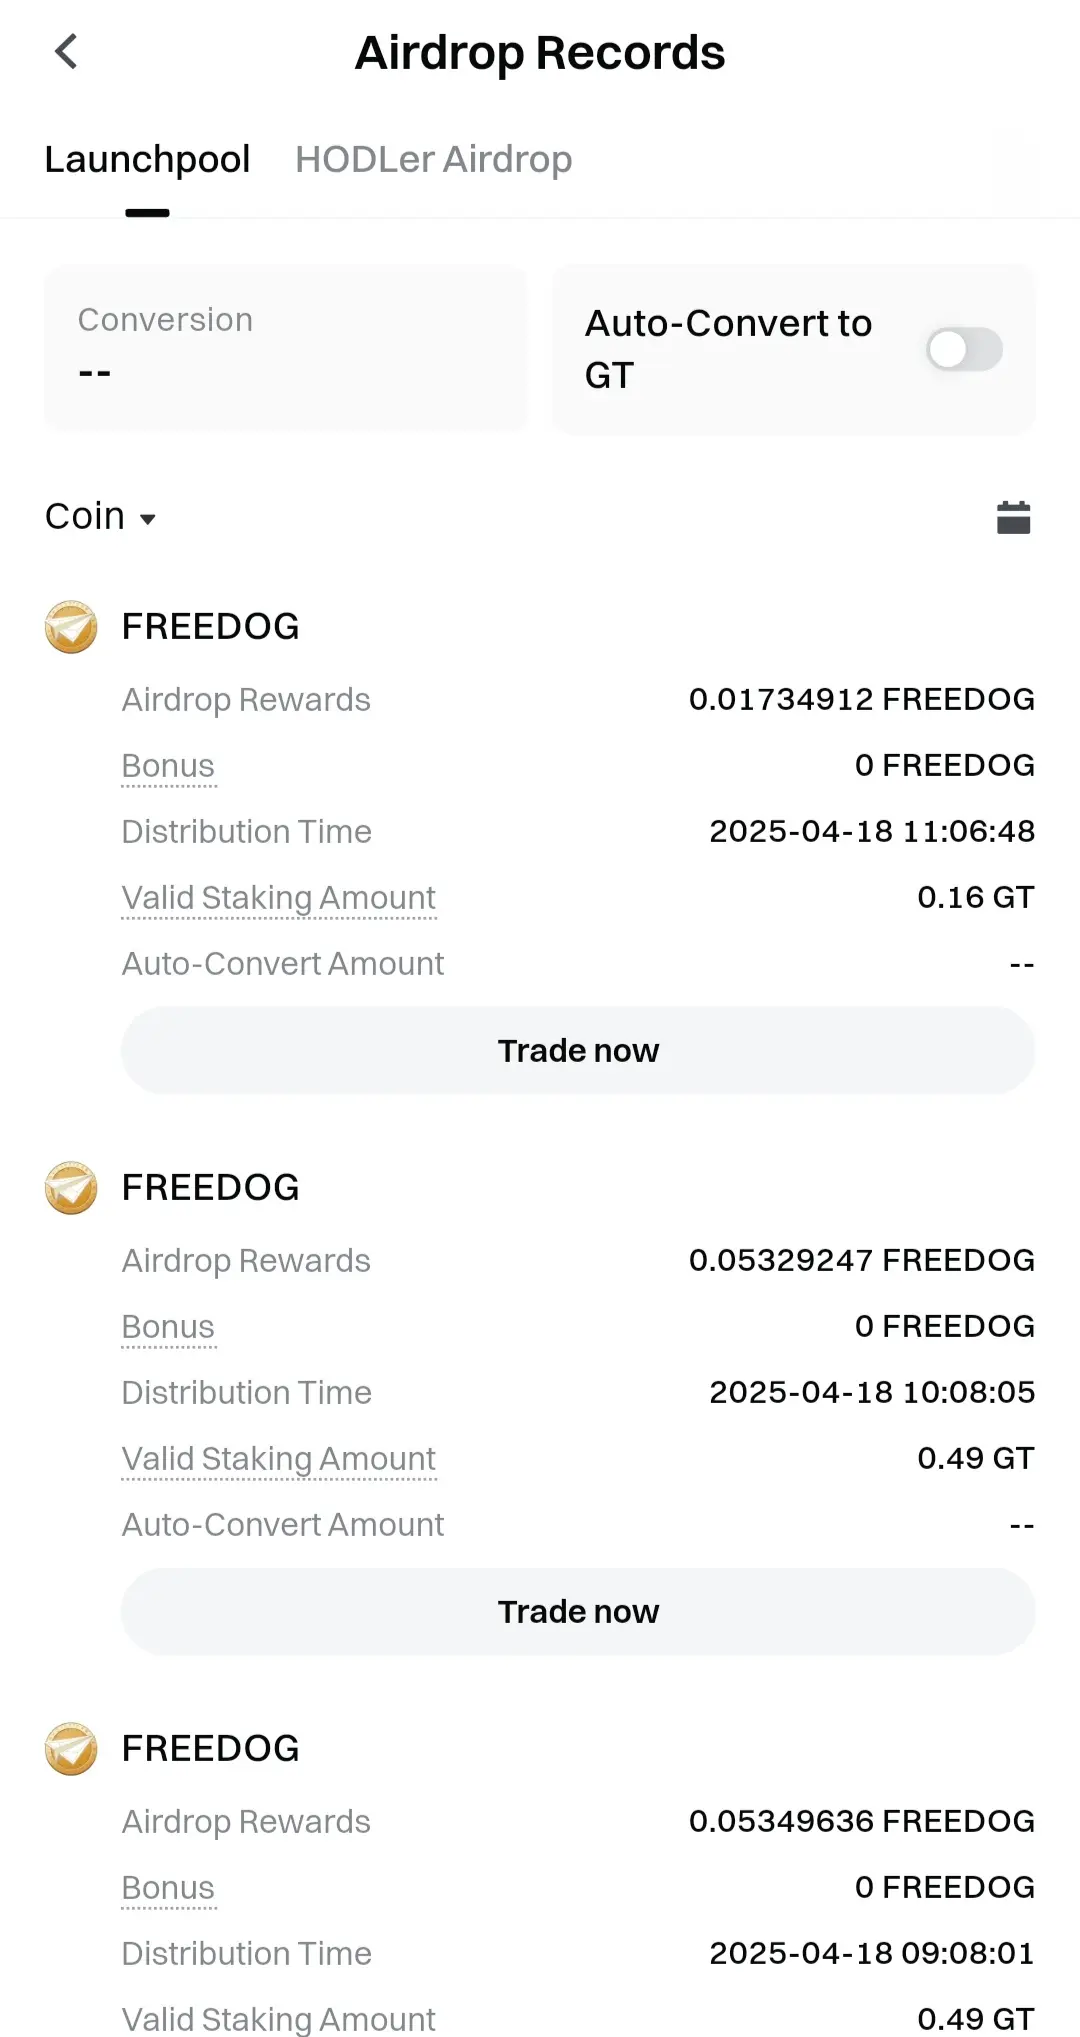
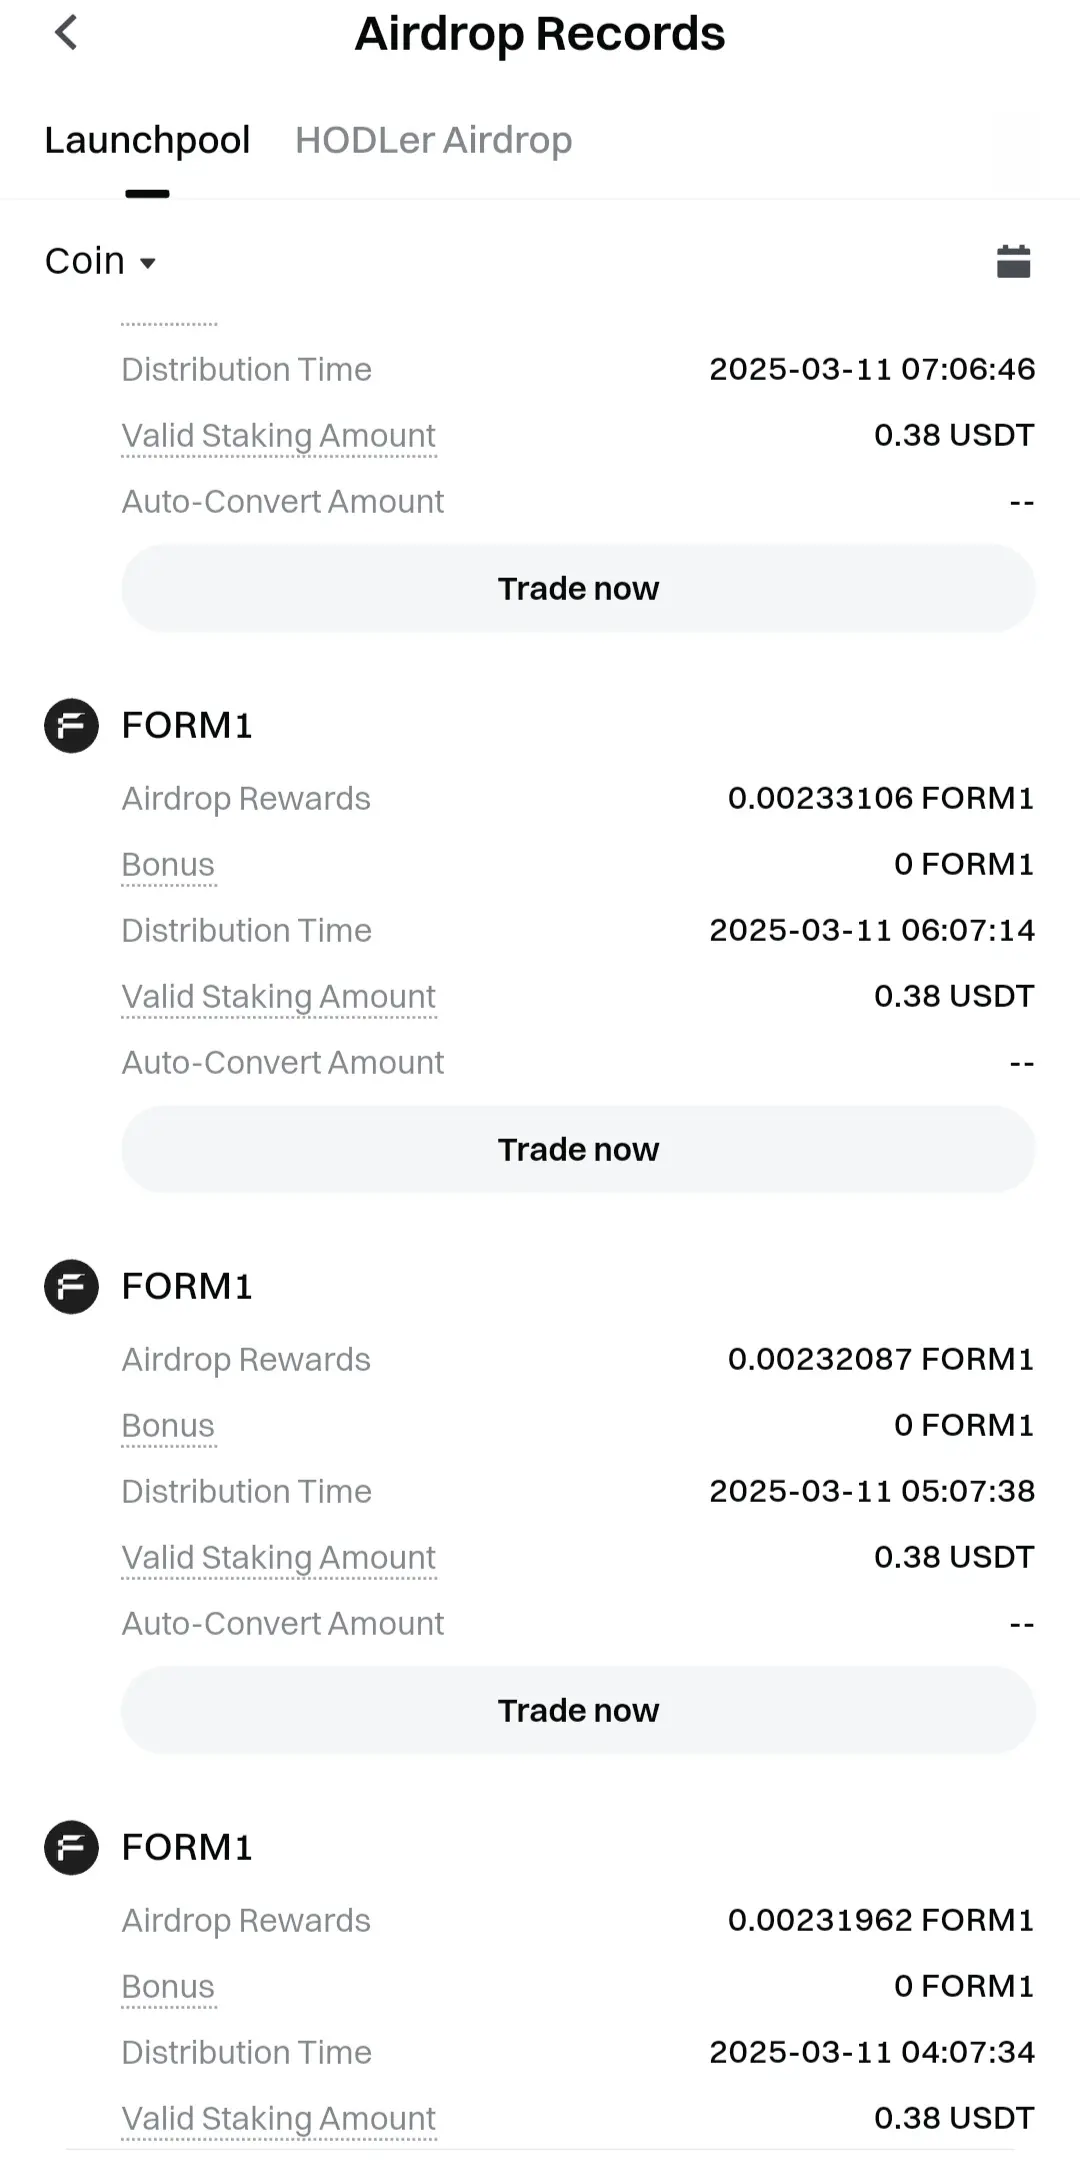
I also want to share my Lachpool history, you can see which project i joind and how can i earn reward also i share link of this activty whic you can also join and claim airdrop
💰 Gate “Launchpool” Stake to Earn Airdrops: PublicAI (PUBLIC)
🗓 Subscription: 08:00 AM, August 15 — August 22 (UTC)
✉️ Token Staked: $ETH & $PUBLIC
💵 Total Reward: 1,750,000 $PUBLIC
✨ Estimated APR: 1,433.93%
👑 Enjoy 50% Rewards Boost by Redeeming to Simple Earn Fixed Term
👉 Stake to Earn Now: https://www.gate.com/launchpool/PUBLIC?pid=357
Details: https://www.gate.com/article/46615

- Reward
- 13
- 1
- Repost
- Share
AytacV123:
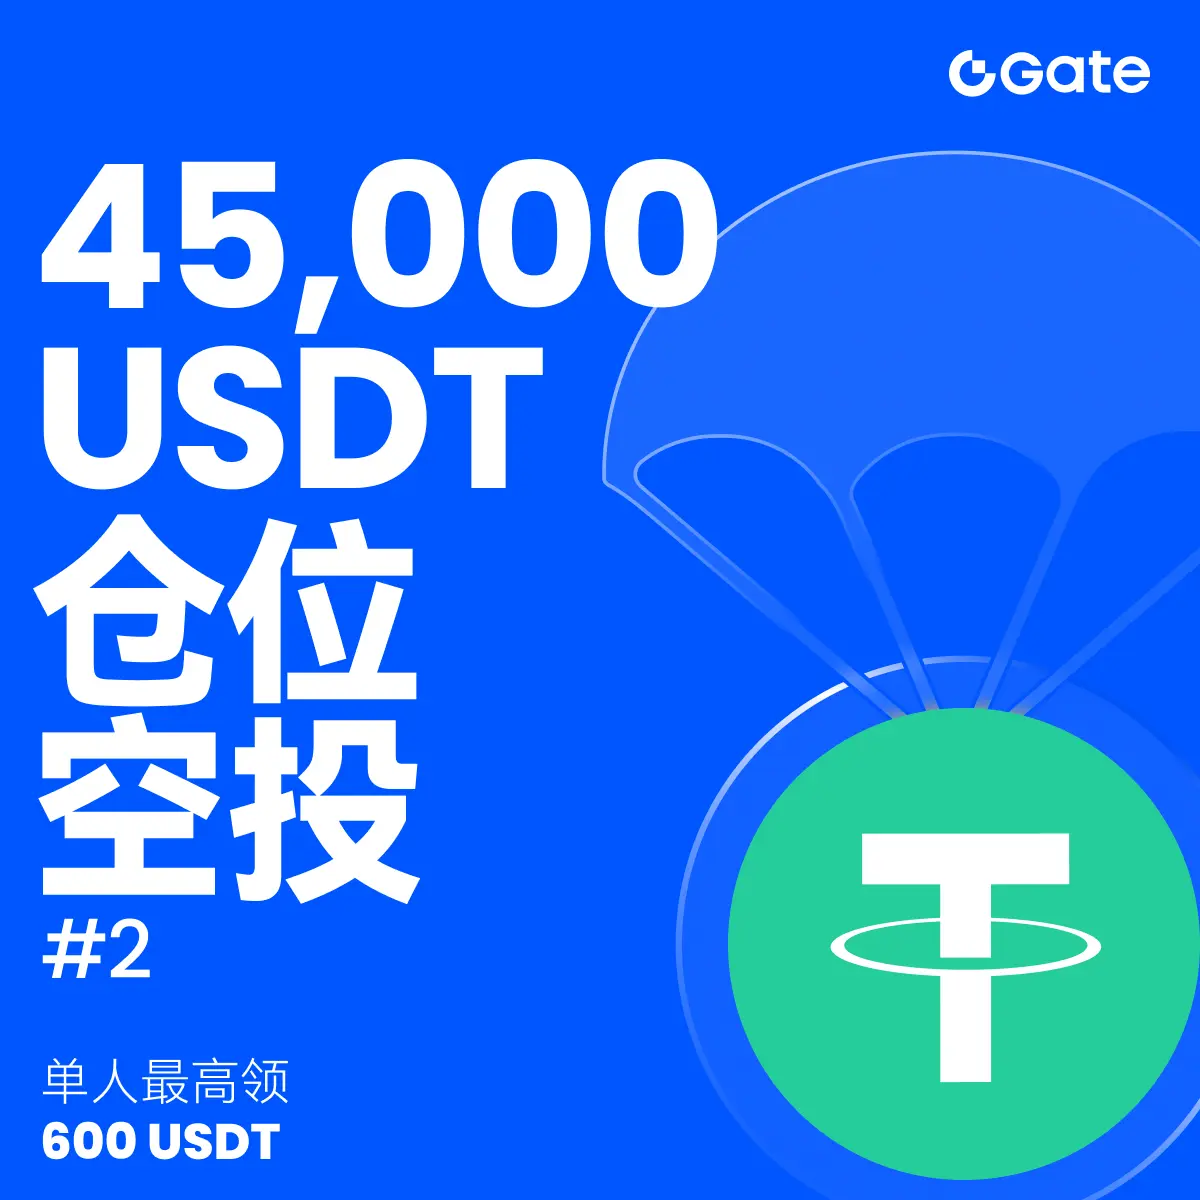
Watching Closely 🔍🔥 45,000 USDT Position Airdrop Phase 2 is Live!
Complete futures trading tasks and claim up to 600 USDT. Open to all users
📍 Join Now: https://www.gate.com/campaigns/1806
📌 Highlights:
The more you trade, the more you earn — up to 550 USDT in airdrop rewards
New & returning users can get 50 USDT with their first futures trade
Event Details: https://www.gate.com/announcements/article/46678
[The user has shared his/her trading data. Go to the App to view more.]
- Reward
- 7
- 2
- Repost
- Share
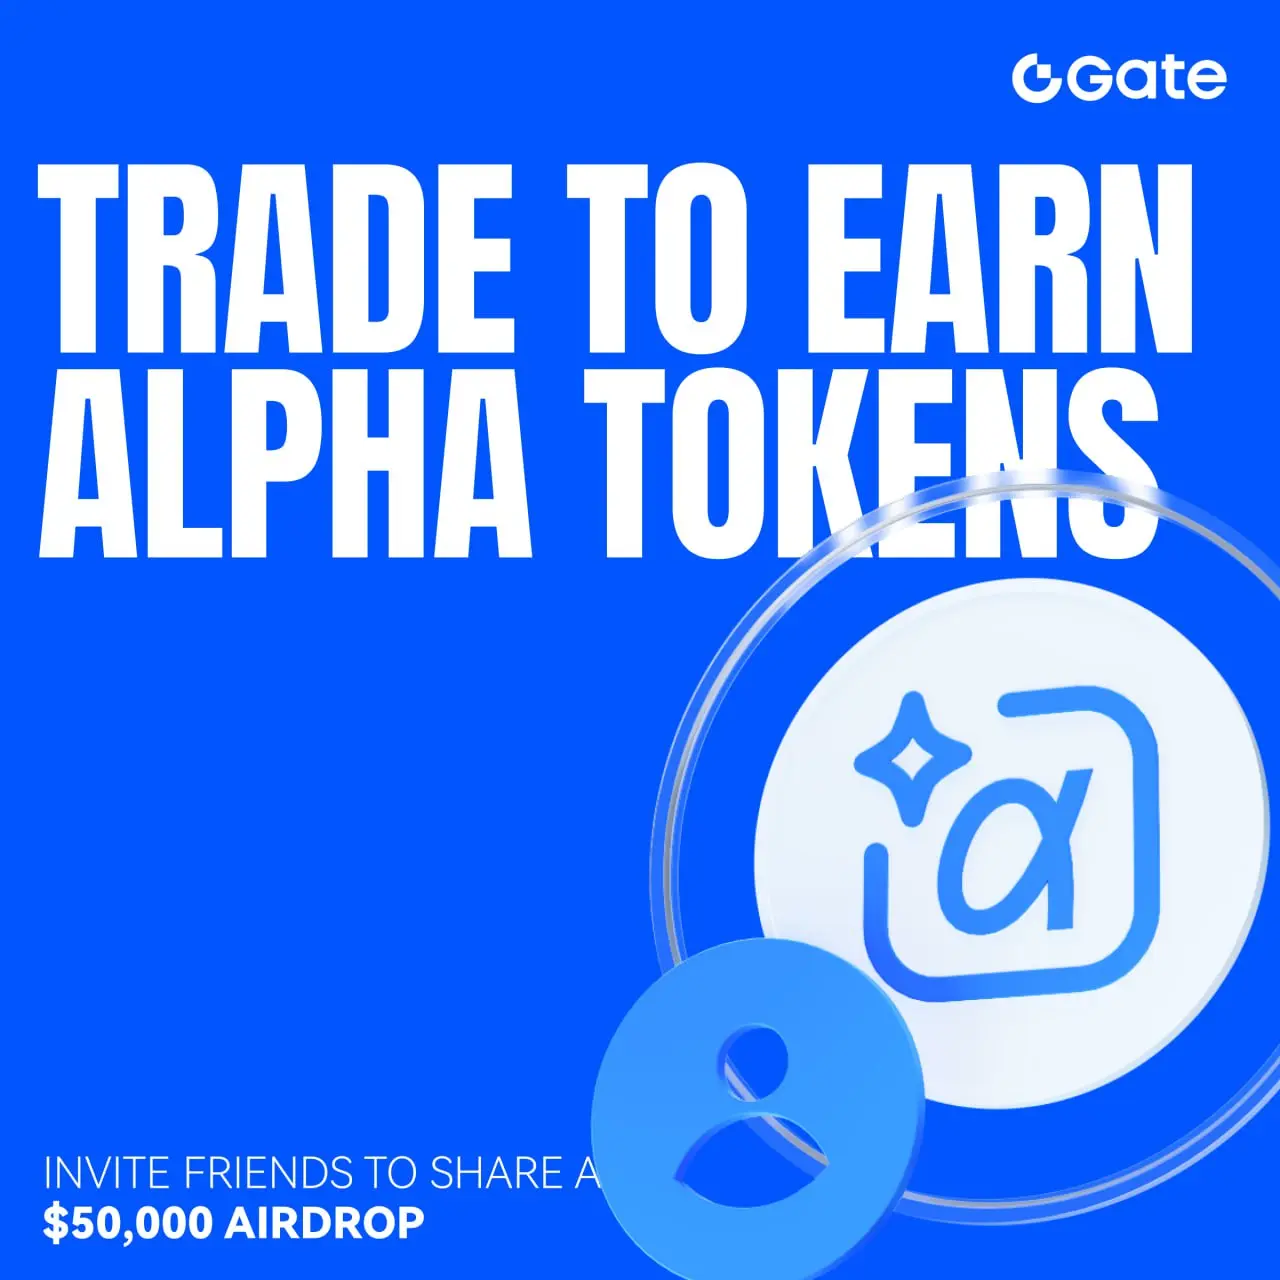
🎁#TradeToEARN
Airdrop Storm, Alpha Tokens Delivered
🔥 Invite Friends to Share $50,000 Rewards
🗓 Event Period: August 19, 03:00 AM — August 29, 15:59 PM (UTC)
👉 Join Now:https://www.gate.com/campaigns/1800
Learn More:https://www.gate.com/announcements/article/46668
Airdrop Storm, Alpha Tokens Delivered
🔥 Invite Friends to Share $50,000 Rewards
🗓 Event Period: August 19, 03:00 AM — August 29, 15:59 PM (UTC)
👉 Join Now:https://www.gate.com/campaigns/1800
Learn More:https://www.gate.com/announcements/article/46668
- Reward
- 7
- 1
- Repost
- Share
KIMJUDGE :
:
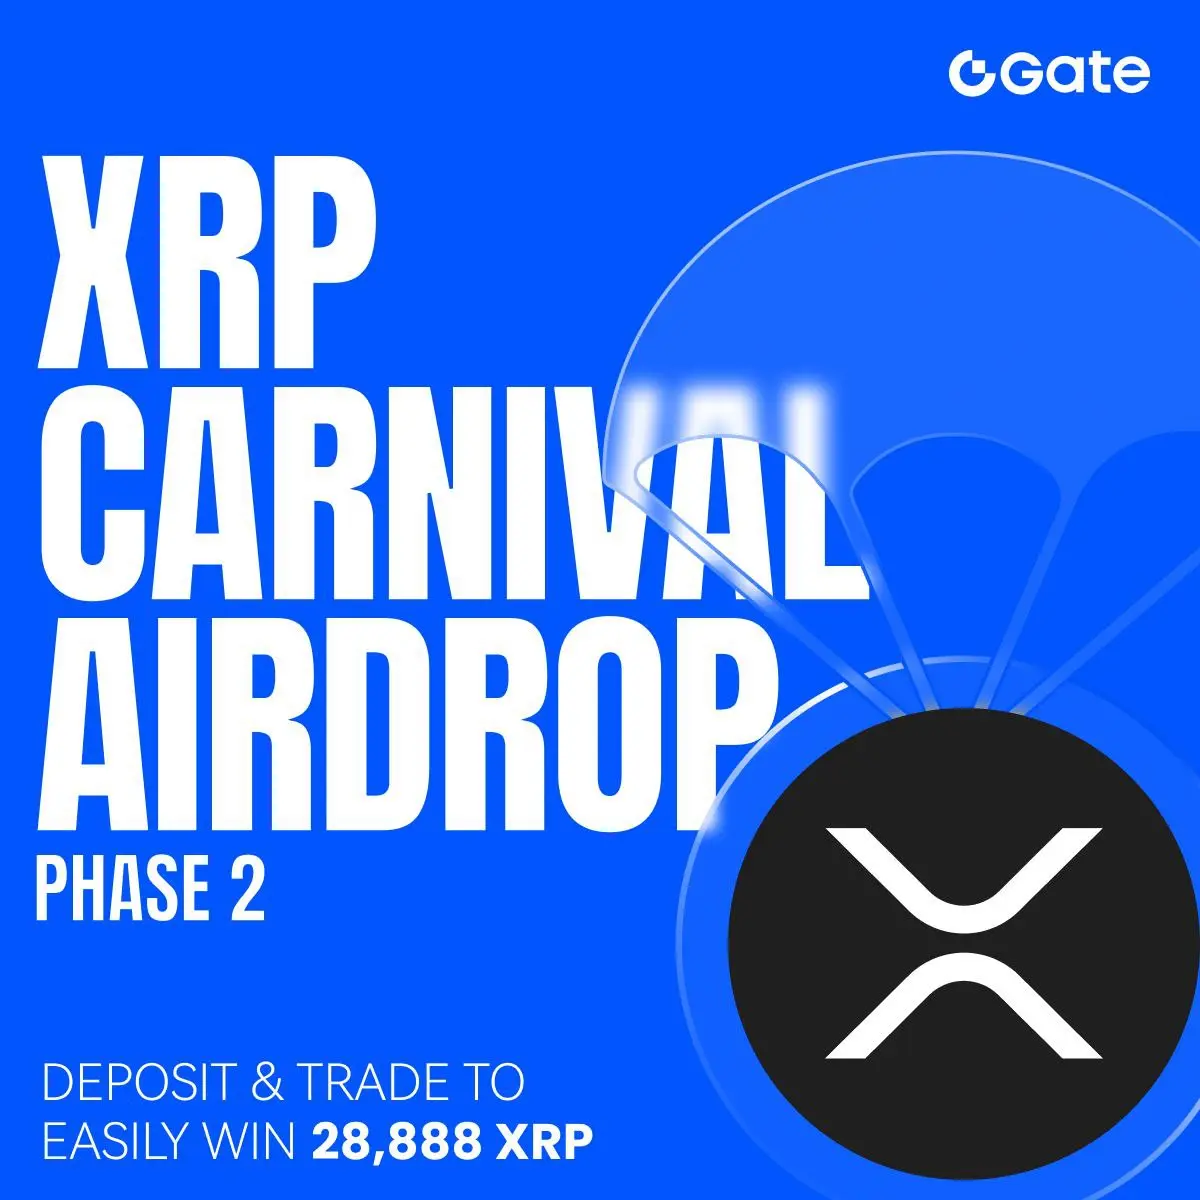
hand#Gate AirdropXRP
📣 28,888 XRP Airdrop Carnival Phase 2:Deposit & Trade to Win Double Rewards
👉🏻 Join Now: https://www.gate.com/campaigns/1802
Win XRP airdrops with deposit – 8,888 XRP prize pool awaits
Get 10 XRP for your first trade and check-ins
Unlock a 10,000 XRP grand prize pool in the trading challenge
Event Details: https://www.gate.com/announcements/article/46679

- Reward
- 6
- 2
- Repost
- Share
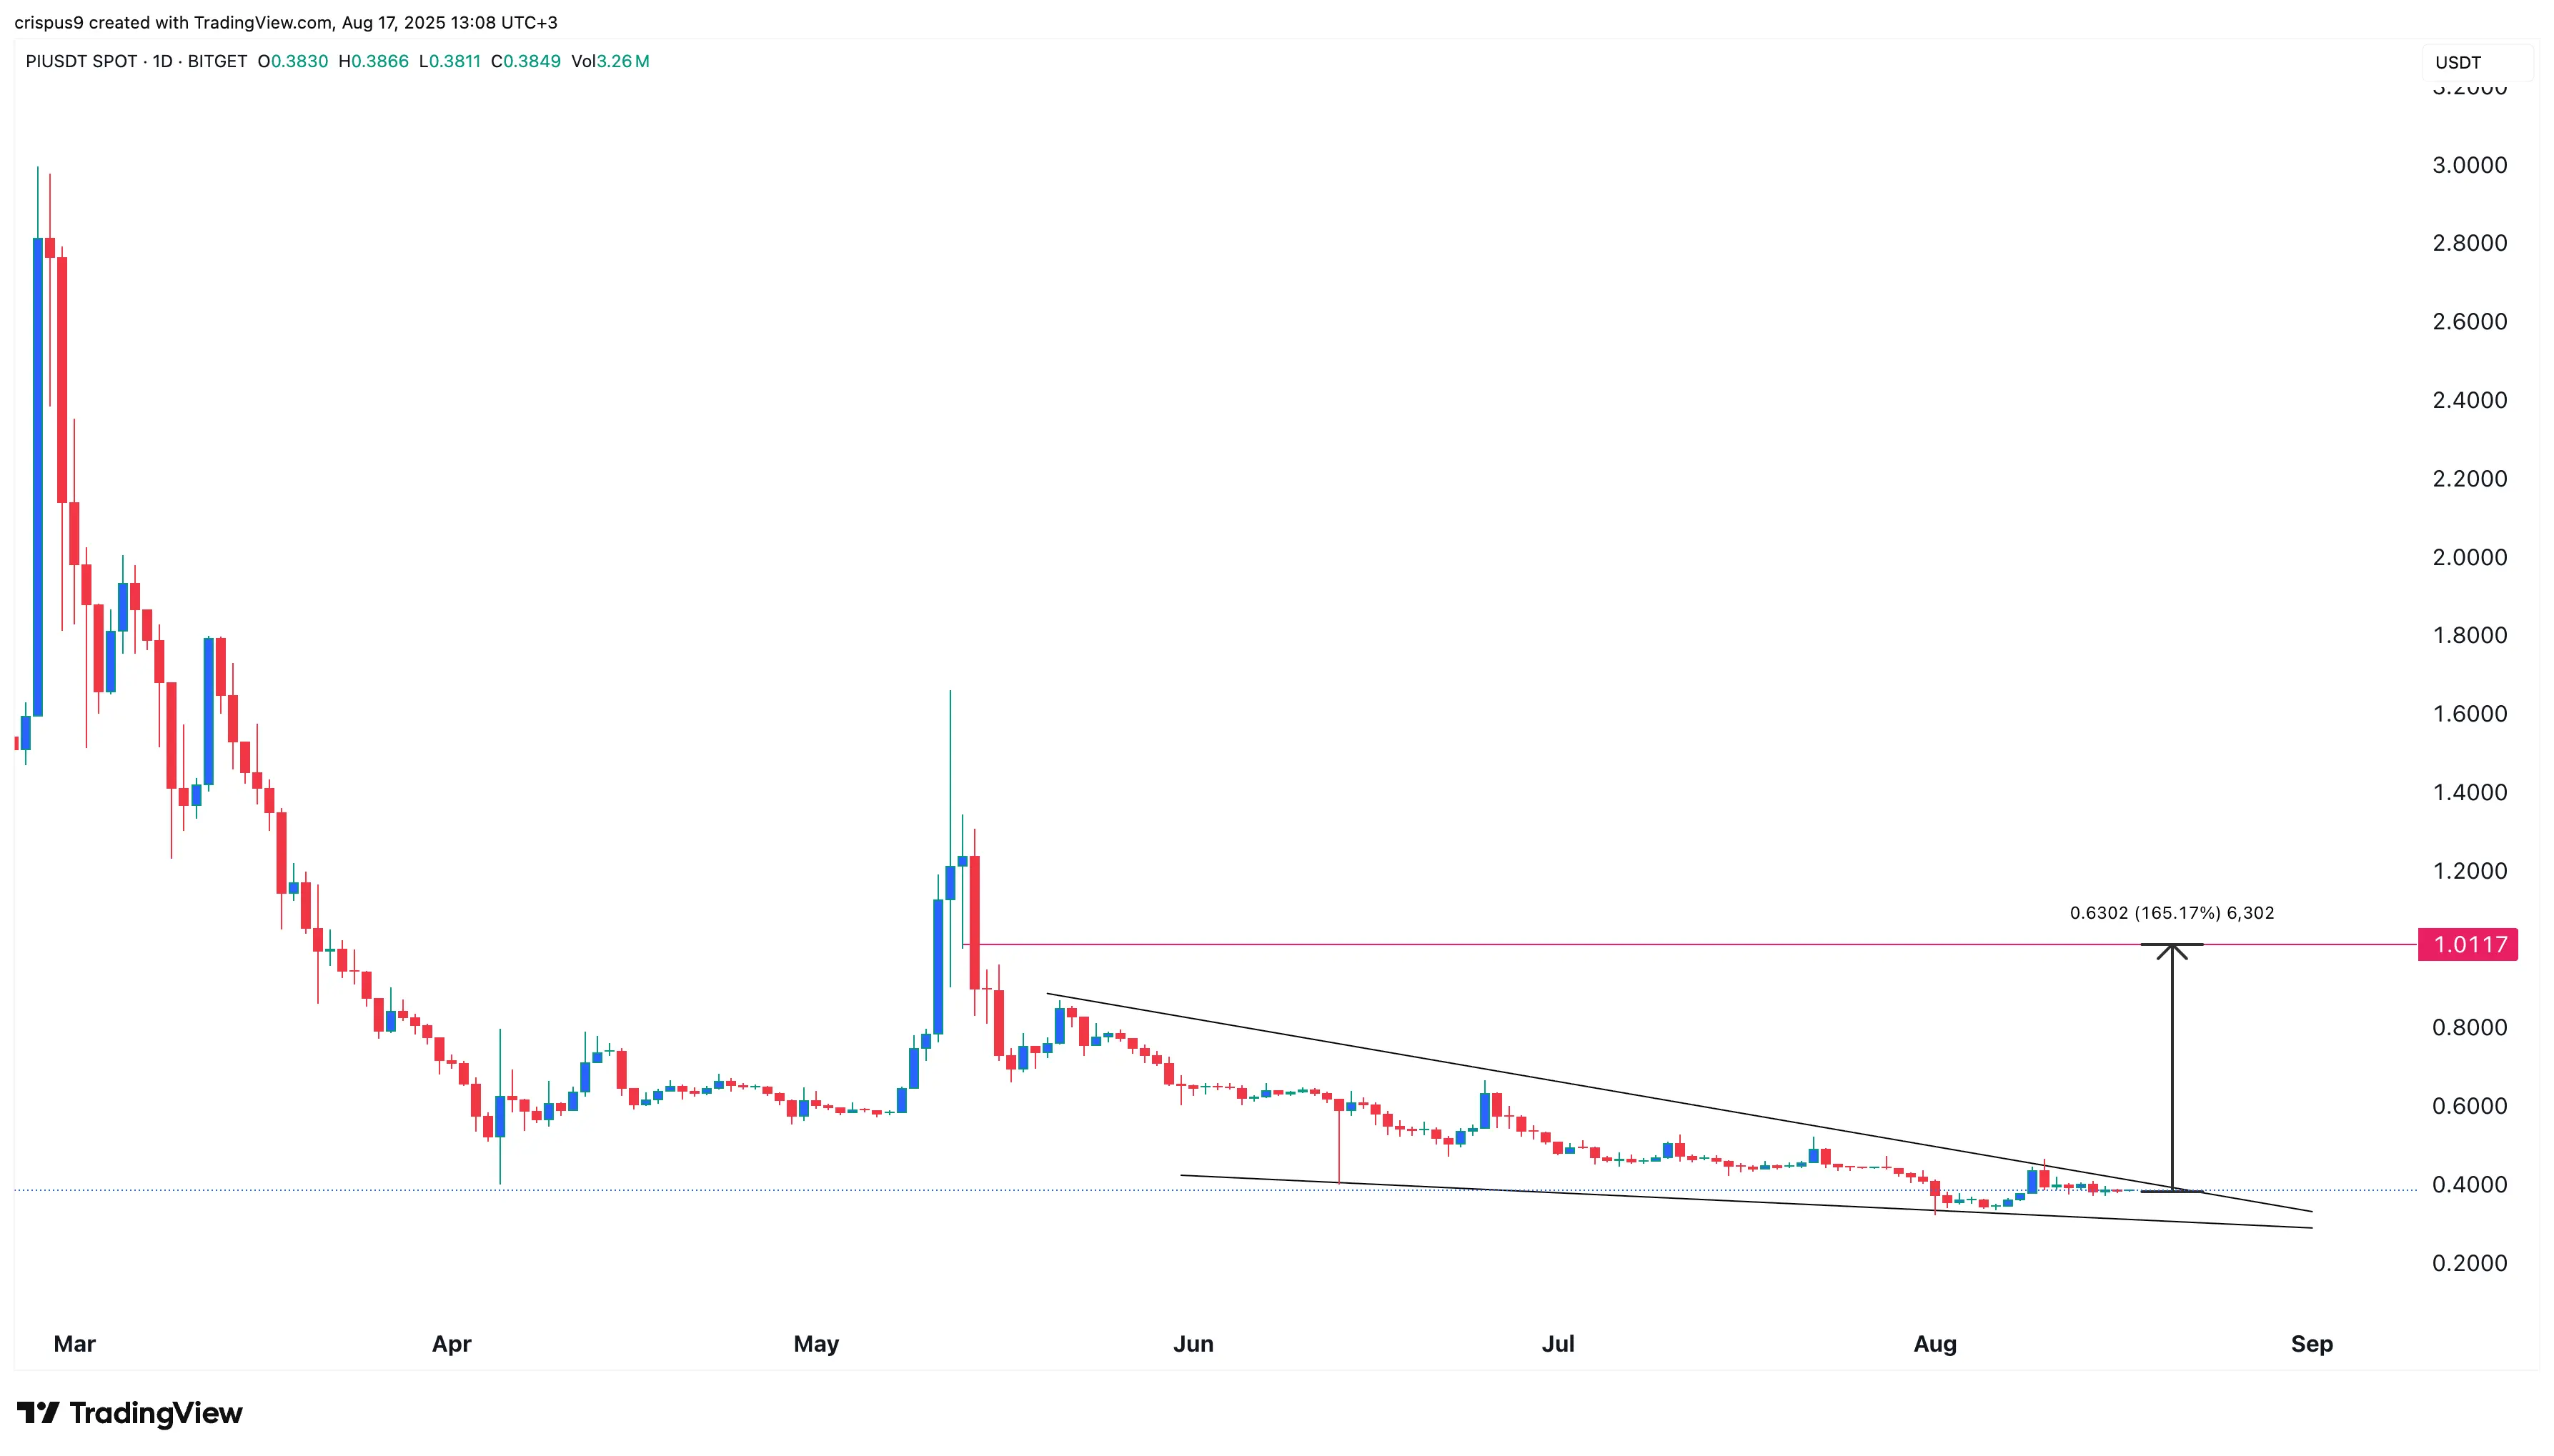
#TopContentChallenge
Pi Network token price stalls — but charts hint at a breakout ahead
Pi Coin has languished at $0.385, a shadow of its $3 peak in February, but technical signals suggest the beaten-down token may be gearing up for a sharp rebound.
Despite fading hype and dwindling volumes, Pi Coin’s chart is flashing signs of strength. A bullish falling wedge pattern and Wyckoff accumulation phase hint at a possible breakout, with bulls eyeing $1 — a 165% gain from current levels. With volatility indicators tightening and potential catalysts such as a Bnb listing on the horizon, Pi may be

[The user has shared his/her trading data. Go to the App to view more.]
- Reward
- 24
- 1
- Repost
- Share
AytacV123:
2025 GOGOGO 👊