被自己帅醒
Trade
Trading Type
Spot
Trade crypto freely
Pre-Market
Trade new tokens before they are officially listed
Margin
Magnify your profit with leverage
Convert & Block Trading
0 Fees
Trade any size with no fees and no slippage
Alpha
Points
Get promising tokens in streamlined on-chain trading
Leveraged Tokens
Get exposure to leveraged positions simply
Futures
Futures
Hundreds of contracts settled in USDT or BTC
Options
HOT
Trade European-style vanilla options
Unified Account
Maximize your capital efficiency
Demo Trading
Futures Kickoff
Get prepared for your futures trading
Futures Events
Participate in events to win generous rewards
Demo Trading
Use virtual funds to experience risk-free trading
Earn
Launch
CandyDrop
Collect candies to earn airdrops
Launchpool
Quick staking, earn potential new tokens
HODLer Airdrop
Hold GT and get massive airdrops for free
Launchpad
Be early to the next big token project
Alpha Points
NEW
Trade on-chain assets and enjoy airdrop rewards!
Futures Points
NEW
Earn futures points and claim airdrop rewards
Investment
Simple Earn
Earn interests with idle tokens
Auto-Invest
Auto-invest on a regular basis
Dual Investment
Buy low and sell high to take profits from price fluctuations
Soft Staking
Earn rewards with flexible staking
Crypto Loan
0 Fees
Pledge one crypto to borrow another
Lending Center
One-stop lending hub
VIP Wealth Hub
Customized wealth management empowers your assets growth
Private Wealth Management
Customized asset management to grow your digital assets
Quant Fund
Top asset management team helps you profit without hassle
Staking
Stake cryptos to earn in PoS products
Smart Leverage
NEW
No forced liquidation before maturity, worry-free leveraged gains
GUSD Minting
Use USDT/USDC to mint GUSD for treasury-level yields
More
Promotions
Activity Center
Join activities and win big cash prizes and exclusive merch
Referral
20 USDT
Earn 40% commission or up to 500 USDT rewards
Announcements
Announcements of new listings, activities, upgrades, etc
Gate Blog
Crypto industry articles
VIP Services
Huge fee discounts
Proof of Reserves
Gate promises 100% proof of reserves
被自己帅醒
No content yet
- Reward
- like
- Comment
- Repost
- Share
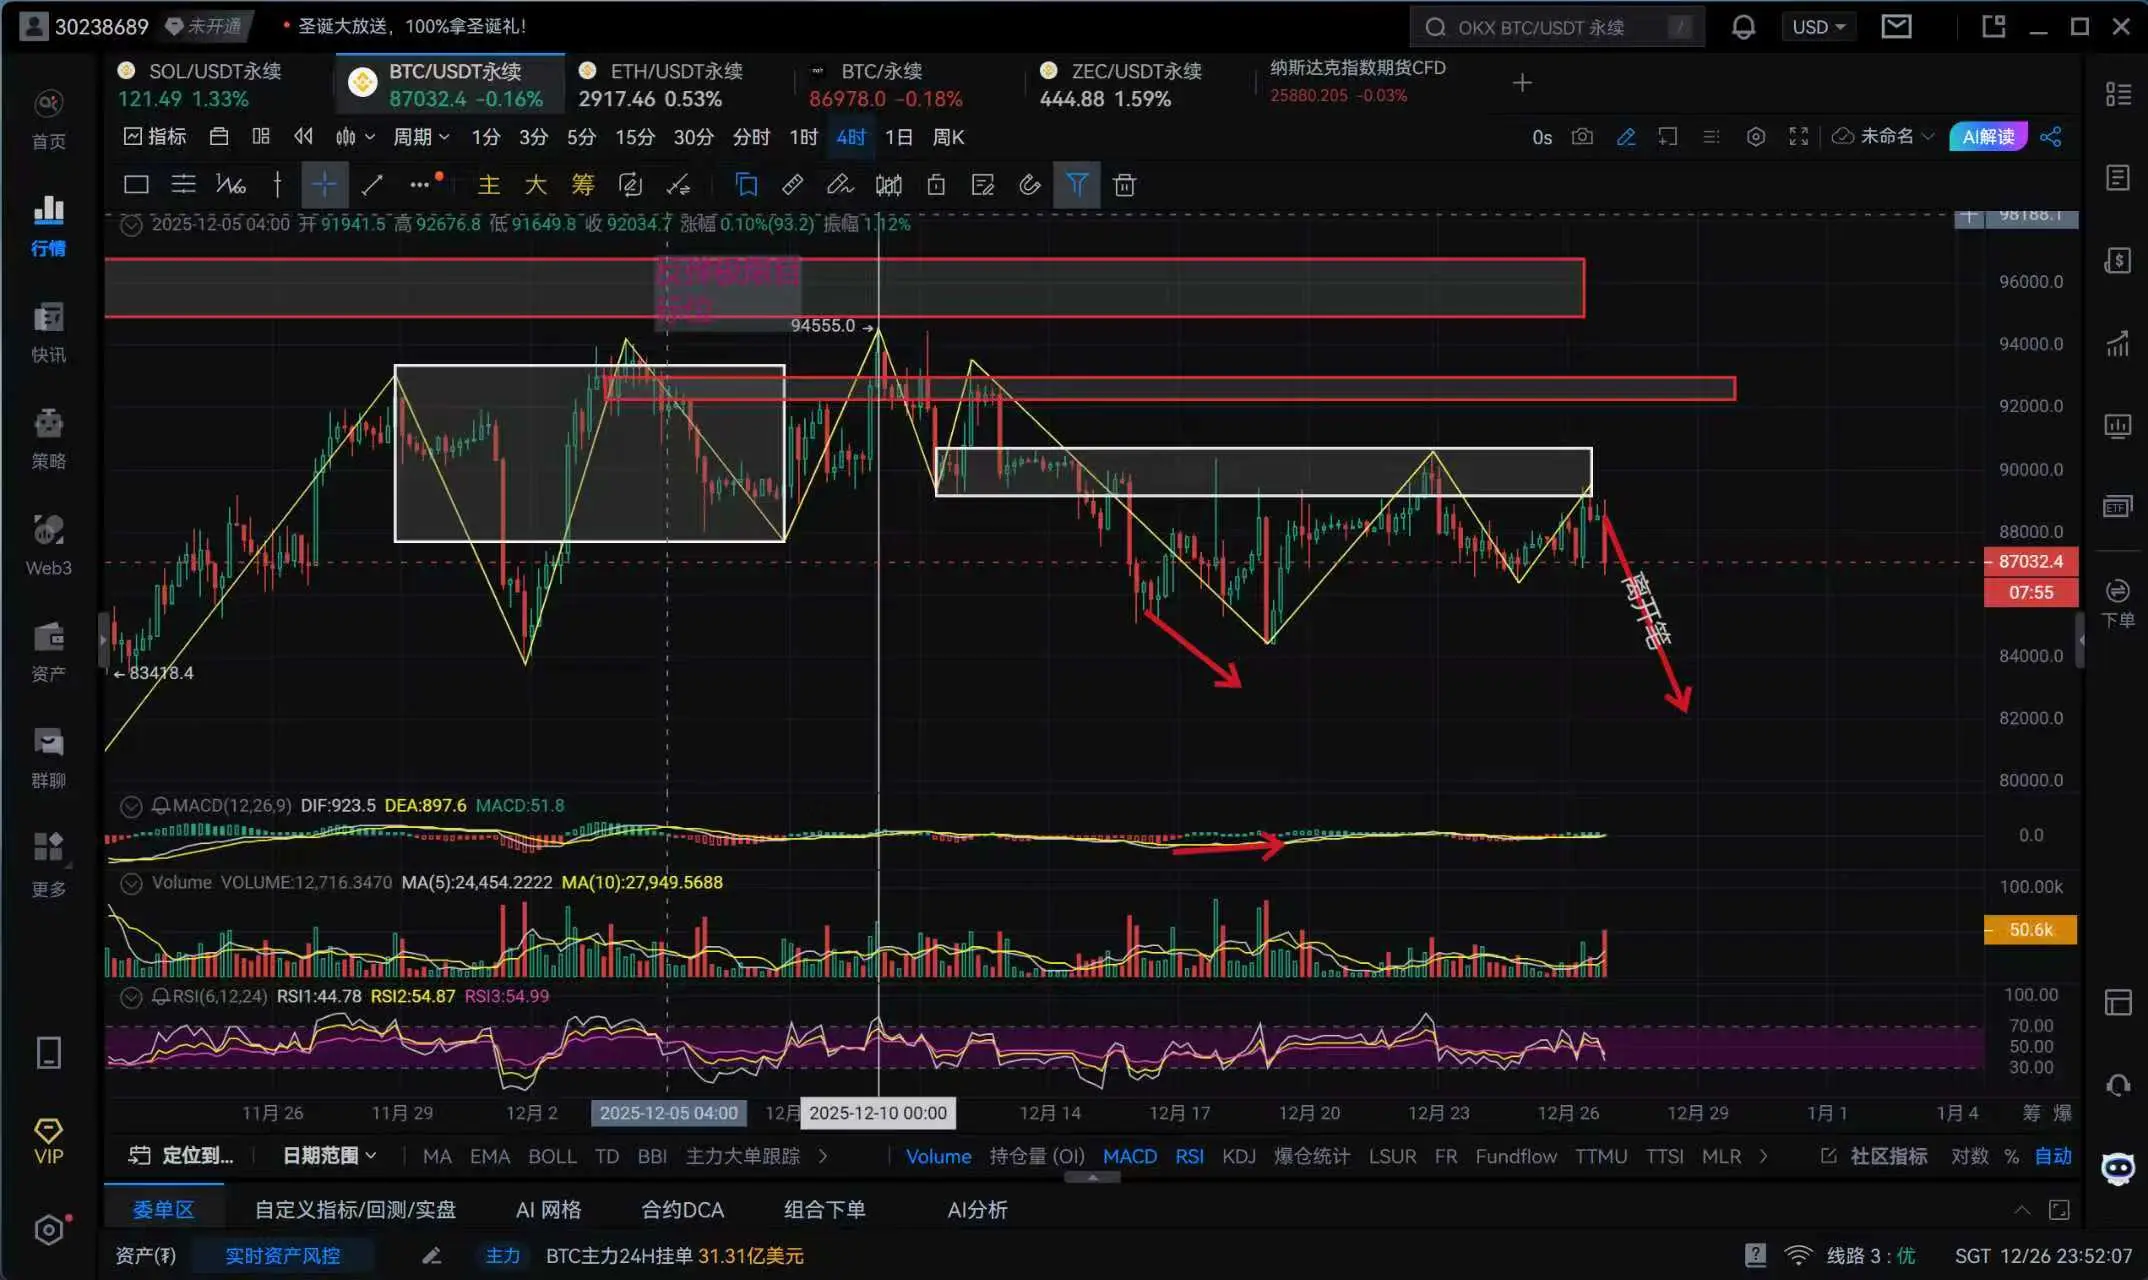
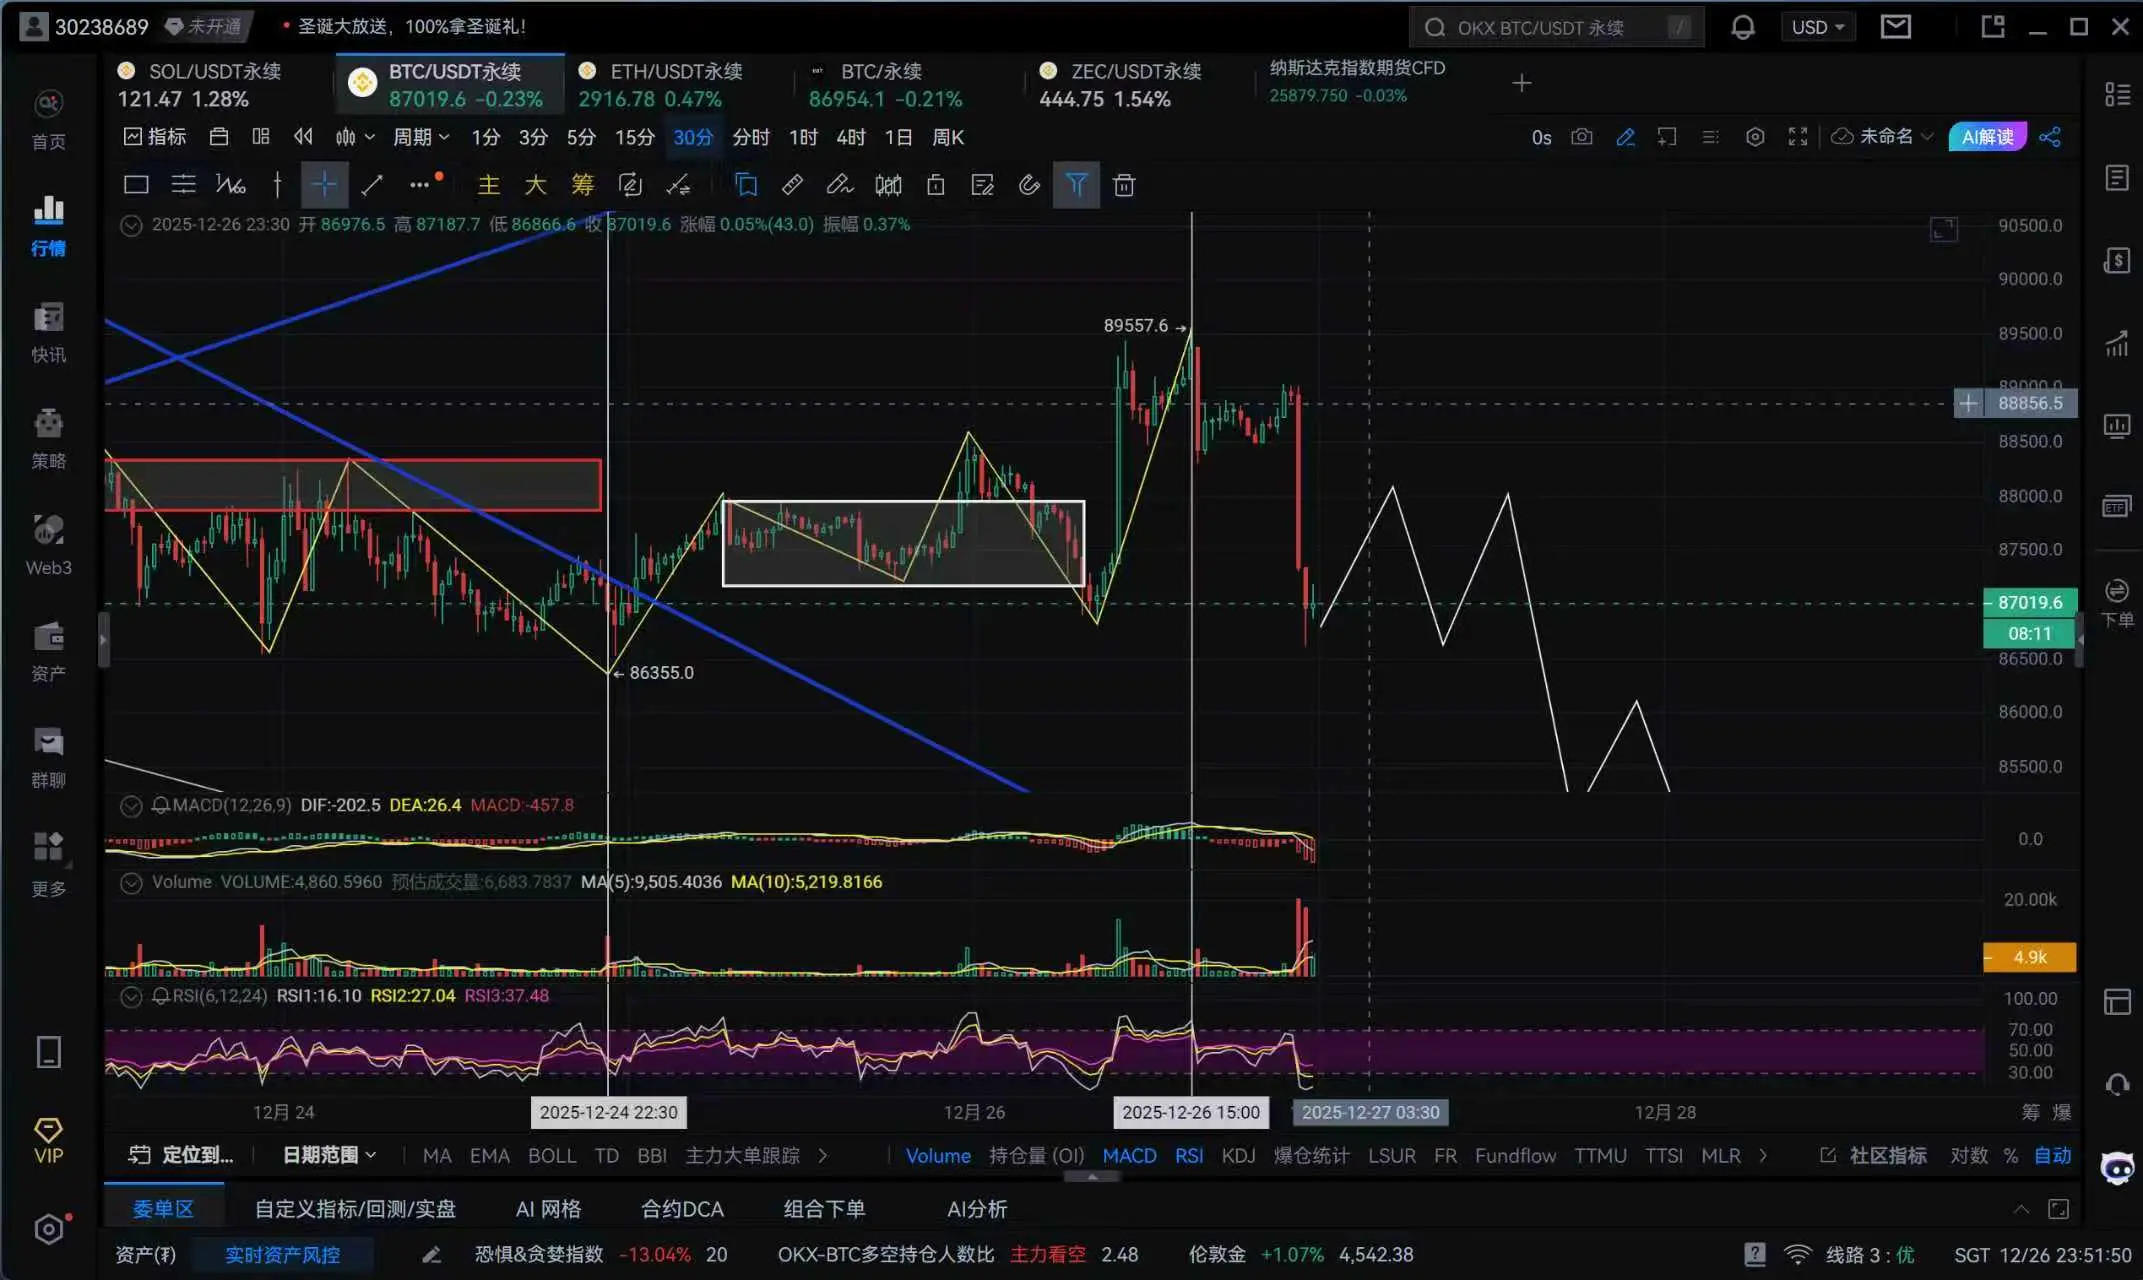
12.27 Market Analysis:
Currently, there is a volume-driven decline on the 4-hour chart. It is estimated to be moving away from the initial point. The 30-minute chart should form a consolidation zone, still within a downward structure.
Personal opinion: The market liquidity is poor right now. Avoid trying to catch the rebound. Currently, institutions are not entering the market, and the prolonged decline is supported by whales. Based on the current situation, 80,000 does not have the conditions for a bottom.
Trading suggestion: Focus on shorting from the high, short at 88,200 for quick gains.
View OriginalCurrently, there is a volume-driven decline on the 4-hour chart. It is estimated to be moving away from the initial point. The 30-minute chart should form a consolidation zone, still within a downward structure.
Personal opinion: The market liquidity is poor right now. Avoid trying to catch the rebound. Currently, institutions are not entering the market, and the prolonged decline is supported by whales. Based on the current situation, 80,000 does not have the conditions for a bottom.
Trading suggestion: Focus on shorting from the high, short at 88,200 for quick gains.
- Reward
- like
- Comment
- Repost
- Share
The market structure remains unchanged, still adopting a short strategy, and recently, going long above 80000 is basically not considered.
View Original- Reward
- like
- Comment
- Repost
- Share
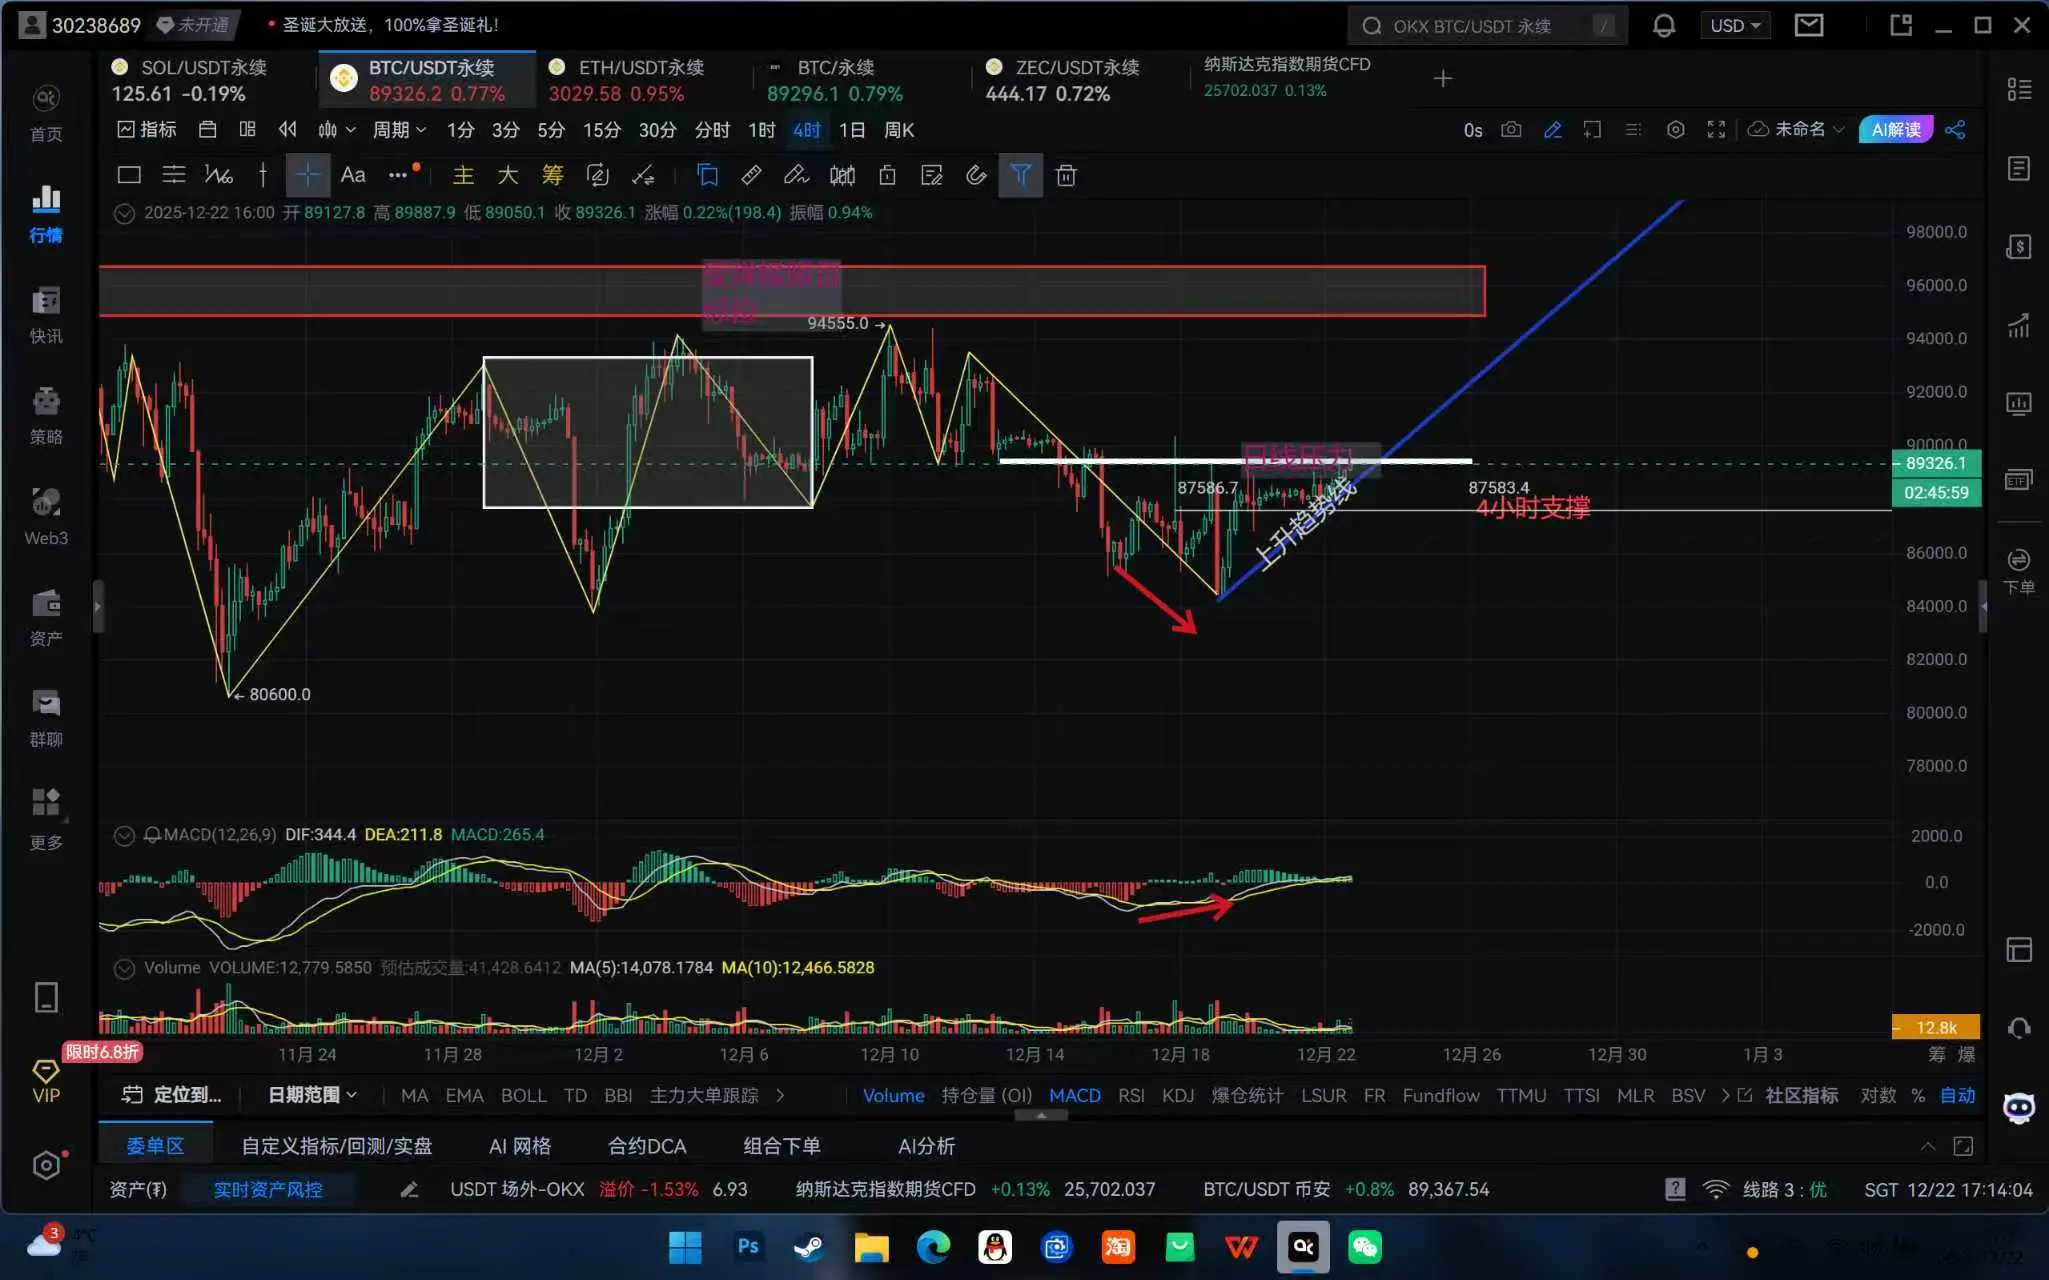
Still maintaining yesterday's view that 80600 is definitely not the bottom.
Currently in a 4-hour rebound, it tested 90300 twice today but failed to break through. We'll see how the U.S. stock market performs tonight. If it breaks through, we can look up to 92600, with the ultimate target around 95000.
If it breaks below 87500 and the upward trend line, it indicates the end of the upward movement in the 4-hour chart.
Additionally, someone asked me yesterday if I provide signals. I want to clarify here that I do not provide signals; I only share my views in the square. If you have sugge
View OriginalCurrently in a 4-hour rebound, it tested 90300 twice today but failed to break through. We'll see how the U.S. stock market performs tonight. If it breaks through, we can look up to 92600, with the ultimate target around 95000.
If it breaks below 87500 and the upward trend line, it indicates the end of the upward movement in the 4-hour chart.
Additionally, someone asked me yesterday if I provide signals. I want to clarify here that I do not provide signals; I only share my views in the square. If you have sugge
- Reward
- like
- Comment
- Repost
- Share
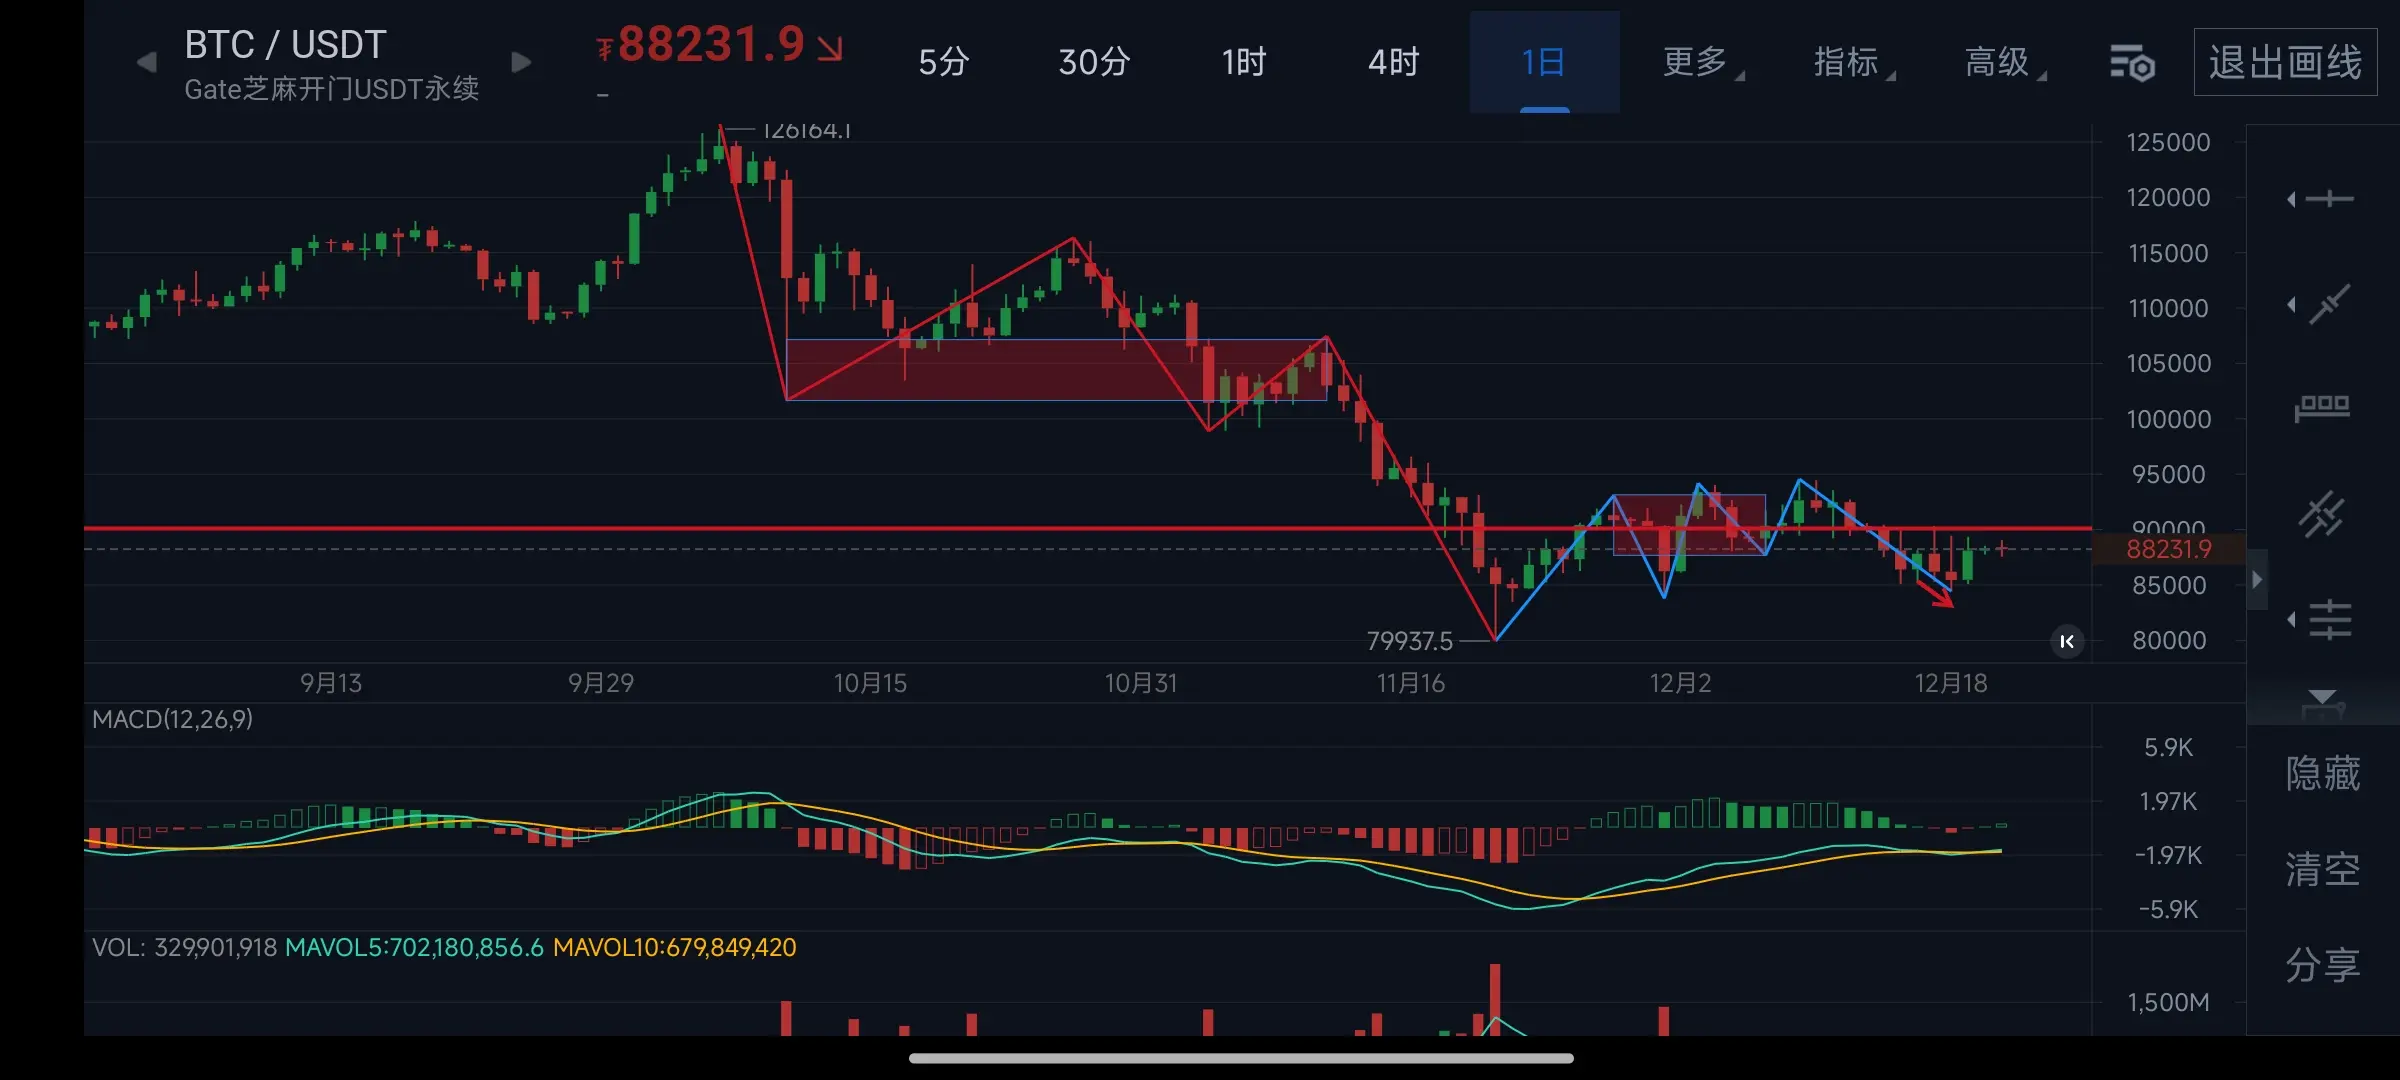
12.22 analysis
Red represents the daily level lines and blue represents the 4-hour level lines.
On the daily chart, the central line has not diverged, so my personal view is that in the long term, one can aim for a daily three sell and look for new lows.
The 4-hour level has shown a divergence with the yellow and white lines, and a MACD golden cross has appeared. It is estimated to move upwards, with key resistance levels at 90300, 92600, and 94500. These points are all positions where a reversal downward could occur, and short positions can be set up at these levels.
Currently, if the market
BTC0,52%
- Reward
- 2
- Comment
- Repost
- Share
Trending Topics
View More19.08K Popularity
49.54K Popularity
59.53K Popularity
91.19K Popularity
4.04K Popularity
Pin