Trade
Basic
Futures
Futures
Hundreds of contracts settled in USDT or BTC
Options
HOT
Trade European-style vanilla options
Unified Account
Maximize your capital efficiency
Demo Trading
Futures Kickoff
Get prepared for your futures trading
Futures Events
Participate in events to win generous rewards
Demo Trading
Use virtual funds to experience risk-free trading
Earn
Launch
CandyDrop
Collect candies to earn airdrops
Launchpool
Quick staking, earn potential new tokens
HODLer Airdrop
Hold GT and get massive airdrops for free
Launchpad
Be early to the next big token project
Alpha Points
NEW
Trade on-chain assets and enjoy airdrop rewards!
Futures Points
NEW
Earn futures points and claim airdrop rewards
Investment
Simple Earn
Earn interests with idle tokens
Auto-Invest
Auto-invest on a regular basis
Dual Investment
Buy low and sell high to take profits from price fluctuations
Soft Staking
Earn rewards with flexible staking
Crypto Loan
0 Fees
Pledge one crypto to borrow another
Lending Center
One-stop lending hub
VIP Wealth Hub
Customized wealth management empowers your assets growth
Private Wealth Management
Customized asset management to grow your digital assets
Quant Fund
Top asset management team helps you profit without hassle
Staking
Stake cryptos to earn in PoS products
Smart Leverage
NEW
No forced liquidation before maturity, worry-free leveraged gains
GUSD Minting
Use USDT/USDC to mint GUSD for treasury-level yields
More
HuXijin
No content yet
HuXijin
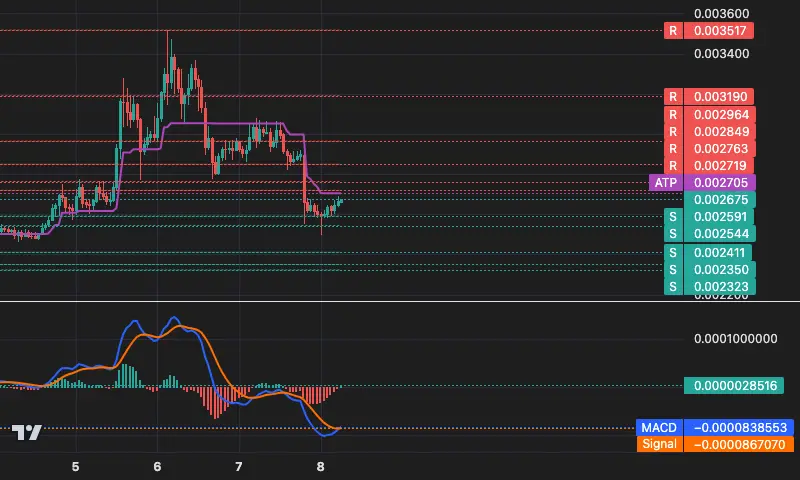
📊 PTB 1h Technical Overview
💰 Current Price: 0.002675 (-4.70%)
📈 Trend: Oscillating correction in a bearish trend | 37K candles have been processed
🎯 Tracking Line: 0.002705 (Dynamic stop-loss reference / Key resistance!)
Key Levels:
Support 0.002544 / 0.002591 / 0.002350
Resistance 0.002705🔥 / 0.002763 / 0.002849
Strategy: The price is still suppressed by the trend line; a rebound near this line is a key point to watch for potential profit-taking.
Risk: A significant MACD rebound suggests that if the price firmly stays above 0.002705, it could trigger a larger rebound or even a phase rev
PTB-4,56%
- Reward
- like
- Comment
- Repost
- Share
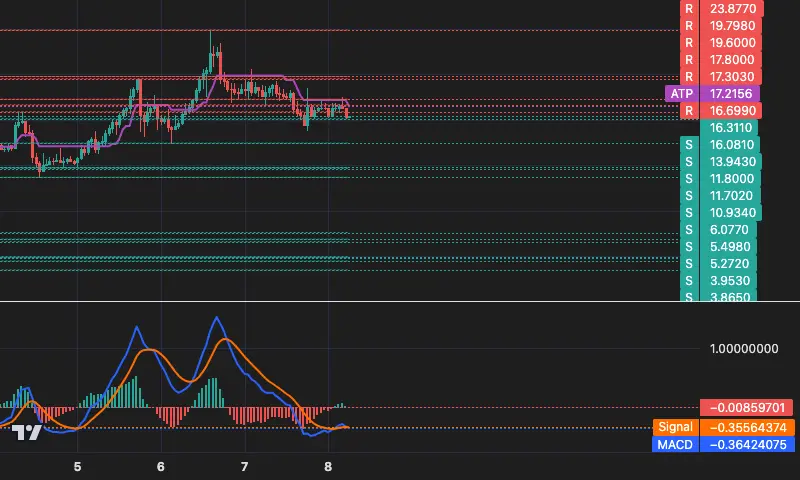
📊 RIVER 1h Technical Overview
💰 Current Price: 16.311 ( Down 9.31% from trend start )
📈 Trend: 🔥 Bearish trend continues to accelerate | 18K candles have been formed
🎯 Tracking Line: 17.216 ( Dynamic stop-loss reference )
Key Levels:
Support 16.081 / 13.943 / 11.800
Resistance 16.699 / 17.303 / 17.800
Strategy: The price is testing the first resistance at 16.699, with the upward trendline at 17.216 acting as a strong resistance. The bearish trend is evident; any rebound near the 17.2 area presents a potential high short opportunity✈️.
Risk: If the price surges strongly and stabilizes abo
View Original
- Reward
- like
- Comment
- Repost
- Share
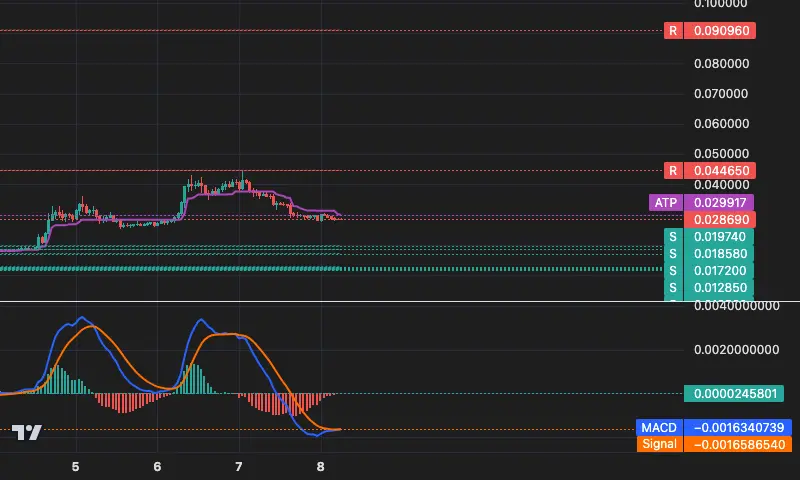
📊 BROCCOLI714 1h Technical Overview
💰 Current Price: 0.02869 (-15.32%)
📈 Trend: Bearish trend continues & potential acceleration?⚠️ | 19K candles have been processed
🎯 Tracking Line: 0.02992 (Dynamic stop-loss reference)
Key Levels:
Support 0.01974 / 0.01858 / 0.01720 🔥
Resistance 0.04465
Strategy: The price is firmly suppressed by the trend line, and all rebounds have not touched this line. Rebounds near the tracking line 0.02992 remain an ideal short entry zone, with stop-loss set above this line.
Risk: If the price strongly breaks through and stabilizes above 0.02992, it may indicate
View Original💰 Current Price: 0.02869 (-15.32%)
📈 Trend: Bearish trend continues & potential acceleration?⚠️ | 19K candles have been processed
🎯 Tracking Line: 0.02992 (Dynamic stop-loss reference)
Key Levels:
Support 0.01974 / 0.01858 / 0.01720 🔥
Resistance 0.04465
Strategy: The price is firmly suppressed by the trend line, and all rebounds have not touched this line. Rebounds near the tracking line 0.02992 remain an ideal short entry zone, with stop-loss set above this line.
Risk: If the price strongly breaks through and stabilizes above 0.02992, it may indicate
- Reward
- like
- Comment
- Repost
- Share
The US Treasury Secretary's latest statement reveals the bottom line! 🇺🇸
Bessent personally confirms: the United States now has a "Bitcoin strategic reserve." Where does this reserve come from? Seized assets, not purchased new coins, but they are also firmly not selling.
What does this signal mean? Seized coins are kept frozen for the long term, effectively removing a portion of BTC from circulation by the government. Is a new story about supply coming? 🤔
BTC-0,35%

- Reward
- like
- Comment
- Repost
- Share
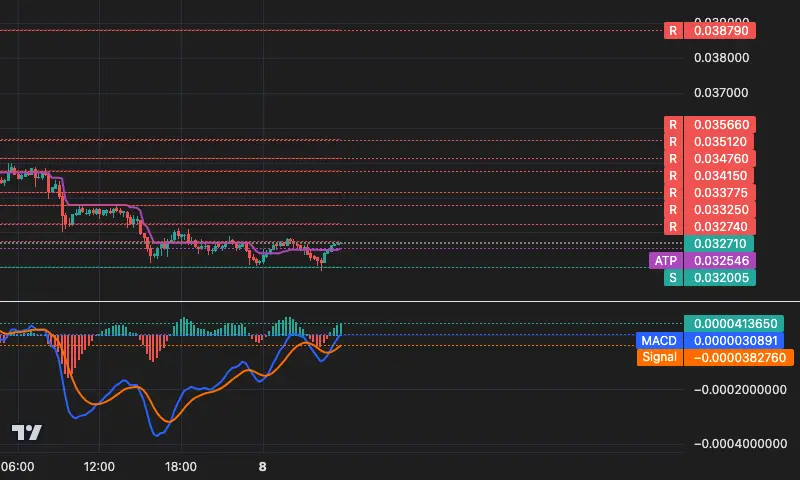
📊 BTR 15m Technical Overview
💰 Current Price: 0.03271 (Sideways)
📈 Trend: Bullish trend initiated | 1K candles in operation
🎯 Tracking Line: 0.03255 (Dynamic Stop Loss Reference)
Key Level: Resistance 0.03274 (Just Around the Corner!) / 0.03325
Strategy: The price is closely following the trend line and has just started, but there is strong resistance at 0.03274🚀! Whether it can break through will determine the fate of this trend. Aggressive traders can try long positions with small size at the current price, strictly using 0.03255 as the stop loss.
Risk: The first candle shows almost no
BTR-1,23%
- Reward
- like
- Comment
- Repost
- Share
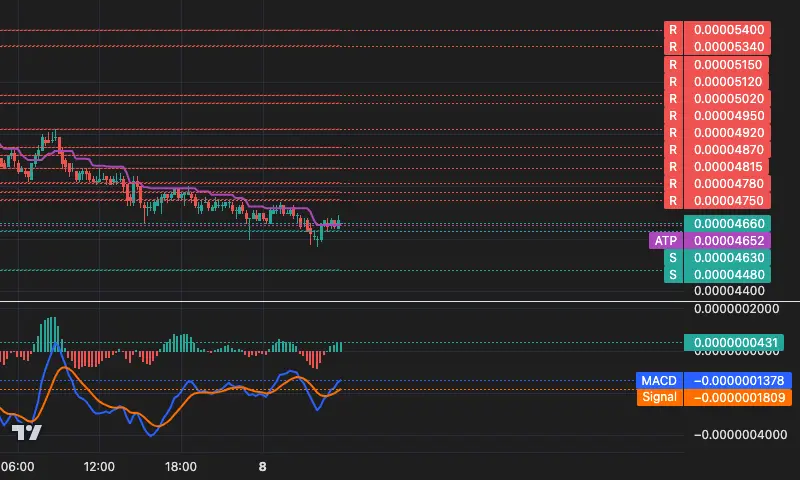
📊 DOGS 15min Technical Overview
💰 Current Price: 0.0000466 (-3.52% Within Trend )
📈 Trend: Bearish trend continues | 78 K-lines have been formed
🎯 Tracking Line: 0.000047 ( Dynamic Stop Loss Reference )
Key Levels:
Support 0.000046 / 0.000045
Resistance 0.000048 / 0.000049
Strategy: Price is suppressed below the trend line, mainly bearish. The area around 0.000048 above is a dense resistance zone, which is an area to observe for shorting opportunities.
Risk: Be alert for the price stabilizing and breaking through the 0.000047 trend line, which may indicate the exhaustion of the bearish tr
DOGS-3,76%
- Reward
- like
- Comment
- Repost
- Share
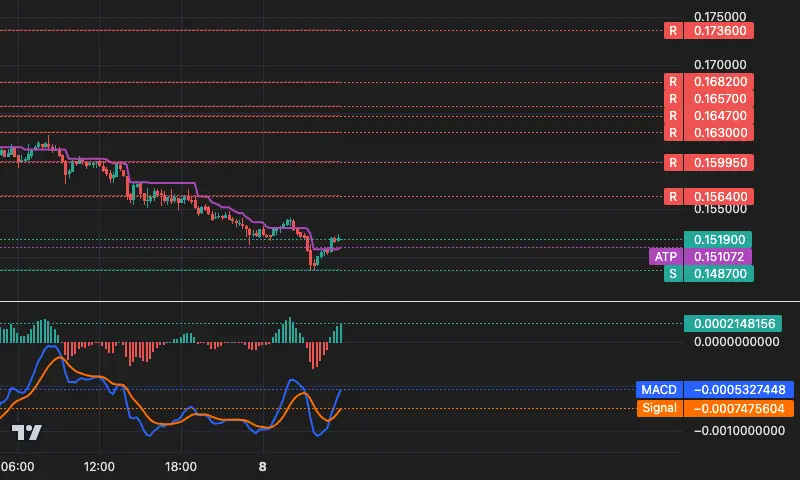
📊 EDU 15m Technical Overview
💰 Current Price: 0.1519 ( Self-starting price sideways )
📈 Trend: Suspected trend reversal (initial bullish breakout) | 1K candles in operation
🎯 Tracking Line: 0.1511 ( Dynamic stop-loss reference )
Key levels:
Support 0.1487
Resistance 0.1564 / 0.1599 / 0.1630
Strategy: The price has initially turned bullish at 0.1519. You can set a stop-loss along the tracking line and try a small long position. The first target above is 0.1564; a breakout could signal higher gains.
Risk: Breakouts are very fragile initially; beware of false breakouts! MACD weekly shows cont
EDU-2,68%
- Reward
- like
- Comment
- Repost
- Share
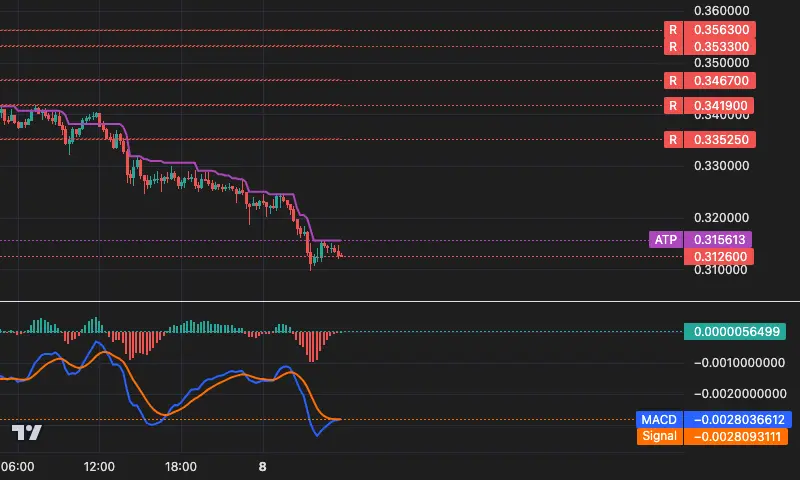
📊 $AVNT 15-Minute Technical Overview
💰 Current Price: 0.3126 ( Trend Initiation -8.78%)
📈 Trend: Bearish trend continues but with warning signals! | 116 K-lines have been run
🎯 Tracking Line: 0.3156 (Dynamic Resistance/Stop-Loss Reference)
Key Levels:
Support: Current Price / 0.3099 (Previous Low)
Resistance: 0.3156 / 0.3352 / 0.3419
Strategy: MACD shows strong bullish divergence! But the price is still below all key levels. Is this a bold **bull trap** or a death charge? For those looking to gamble on a reversal, consider small long positions at the current price with strict adherence to
AVNT-5,91%
- Reward
- like
- Comment
- Repost
- Share
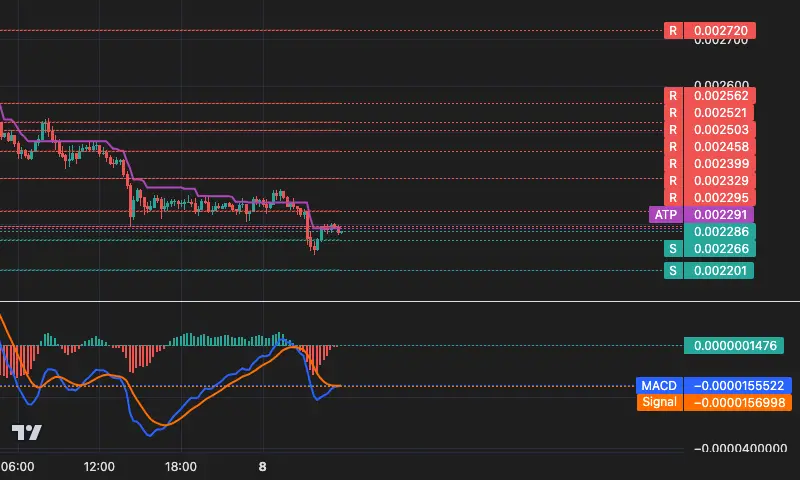
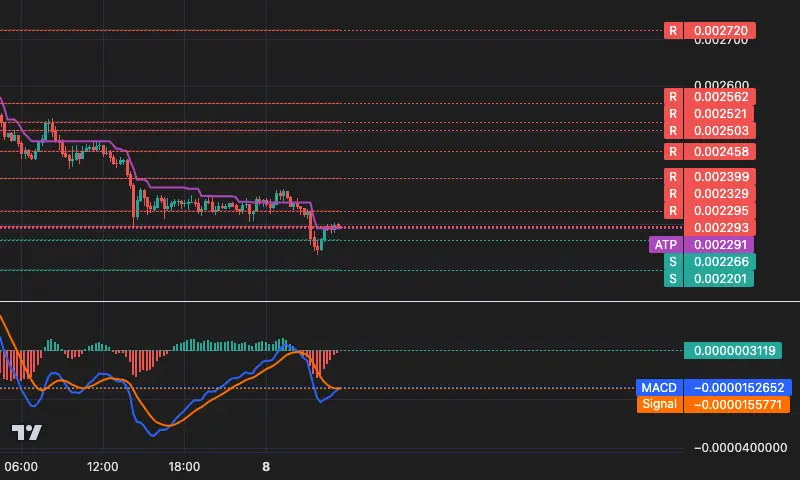
📊 PUMP 15m Technical Overview
💰 Current Price: 0.002286 ( -8.19% within the trend )
📈 Trend: Bearish trend stagnation | 100 K-lines have been run
🎯 Tracking Line: 0.002291 ( Dynamic resistance / breakout stop-loss reference )
Key levels:
Support 0.002266 / 0.002201 💀
Resistance 0.002295 / 0.002328 / 0.002399
Strategy: Price is teetering along the downward trend line! Holding the support below may allow for a short-term rebound, but any signs of breaking below 0.002266 are 🚨 dangerous signals!
Risk: If the critical support at 0.002201 is lost, the decline may accelerate. Currently on the
PUMP-7,19%
- Reward
- like
- Comment
- Repost
- Share
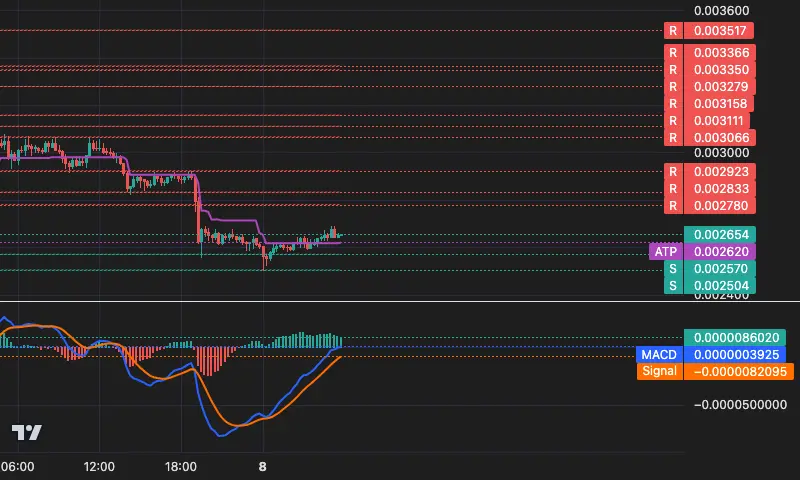
📊 PTB 15m Technical Overview
💰 Current Price: 0.002654 (0.00%)
📈 Trend: Bullish trend initiated | 1K candles elapsed
🎯 Tracking Line: 0.002620 ( Dynamic Stop-Loss Reference )
Key Levels:
Support 0.002570 / 0.002504
Resistance 0.002780 / 0.002833
Strategy: The trend has just been established. Enter at the current price with a stop-loss below 0.002620 to target a breakout. 🚀
Risk: Beware of false signals! MACD double-cycle momentum is significantly decreasing, with the first resistance at 0.002780 looming ahead. ⚠️
PTB-4,56%
- Reward
- like
- Comment
- Repost
- Share
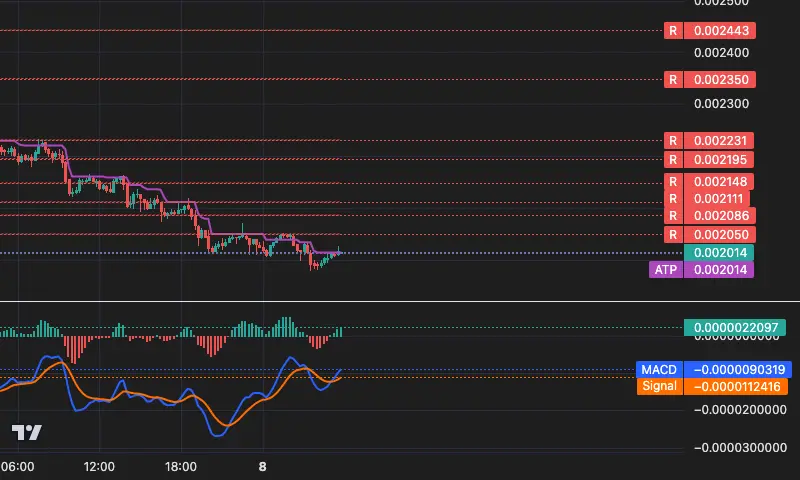
📊 JCT 15m Technical Overview
💰 Current Price: 0.002014 ( -10.17%)
📈 Trend: Bearish trend continues 🐻 | 117 K-lines have been formed
🎯 Dynamic Stop-Loss Line: 0.002014 ( Price is touching this line! )
Key Levels:
Support 0.001980 ( Previous low ) / -
Resistance 0.002050 / 0.002086 / 0.002111
Strategy: The price is testing the dynamic stop-loss line of the downtrend, which is a critical watershed for bulls and bears! Holding above this line could allow for a short-term rebound, targeting resistance levels above. Once a break below is confirmed, the bearish momentum may accelerate.
Risk: The
View Original
- Reward
- like
- Comment
- Repost
- Share
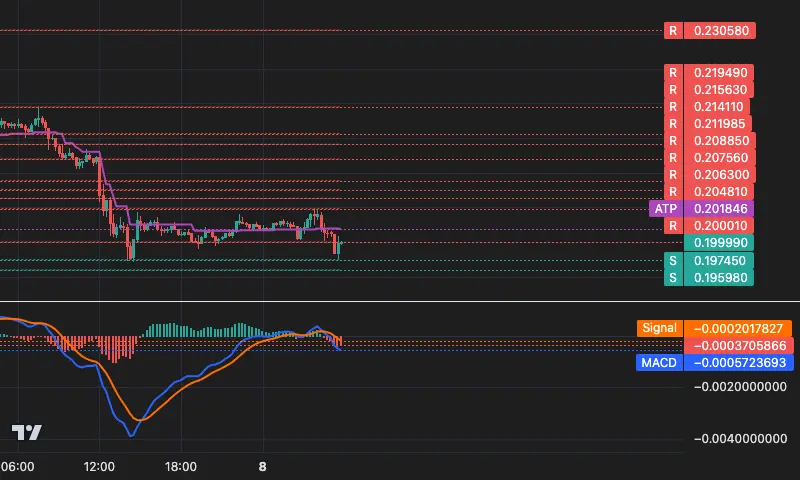
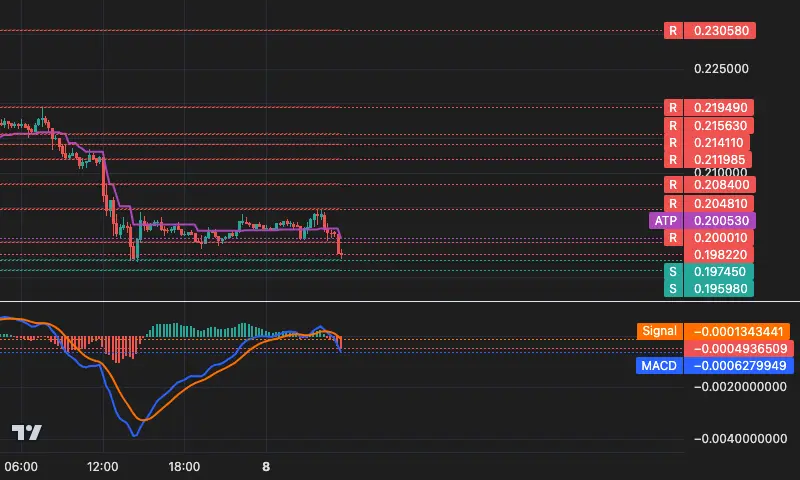
📊 KGEN 15m Technical Overview
💰 Current Price: 0.19999 ( Neutral ⚖️)
📈 Trend: Bearish trend continues 🚨 | Just started 0K candle
🎯 Tracking Line: 0.20185 ( Dynamic Stop Loss Reference )
Key Levels:
Support 0.19598 / 0.19745
Resistance 0.20001 / 0.20481 / 0.20630
Strategy: If the current price is near or rebounds to the 0.200xx resistance, go short 👆, with strict stop loss above the tracking line at 0.20185! 🔻
Risk: If the price breaks above 0.20001 and stabilizes, the bearish pattern may be broken, beware of a quick rebound risk! 🔥
KGEN-0,1%
- Reward
- like
- Comment
- Repost
- Share
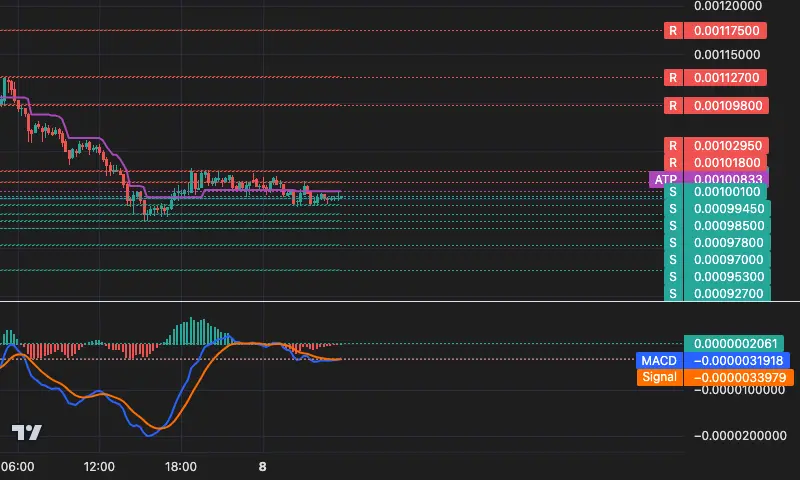
📊 B3 15m Technical Overview
💰 Current Price: 0.001003 ( Compared to the starting price, up 0.50%📉 Rebounding)
📈 Trend: Suspected trend reversal🔥 | 13K candles have been run
🎯 Tracking Line: 0.001008 ( Dynamic resistance/support reference)
Key levels:
Support 0.001001 / 0.000994 / 0.000985
Resistance 0.001018 / 0.001030 / 0.001098
Strategy: MACD surging 18%, if breaking through 0.001018 resistance, go long; aggressive traders can try a small position at the current price, target 0.001030!
Risk: Trendline resistance not broken, beware of falling below 0.001001 support and r
B3-3,53%
- Reward
- like
- Comment
- Repost
- Share
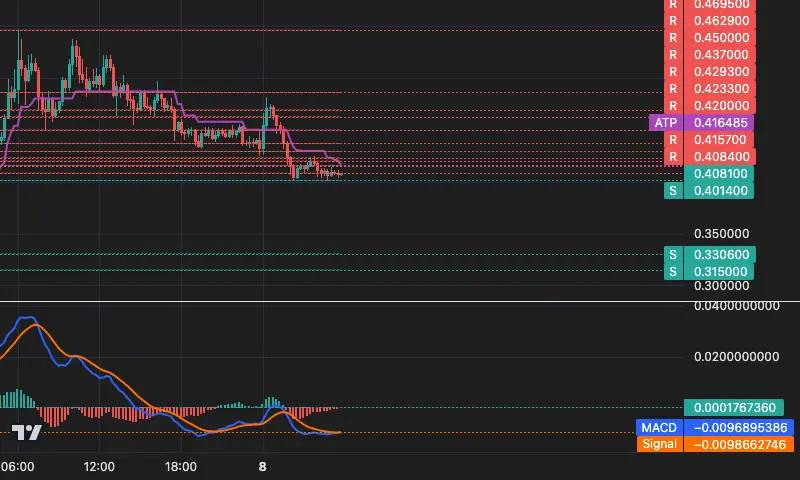
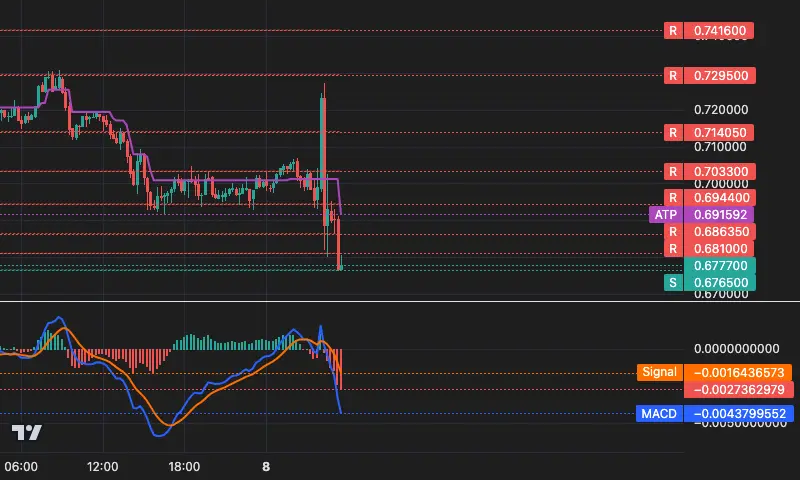
📊 BREV 15-Minute Technical Overview
💰 Current Price: 0.4081 (-10.90%)
📈 Trend: Bearish trend continues | 48K candles have been processed
🎯 Tracking Line: 0.4165 ( Dynamic Stop Loss Reference )
Key Levels:
Support 0.4014 / 0.3306 / 0.3150
Resistance 0.4084 / 0.4157 / 0.4200
Strategy: The price is still below the trend line 🚨. Short at high points around 0.4084-0.4157, stop-loss set above 0.4170, aiming to catch the downward move!
Risk: MACD histogram is positive, beware of a rebound breaking through 0.4165 which could quickly reverse to 0.4500🔥
BREV-14,71%
- Reward
- like
- Comment
- Repost
- Share
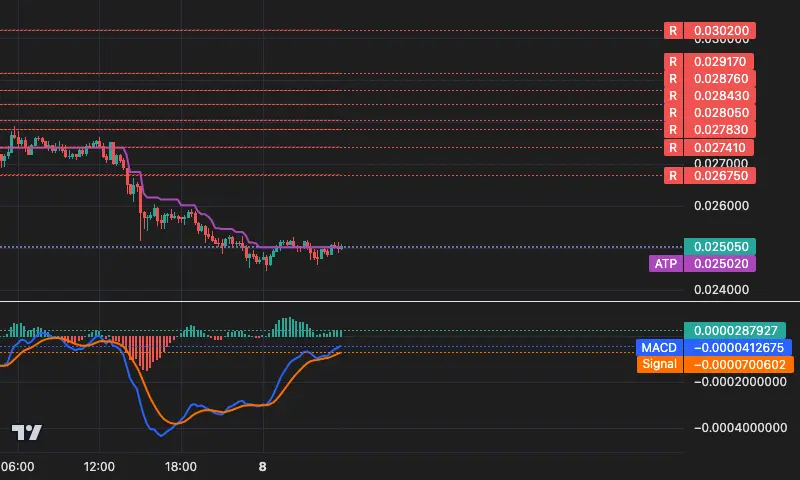
📊 ACT 15m Technical Overview
💰 Current Price: 0.02505 ( -8.81%)
📈 Trend: Bearish trend stagnation | 117K candles elapsed
🎯 Tracking Line: 0.02502 ( Dynamic Stop Loss Reference )
Key Levels:
Support 0.02502 / 0.02448 / -
Resistance 0.02675 / 0.02741 / 0.02783
Strategy: Bears closely monitor the stop loss line; a break below can add to positions; Bulls patiently wait for a breakout confirmation before acting! 🚨
Risk: Price stubbornly follows the tracking line, MACD momentum plummets, signaling an imminent trend reversal, with extreme volatility! 💥
ACT-0,23%
- Reward
- like
- Comment
- Repost
- Share
Matrixport Major Signal: BTC Spot ETF Capital Inflows in 2026 May Make a Comeback🔥The latest report breaks down the data: +3.4 billion in 2024, +2.2 billion in 2025, continuous buying has become the fundamental support for BTC prices. Last year's capital flow growth rate once surpassed that of 2024📈The current consolidation is just a 'cyclical breather,' and institutions may return even more strongly next year. The long-term narrative remains resilient🚀
BTC-0,35%

- Reward
- like
- Comment
- Repost
- Share
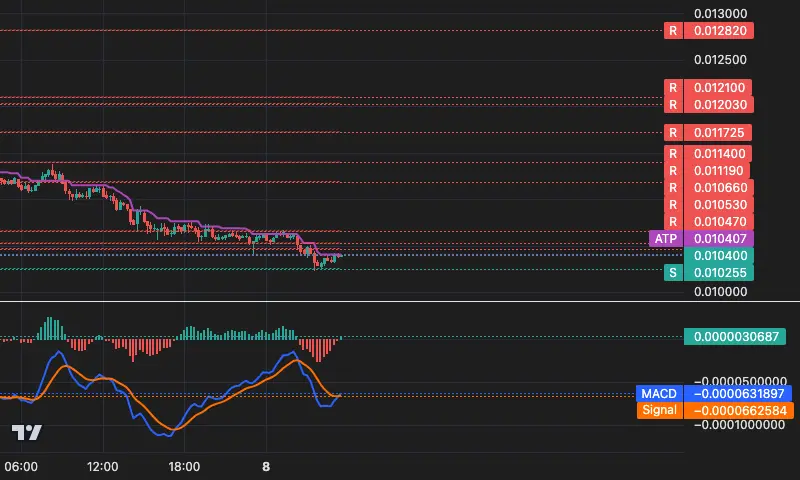
📊 ATH 15-Minute Quick Overview
💰 Current Price: 0.0104 ( -8.77% from Trend Start Point )
📈 Trend: Bearish trend stagnation @E3️ | 116 K-line periods elapsed
🎯 Tracking Line: 0.0104 ( Dynamic Stop-Loss Reference Level )
Key Levels:
Support 0.0103
Resistance 0.0105 / 0.0107 / 0.0112
Strategy: Price closely follows the downward trend line. Although MACD shows a rebound, overall pressure remains. It is not advisable to aggressively short here. If the rebound cannot hold above 0.0105, the trend may continue. 🛑 A break below 0.0103 support warns of accelerated decline.
Risk: Currently at a crit
View Original💰 Current Price: 0.0104 ( -8.77% from Trend Start Point )
📈 Trend: Bearish trend stagnation @E3️ | 116 K-line periods elapsed
🎯 Tracking Line: 0.0104 ( Dynamic Stop-Loss Reference Level )
Key Levels:
Support 0.0103
Resistance 0.0105 / 0.0107 / 0.0112
Strategy: Price closely follows the downward trend line. Although MACD shows a rebound, overall pressure remains. It is not advisable to aggressively short here. If the rebound cannot hold above 0.0105, the trend may continue. 🛑 A break below 0.0103 support warns of accelerated decline.
Risk: Currently at a crit
- Reward
- like
- Comment
- Repost
- Share
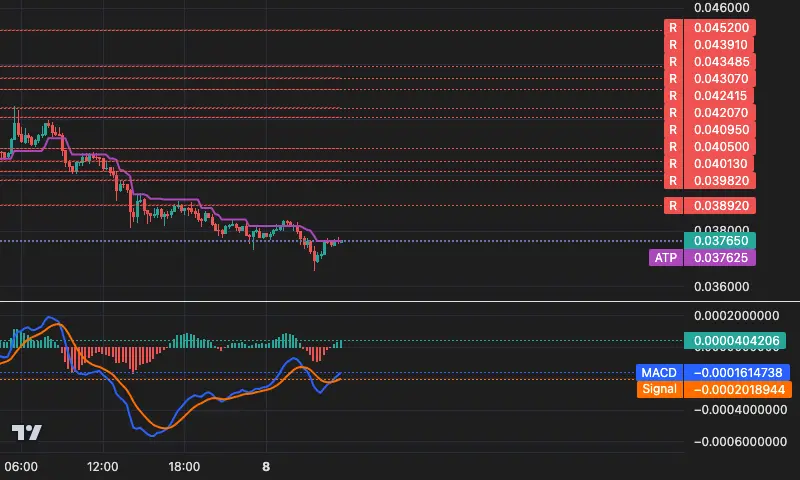
📊 AIXBT 15m Technical Overview
💰 Current Price: 0.03765 ( -6.62%)
📈 Trend: Bearish trend continues, closely following the defense line | 80 K-lines have been run 🎯 Tracking line: 0.03762 ( Dynamic stop-loss reference, price has already touched! )
Key levels:
Support: No clear support
Resistance: 0.03892 / 0.03982 / 0.04013
Strategy: The price is firmly pressing against the downtrend line and rebounding, indicating a tentative bullish counterattack! Stay above 0.03762 to lightly attempt a rebound, targeting the resistance zone at 0.0389.
Risk: If the defense line breaks, there may be an acc
AIXBT-4,73%
- Reward
- like
- Comment
- Repost
- Share
📊 KGEN 15m Technical Overview
💰 Current Price: 0.19822
📈 Trend: Bearish trend continues | 1K candles have been formed
🎯 Tracking Line: 0.20053 ( Dynamic Stop Loss Reference )
Key Levels:
Support 0.19745 / 0.19598
Resistance 0.20001 / 0.20481
Strategy: Price stays just below the downward trend line, and after the MACD death cross, momentum is significantly bearish. Watch for a rebound towards the 0.20053 trend line; if it fails to break above, it presents a shorting opportunity, with the trend line as the stop loss.
Risk: If the price strongly breaks through 0.20053, the bearish trend may
KGEN-0,1%
- Reward
- like
- Comment
- Repost
- Share
📊 PUMP 15-Minute Technical Overview
💰 Current Price: 0.002293 ( -7.91%)
📈 Trend: Bearish trend continues, but hanging by a thread!🔥 | 99 K-lines have been run
🎯 Tracking Line: 0.002291 ( Dynamic resistance/support reference )
Key levels:
Support 0.002266 / 0.002201
Resistance 0.002295⚔️ / 0.002328 / 0.002399
Strategy: The price is currently hugging the lower edge of the trailing stop line! Do not break, only then can the trend be confirmed. A strong breakout above 0.002295 and stabilization could loosen the bearish pattern. Otherwise, a failed rebound is an opportunity for short positions
PUMP-7,19%
- Reward
- like
- Comment
- Repost
- Share