G-Dragon

vip
Age 0.3 Yıl
Peak Tier 0
No content yet
January 7, 2026
The current 4-hour chart is in a pullback phase after an upward move. If the upward momentum does not stabilize, the 4-hour MA5 will continue to decline. The Bollinger Bands are opening, with the upper band trending upward, the middle band rising, and the lower band rising. The three lines are all trending upward.
The three lines correspond to prices 141, 136, and 132.
On the 4-hour timeframe, the bearish volume is weakening, indicating a possible continuation of the downward trend.
On the 1-hour timeframe, the bearish volume is beginning to weaken, suggesting a potential downw
View Original
post-image
  • Reward
  • Comment
  • Repost
  • Share
December 31 Sol Analysis
Reviewing yesterday's recap, Sol's overall trend compared to BTC showed relatively weaker performance. After the price failed to break the 128 resistance during the pullback, it declined to the low of 123, bottomed out, rebounded, and reached 125 this morning.
Sol Analysis
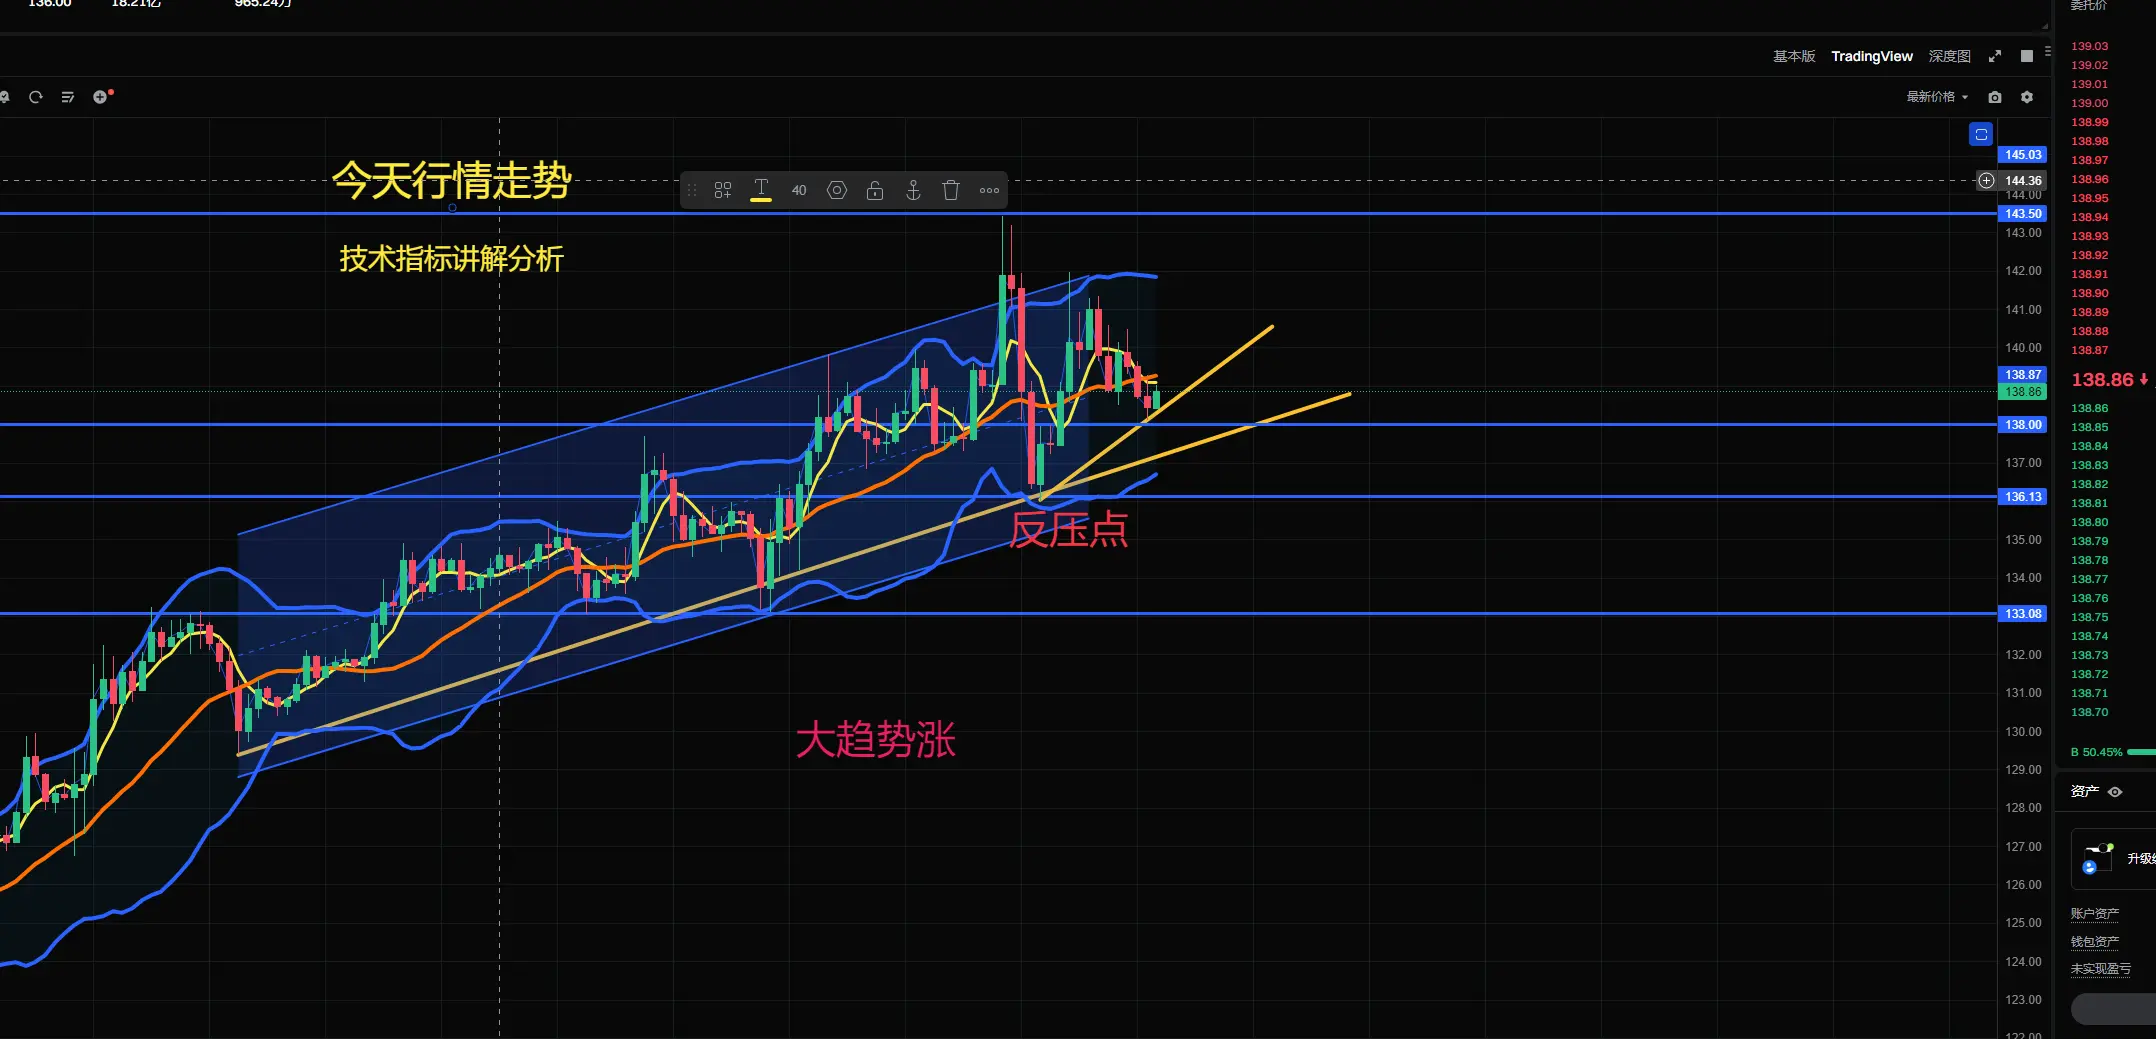
The 4-hour Bollinger Bands are opening upward, corresponding to prices 127, 124, 121. The middle band of the 4-hour Bollinger Bands is trending upward. The 1-hour Bollinger Bands are opening upward, corresponding to prices 125, 124, 123. The middle band of the 1-hour Bollinger Bands is trending upwar
SOL-1,08%
BTC-1,88%
View Original
  • Reward
  • Comment
  • Repost
  • Share
SOL Analysis
1-hour Bollinger Bands opening downward at prices 127, 124, 120; 4-hour Bollinger Band middle line trending downward; 4-hour Bollinger Bands opening narrowing at prices 124, 127, 121; 4-hour Bollinger Band middle line trending upward.
MA Moving Averages: In the 1-hour chart, the price is above MA5 and above the middle line. MA5 crosses above MA10 from below. SOL is trending upward without breaking the upper band, and not breaking the middle line downward. In the 4-hour chart, the price is below MA5 and above the lower band. MA5 crosses below MA10 and MA30 from above. SOL is trendi
SOL-1,08%
View Original
  • Reward
  • Comment
  • Repost
  • Share
December 30th SOL Analysis
Reviewing yesterday's recap, SOL's overall trend compared to BTC shows relatively strong performance. After failing to break the 130 resistance level, it declined back to the low of 122, bottomed out and rebounded, reaching 123 this morning.
SOL Analysis
1-Hour Bollinger Bands opening downward corresponding to prices 127, 124, 120. 4-Hour Bollinger Middle Band trending downward. The 4-Hour Bollinger Bands opening closing corresponds to prices 124, 127, 121, with the 4-Hour Bollinger Middle Band trending upward.
MA Moving Averages: In the 1-hour chart, the price is be
SOL-1,08%
BTC-1,88%
View Original
  • Reward
  • Comment
  • Repost
  • Share
Sol Analysis
4-hour Bollinger Bands opening upward corresponding to prices 127, 123, 120. The middle band of the 4-hour Bollinger Bands is trending upward. The 1-hour Bollinger Bands opening is expanding corresponding to prices 127, 124, 121. The middle band of the 1-hour Bollinger Bands is trending upward.
MA Moving Averages: On the 1-hour chart, the price is above the upper band, above MA5. MA5 crosses above MA10, the middle band, MA30, and MA60 from below. SOL is moving downward without breaking the lower band, and not breaking below MA5. On the 4-hour chart, the price is above the upper ba
SOL-1,08%
View Original
  • Reward
  • Comment
  • Repost
  • Share
December 29th SOL Analysis
Reviewing yesterday's recap, SOL's overall trend compared to BTC shows a relatively strong performance. After the dip did not break the 130 resistance level, it rebounded to the high of 128, touched the top, and then bounced back, reaching 128 this morning.
SOL Analysis
4-hour Bollinger Bands are opening, corresponding to prices 127, 123, 120. The middle band of the 4-hour Bollinger Bands is trending upward. The 1-hour Bollinger Bands are opening, corresponding to prices 127, 124, 121. The middle band of the 1-hour Bollinger Bands is trending upward.
MA Moving Averag
SOL-1,08%
BTC-1,88%
View Original
  • Reward
  • Comment
  • Repost
  • Share
December 27th Sol Analysis
Reviewing yesterday's recap, Sol's overall trend compared to BTC shows relatively strong performance. After failing to break the 126 resistance level, it declined to a low of 120, rebounded, and has been rising to 122 this morning.
Sol Analysis
4-hour Bollinger Bands are opening and closing around prices 124, 122, 120. The middle band of the 4-hour Bollinger is trending downward. The 1-hour Bollinger Bands are opening with three parallel lines around prices 124, 122, 120. The middle band of the 1-hour Bollinger is trending downward.
MA Moving Averages: On the 1-hour
SOL-1,08%
BTC-1,88%
View Original
  • Reward
  • Comment
  • Repost
  • Share
Sol Analysis
4-hour Bollinger Bands opening and closing correspond to prices 125, 122, 120. The middle band of the 4-hour Bollinger Bands shows a downward trend. The 1-hour Bollinger Bands opening is expanding at prices 124, 122, 120. The middle band of the 1-hour Bollinger Bands shows an upward trend.
MA Moving Averages: On the 1-hour chart, the price is above MA5, below the upper band, with MA5 crossing above MA10, the middle band, MA30, and MA60 from below. SOL is trending upward without breaking the middle band and not falling below MA5. On the 4-hour chart, the price is above MA5, below t
SOL-1,08%
View Original
  • Reward
  • Comment
  • Repost
  • Share
December 25 Sol Analysis
Review of yesterday's recap: Overall, Sol's trend compared to BTC showed relatively strong performance. After failing to break the 125 resistance level, it declined to a low of 119, rebounded, and reached 121 this morning.
Sol Analysis
4-hour Bollinger Bands are opening downward at prices 125, 122, 120. The middle band of the 4-hour Bollinger is trending downward. The 1-hour Bollinger Bands are opening at prices 124, 122, 120, with the middle band trending downward.
MA Moving Averages: On the 1-hour chart, the price is below MA5, above the lower band, with MA5 crossing
SOL-1,08%
BTC-1,88%
MA0,26%
View Original
  • Reward
  • Comment
  • Repost
  • Share
SOL Analysis
4-hour Bollinger Bands opening downward corresponding to prices 127, 124, 120. The 4-hour middle band is trending downward. The 1-hour Bollinger Bands opening is closing, corresponding to prices 123, 122, 120. The 1-hour middle band is trending upward.
MA Moving Averages: On the 1-hour chart, the price is below MA5 and below the middle line. MA5 crosses below MA10 from above. SOL is moving downward without breaking the lower band, and upward without breaking MA5. On the 4-hour chart, the price is below MA5, above the lower band. MA5 is turning upward. SOL is moving downward withou
SOL-1,08%
View Original
  • Reward
  • Comment
  • Repost
  • Share
December 25th SOL Analysis
Reviewing yesterday's recap, SOL's overall trend compared to BTC shows relatively strong performance. After failing to break the 124 resistance level, it declined back to the low of 120, bottomed out and rebounded, reaching 122 this morning.
SOL Analysis
The 4-hour Bollinger Bands are opening downward at prices 127, 124, 120, with the middle band trending downward. The 1-hour Bollinger Bands are opening upward at prices 123, 122, 120, with the middle band trending upward.
MA Moving Averages: The 1-hour chart shows the price below MA5 but above the middle line. MA5 cr
SOL-1,08%
BTC-1,88%
View Original
  • Reward
  • Comment
  • Repost
  • Share
Sol Analysis
4-hour Bollinger Bands opening indicates price levels at 128, 124, 121. The middle band of the 4-hour Bollinger Bands is trending downward. The 1-hour Bollinger Bands opening shows the three lines converging at price levels 125, 123, 121. The 1-hour Bollinger Bands middle band is trending downward.
MA Moving Averages: On the 1-hour chart, the price is below MA5 and below the lower band. MA5 crosses below MA10 from above. Sol is moving upward without breaking the lower band and not breaking above MA5. On the 4-hour chart, the price is below the lower band and MA5. MA5 crosses below
SOL-1,08%
View Original
  • Reward
  • Comment
  • Repost
  • Share
December 24th sol analysis
Looking back at yesterday's review, the overall trend of SOL has shown to be relatively strong compared to BTC. After failing to break through the resistance at 126, it fell back to a low of 122, touched the bottom, rebounded, and rose to 123 by this morning.
sol analysis
The 4-hour Bollinger Bands opening corresponds to prices 127, 125, and 122, with the midline of the 4-hour Bollinger Bands showing a downward trend. The 1-hour Bollinger Bands opening has three lines converging at prices 125, 123, and 122, with the midline of the 1-hour Bollinger Bands also show
SOL-1,08%
View Original
  • Reward
  • Comment
  • Repost
  • Share
sol analysis
The 4-hour Bollinger Bands open at corresponding prices of 127, 125, and 124, with a downward trend on the 4-hour Bollinger Band middle line. The 1-hour Bollinger Bands open with three parallel lines at corresponding prices of 128, 126, and 123, with a downward trend on the 1-hour Bollinger Band middle line.
MA Moving Average: The price on the 1-hour chart is below ma5 and above the lower boundary, ma5 crosses ma10 and ma60 from above to below, sol does not break the lower boundary downward and does not break ma5 upward. On the 4-hour chart, the price is below ma5 and above the lo
SOL-1,08%
View Original
  • Reward
  • Comment
  • Repost
  • Share
December 23 Sol Analysis
Looking back at yesterday's review, the overall trend of SOL has shown to be relatively strong compared to BTC. After failing to break the resistance at 130, it dropped back to a low of 124, rebounded from the bottom, and rose to 126 by this morning.
sol analysis
The 4-hour Bollinger Bands show three parallel lines corresponding to prices of 127, 125, and 124, with the middle line trending upward. The 1-hour Bollinger Bands also display three parallel lines corresponding to prices of 128, 126, and 124, with the middle line showing a parallel trend.
MA Moving Averag
SOL-1,08%
View Original
  • Reward
  • Comment
  • Repost
  • Share
December 22nd SOL analysis
Looking back at yesterday's review, SOL experienced a fluctuating market over the weekend, followed by a wave of decline on Sunday night. After failing to break through the resistance at 127, it dropped back to a low of 123, then rebounded, reaching a high of 126 this morning.
sol analysis
The 4-hour Bollinger Bands open and close correspond to prices 128, 125, 131, with the middle line of the 4-hour Bollinger Bands trending upwards. The 1-hour Bollinger Bands show an opening and closing of three lines, corresponding to prices 16, 125, 124, with the middle line
SOL-1,08%
View Original
  • Reward
  • Comment
  • Repost
  • Share
SOL Analysis
4-hour Bollinger Bands opening with three lines downward at prices 131, 125, 118. The middle band of the 4-hour Bollinger Bands is trending downward. The 1-hour Bollinger Bands opening downward, corresponding to prices 128, 121, 115. The middle band of the 1-hour Bollinger Bands is trending downward.
MA Moving Averages: The 4-hour chart price is above MA10, below the middle line. MA5 crosses below MA10 from above, indicating a downward trend for the moving averages. SOL is moving upward but not breaking the middle line, and downward but not breaking MA5 and MA10. The 1-hour chart
SOL-1,08%
View Original
  • Reward
  • Comment
  • Repost
  • Share
December 18 BNB Analysis
Review of yesterday's recap: The overall trend of Binance Coin compared to BTC was relatively weak. After failing to break the 880 resistance on the upside, it declined back to the low of 853, bottomed out and rebounded, reaching the low of 833 this morning. Currently, Binance Coin is showing relatively weak performance among platform tokens, with small fluctuations.
MA Analysis
On the 4-hour Bollinger Bands, the three lines are moving downward, corresponding to prices: 894, 864, 834. The market is currently oscillating. Additionally, the current trend continuously tou
BNB-0,55%
BTC-1,88%
MA0,26%
View Original
post-image
  • Reward
  • Comment
  • Repost
  • Share
BNB Analysis
The 4-hour Bollinger Bands have opened, with corresponding prices at 906, 892, 879. The middle band of the 4-hour Bollinger Bands is trending downward. The 1-hour Bollinger Bands have opened upward, with corresponding prices at 879, 868, 857. The middle band of the 1-hour Bollinger Bands is trending upward.
MA Moving Averages: On the 4-hour chart, the price is below the middle MA line and above MA5. MA5 crosses above MA10 from below, moving upward without breaking the upper band, and not breaking below MA5. On the 1-hour chart, the price is below MA5 and above MA10. MA5 crosses ab
BNB-0,55%
View Original
post-image
  • Reward
  • 1
  • Repost
  • Share
币圈掘金人vip:
  • Pin

Trade Crypto Anywhere Anytime
qrCode
Scan to download Gate App
Community
  • 简体中文
  • English
  • Tiếng Việt
  • 繁體中文
  • Español
  • Русский
  • Français (Afrique)
  • Português (Portugal)
  • Bahasa Indonesia
  • 日本語
  • بالعربية
  • Українська
  • Português (Brasil)