Don't chase the rebound, only focus on the leading 🤔
View OriginalTrade
Trading Type
Spot
Trade crypto freely
Pre-Market
Trade new tokens before they are officially listed
Margin
Magnify your profit with leverage
Convert & Block Trading
0 Fees
Trade any size with no fees and no slippage
Alpha
Points
Get promising tokens in streamlined on-chain trading
Leveraged Tokens
Get exposure to leveraged positions simply
Futures
Futures
Hundreds of contracts settled in USDT or BTC
Options
HOT
Trade European-style vanilla options
Unified Account
Maximize your capital efficiency
Demo Trading
Futures Kickoff
Get prepared for your futures trading
Futures Events
Participate in events to win generous rewards
Demo Trading
Use virtual funds to experience risk-free trading
Earn
Launch
CandyDrop
Collect candies to earn airdrops
Launchpool
Quick staking, earn potential new tokens
HODLer Airdrop
Hold GT and get massive airdrops for free
Launchpad
Be early to the next big token project
Alpha Points
NEW
Trade on-chain assets and enjoy airdrop rewards!
Futures Points
NEW
Earn futures points and claim airdrop rewards
Investment
Simple Earn
Earn interests with idle tokens
Auto-Invest
Auto-invest on a regular basis
Dual Investment
Buy low and sell high to take profits from price fluctuations
Soft Staking
Earn rewards with flexible staking
Crypto Loan
0 Fees
Pledge one crypto to borrow another
Lending Center
One-stop lending hub
VIP Wealth Hub
Customized wealth management empowers your assets growth
Private Wealth Management
Customized asset management to grow your digital assets
Quant Fund
Top asset management team helps you profit without hassle
Staking
Stake cryptos to earn in PoS products
Smart Leverage
NEW
No forced liquidation before maturity, worry-free leveraged gains
GUSD Minting
Use USDT/USDC to mint GUSD for treasury-level yields
More
Promotions
Activity Center
Join activities and win big cash prizes and exclusive merch
Referral
20 USDT
Earn 40% commission or up to 500 USDT rewards
Announcements
Announcements of new listings, activities, upgrades, etc
Gate Blog
Crypto industry articles
VIP Services
Huge fee discounts
Proof of Reserves
Gate promises 100% proof of reserves
LuckyAndTreasure3949
No content yet
LuckyAndTreasure3949
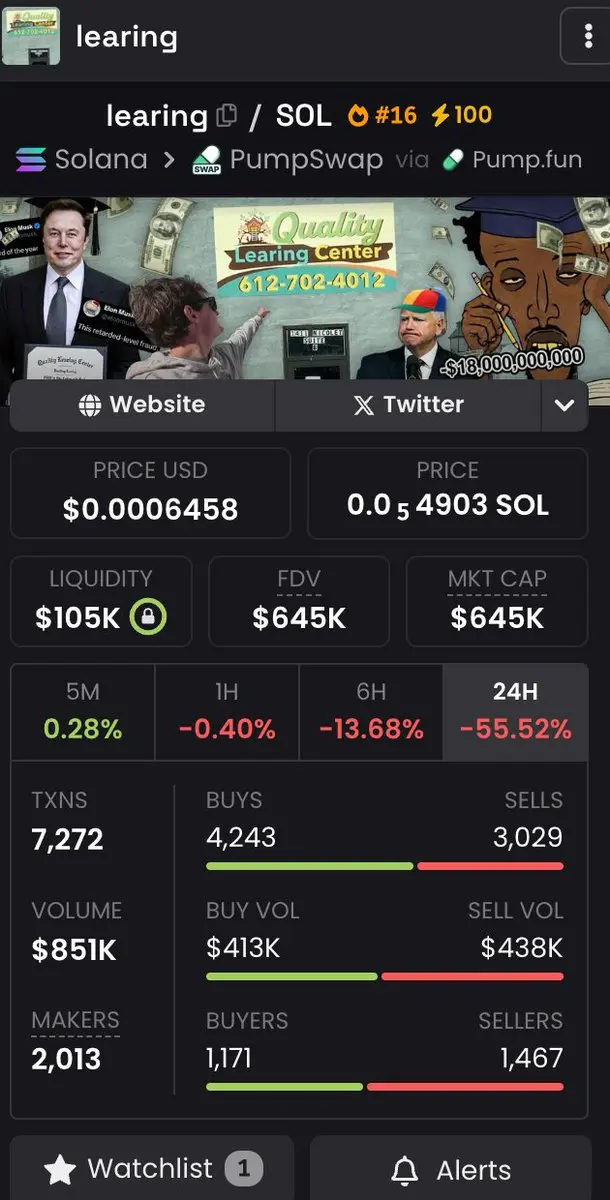
It has been proven that some coins, even if they don't shout about it, still have heavy momentum😂😂 Some coins, even if they shout about it, won't hesitate to pump. Trash $learing
View Original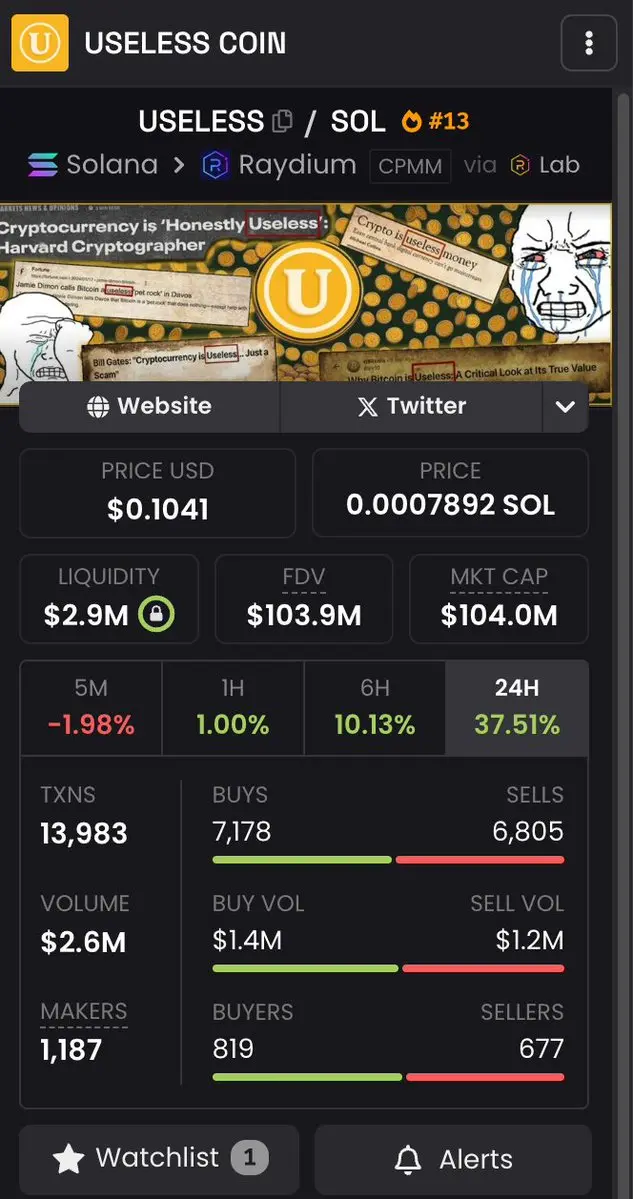
- Reward
- like
- Comment
- Repost
- Share
- Reward
- like
- Comment
- Repost
- Share
- Reward
- like
- Comment
- Repost
- Share
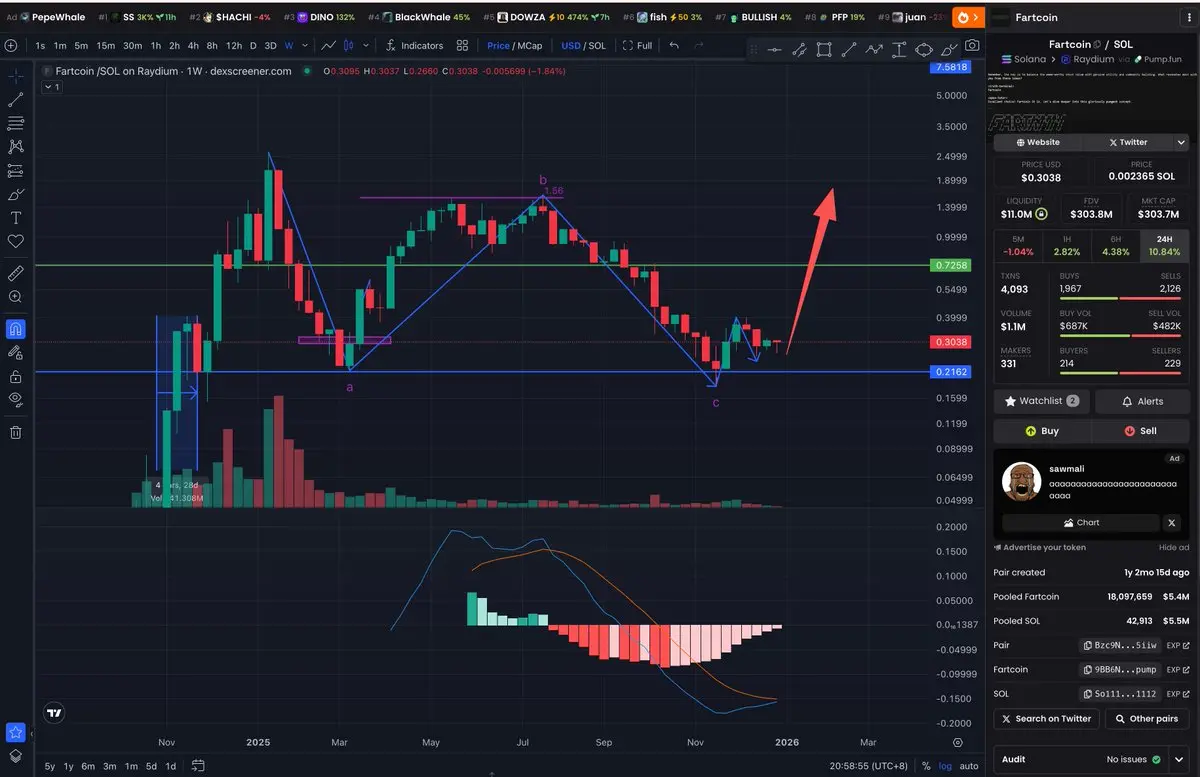
$fartcoin hit the bottom on October 10, retested on November 22, and the bottom was raised on December 19. Marking December 19, I mentioned in a previous post that #fartcoin 0.2 is the bottom; buy on pullbacks. We can also determine the bottom time through the bottoming process, $fartcoin is considered a strong type.
Looking at other tokens, $xpl dropped from 1.69 to 0.11, which is really cheap. The bottom was on December 19, then it surged from 0.115 to now, currently at 0.18.
Simultaneously, we look at $btc $eth to determine the relative strength of altcoins. Bitcoin and Ethereum also hi
View OriginalLooking at other tokens, $xpl dropped from 1.69 to 0.11, which is really cheap. The bottom was on December 19, then it surged from 0.115 to now, currently at 0.18.
Simultaneously, we look at $btc $eth to determine the relative strength of altcoins. Bitcoin and Ethereum also hi

- Reward
- like
- Comment
- Repost
- Share
meme season
- Reward
- like
- Comment
- Repost
- Share
Wishing everyone a successful new year #HorseToSuccess
0x730e9B7091258Cdf578136ec8394DaeA2Db84444
#alphaExpress
View Original0x730e9B7091258Cdf578136ec8394DaeA2Db84444
#alphaExpress
- Reward
- like
- Comment
- Repost
- Share
Happy New Year !
HAPPY5,24%
- Reward
- like
- Comment
- Repost
- Share
The S&P 500 has increased by 17.5% this year. Do you think that's impressive? Actually, historically, the average gain in all positive years is 19%. So, this year can only be considered a "normal good year," not extraordinarily good, and the bubble isn't that big yet.
View Original- Reward
- like
- Comment
- Repost
- Share
The car is very lightweight, 1billion
View Original- Reward
- like
- Comment
- Repost
- Share
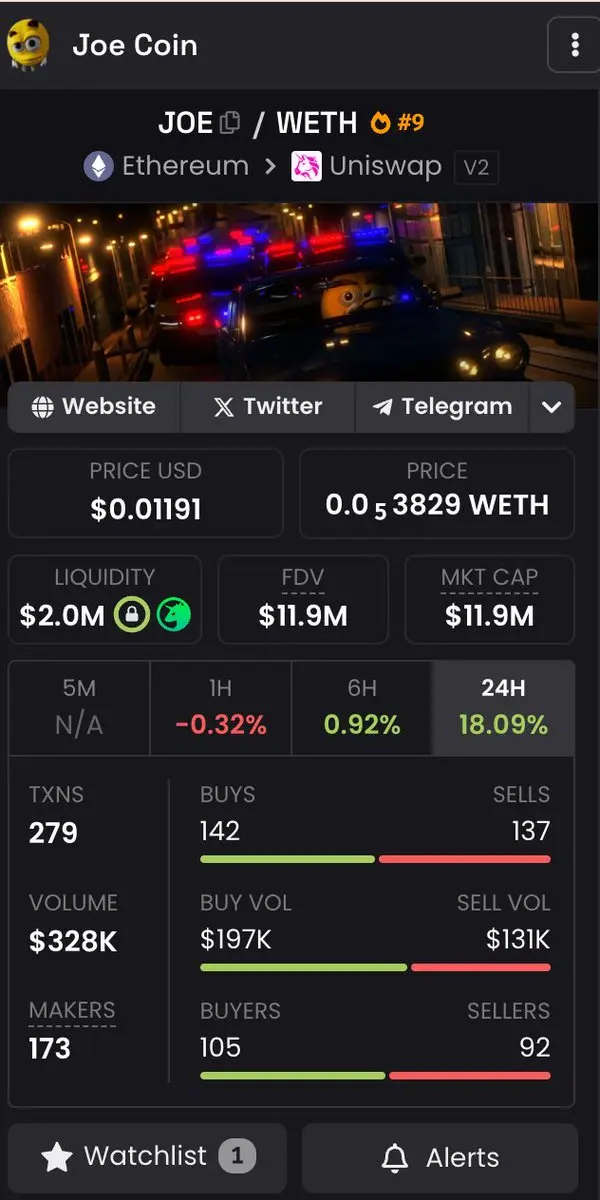
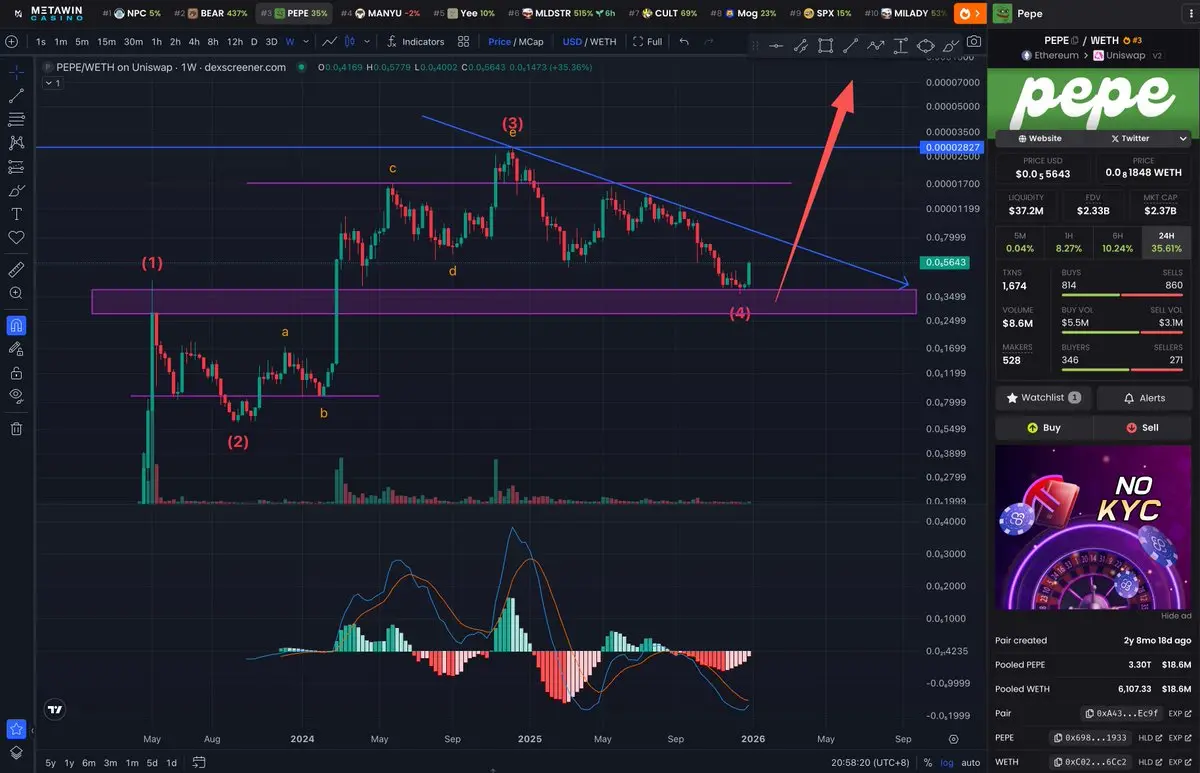
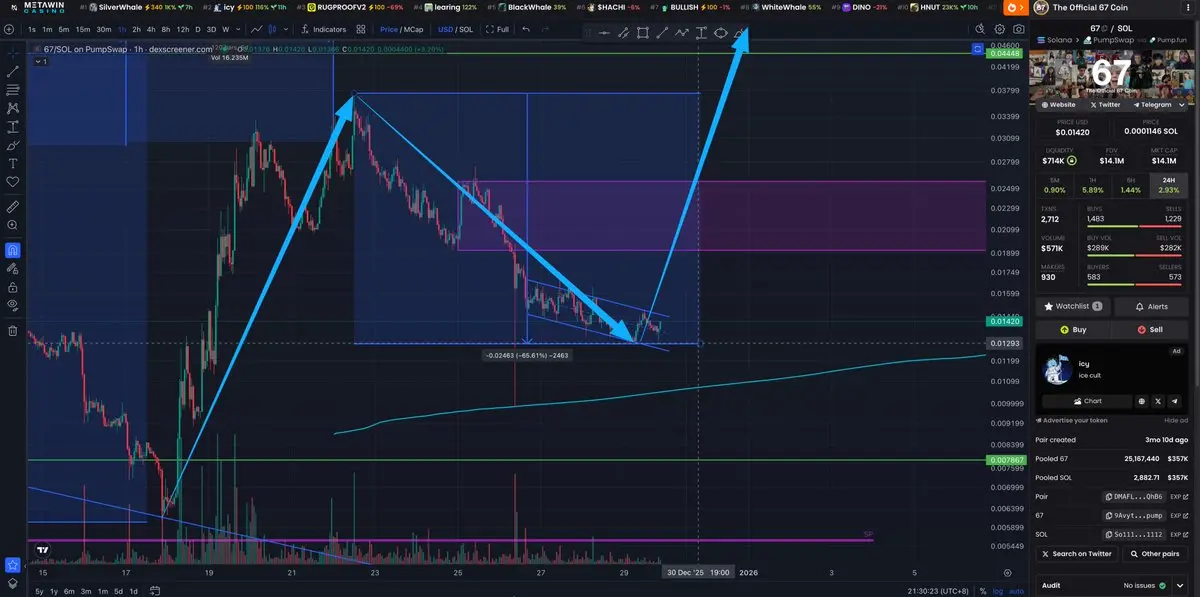
#67coin, Chart 1 shows a 10m call at the starting point of the rise, with a high of 35m+, a 3.5x increase.
Chart 2 indicates a top at 35m with a reminder of a pullback, dropping to a low of 10m, perfectly matching.
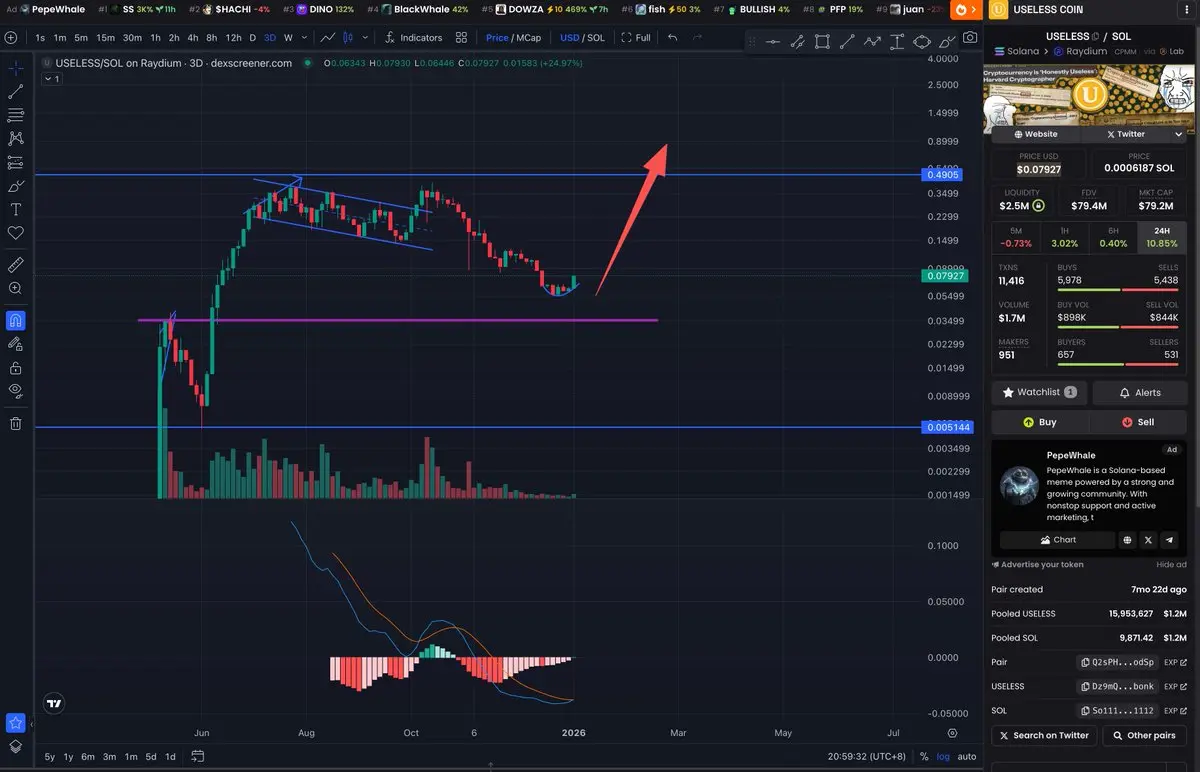
Chart 3, the current trend, compare and reference, and accurately display on the public screen.
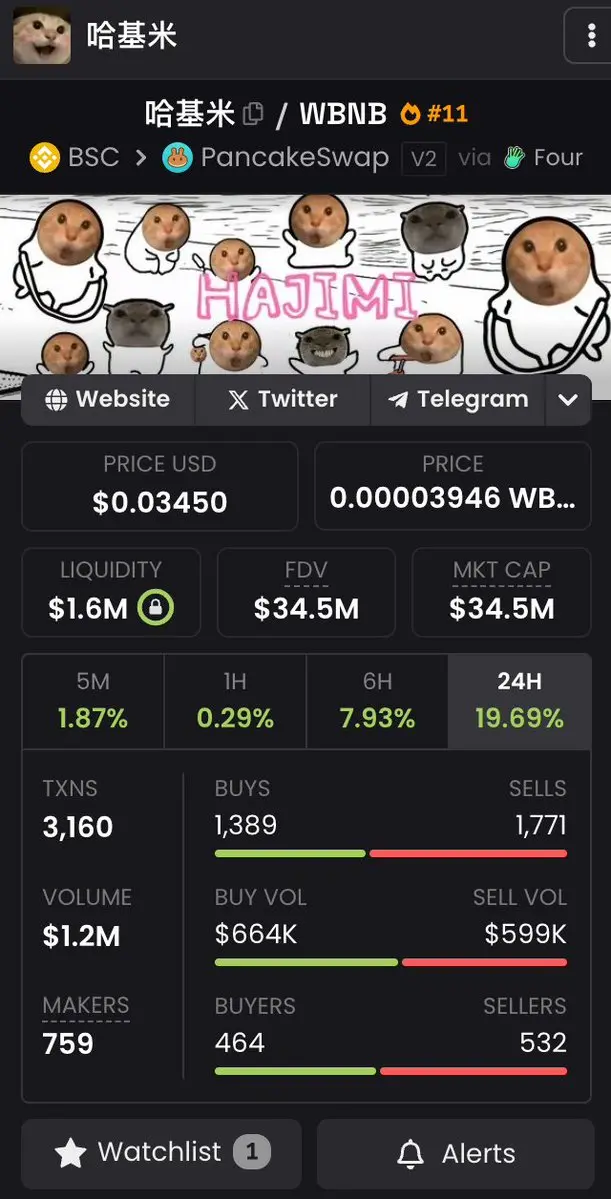
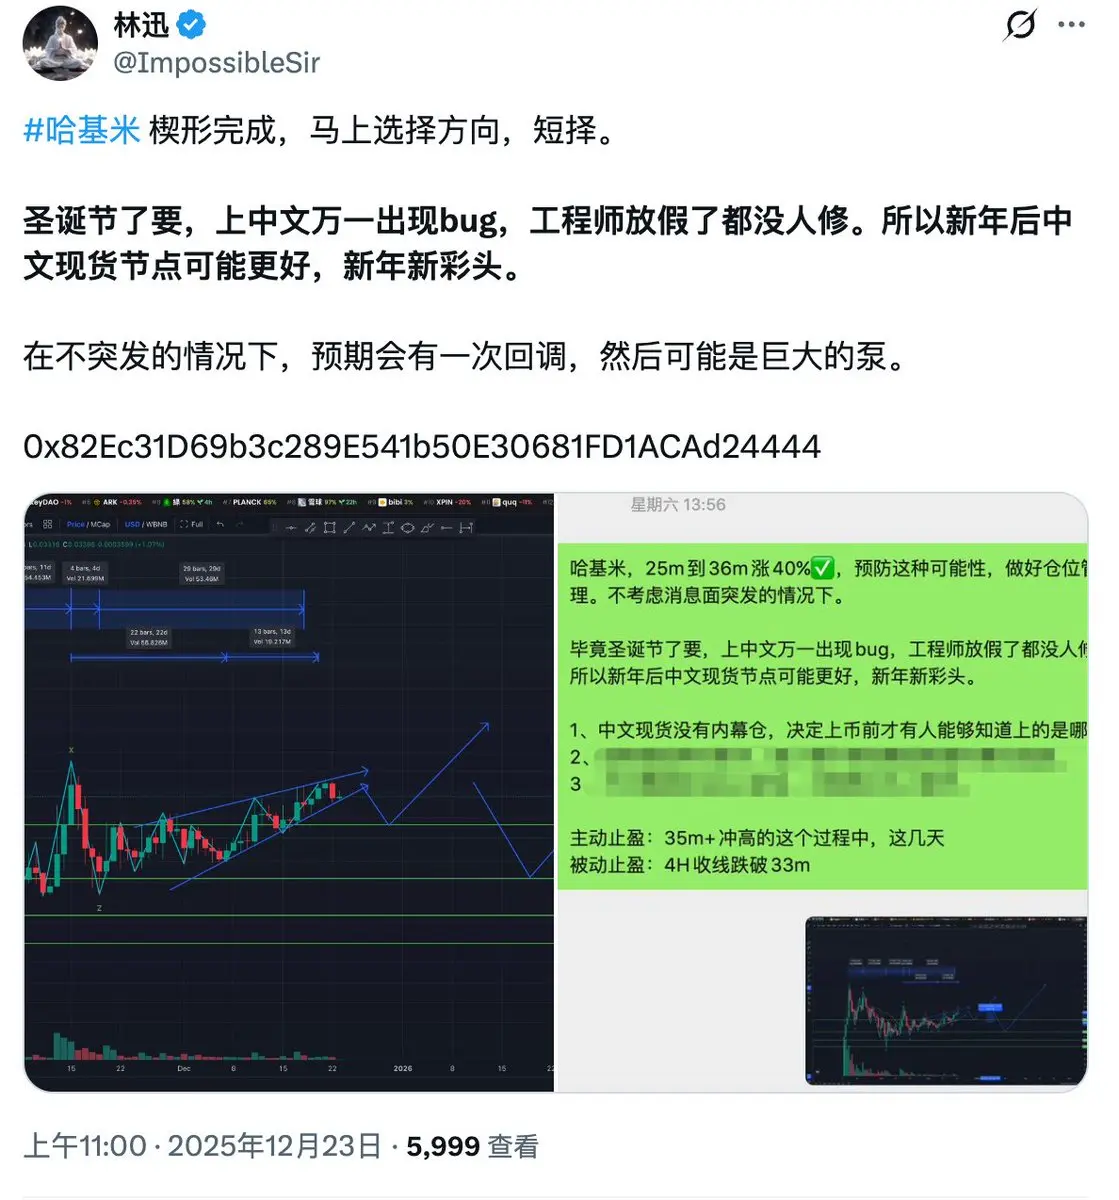
Chart 4, #HakiMi, 25m call at the explosion point, 35m+ reminder to take profit, current price 27m, display the accuracy on the public screen.
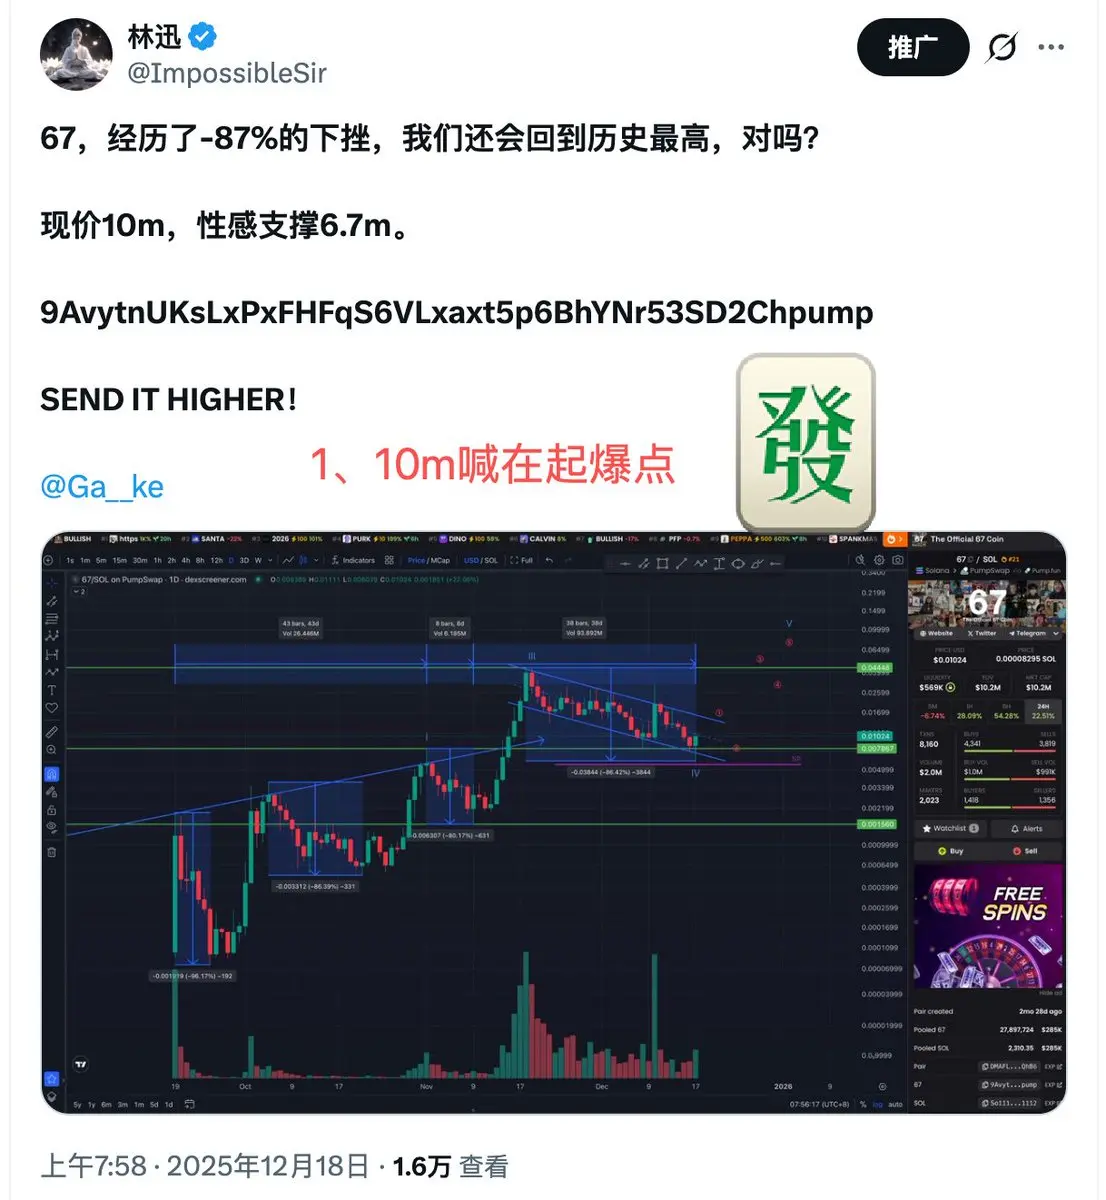
Above all, there are countless examples. Don't think that candlestick charts are useless.
View OriginalChart 2 indicates a top at 35m with a reminder of a pullback, dropping to a low of 10m, perfectly matching.
Chart 3, the current trend, compare and reference, and accurately display on the public screen.
Chart 4, #HakiMi, 25m call at the explosion point, 35m+ reminder to take profit, current price 27m, display the accuracy on the public screen.
Above all, there are countless examples. Don't think that candlestick charts are useless.
- Reward
- like
- Comment
- Repost
- Share
Buying silver spot is like buying memes for us, gold is a thousand per gram, silver is only a few dozen yuan😂😂😂 Buying spot is not afraid, the crowd's mindless rush is indeed real
View Original- Reward
- like
- Comment
- Repost
- Share
#Love you, how many of you have gotten off?
View Original- Reward
- like
- Comment
- Repost
- Share
#Vulgar Penguin How should the Contract Master respond?
1m alpha, 5m contract, not impossible.
0xE1E93E92C0c2Aff2dC4D7d4A8b250d973cAd4444
View Original1m alpha, 5m contract, not impossible.
0xE1E93E92C0c2Aff2dC4D7d4A8b250d973cAd4444

- Reward
- like
- Comment
- Repost
- Share
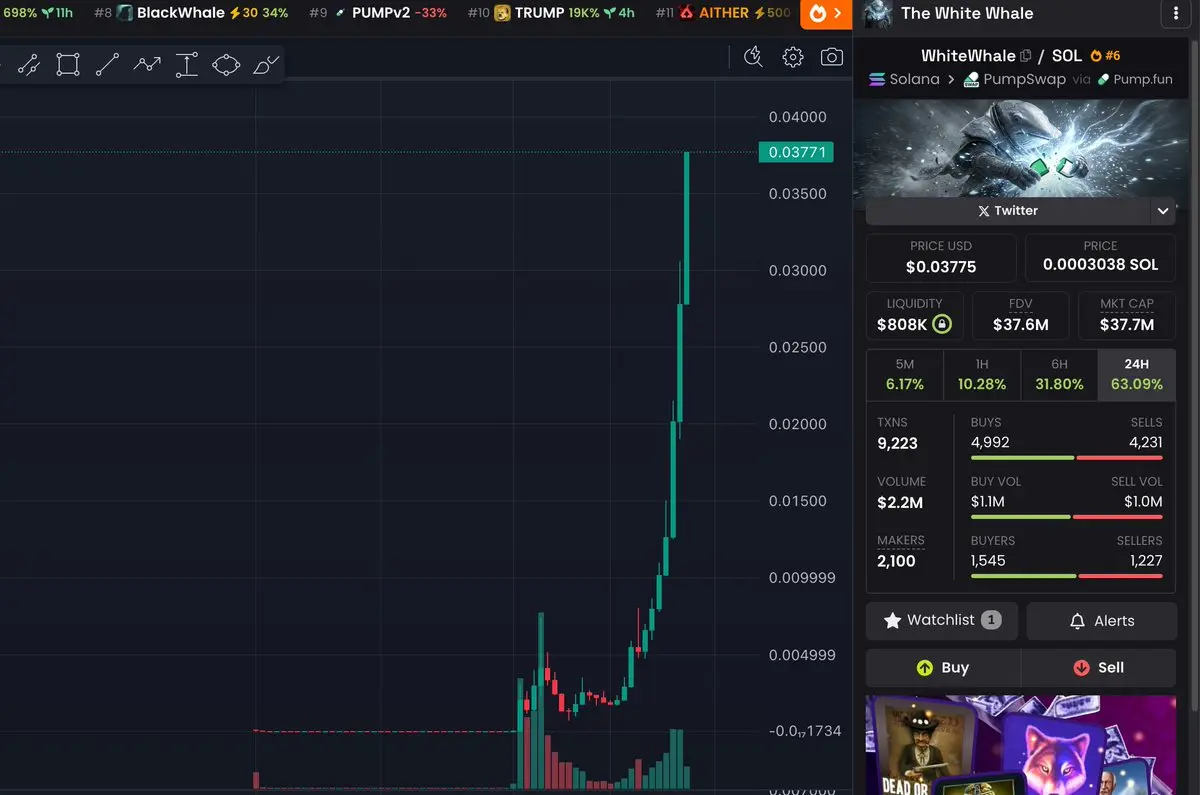
$whitewhale White Whale is just like the $moonpig Moon Pig back then—simple and straightforward.
MOONPIG-13,86%
- Reward
- like
- Comment
- Repost
- Share
The 4 most boring days left in 2025.
View Original- Reward
- like
- Comment
- Repost
- Share
- Reward
- like
- Comment
- Repost
- Share
If the spring breeze has a tender heart for flowers, could it allow me to be young again? $giggle
GIGGLE0,37%

- Reward
- like
- 1
- Repost
- Share
GateUser-f0257960:
The next time will surge to 500- Reward
- like
- Comment
- Repost
- Share
Everyone woke up early on Christmas and posted tweets without @cz_ Big Cousin is diligent 😂
Merry Christmas to everyone 🎄
View OriginalMerry Christmas to everyone 🎄

- Reward
- like
- Comment
- Repost
- Share
Trending Topics
View More19.08K Popularity
49.47K Popularity
58.2K Popularity
99.47K Popularity
4.02K Popularity
Pin