山寨币战神带单
vip
Peak Tier 4
Memecoin Hunter
Market Analyst
No content yet
Pin
PP bulls are strong, with solid support at 0.3. As long as it doesn't break below, you can continue to hold.
View Original
[The user has shared his/her trading data. Go to the App to view more.]
  • Reward
  • Comment
  • Repost
  • Share
PIPP (PIPPIN) Trading Guide: Precise Entry Points + Practical Strategies, Stay Close to Profits and Avoid Pitfalls
As a trending meme coin in the crypto space recently, PIPPIN has surged over 110% in 7 days and skyrocketed by 953% in 30 days. Although dominated by whales and exhibiting high volatility, there are still high-profit opportunities by focusing on key levels. Based on the latest market data, clearly identify support/resistance levels, buy/sell points, and stop-loss/take-profit strategies. Numbers and data speak more reliably:
1. Core Support and Resistance Levels (Updated in real-ti
PIPPIN7.7%
View Original
post-image
[The user has shared his/her trading data. Go to the App to view more.]
  • Reward
  • Comment
  • Repost
  • Share
$PIPPIN The bullish trend is strong. Operate according to the levels, follow the signals to profit.
PIPPIN7.7%
View Original
post-image
post-image
[The user has shared his/her trading data. Go to the App to view more.]
  • Reward
  • Comment
  • Repost
  • Share
Brothers, recently BAT has dropped 7.2%, with the current price at $0.25907, directly touching the lower band of the 4-hour Bollinger Bands (0.25948). It may seem like panic, but in fact, it’s a rare opportunity for strategic positioning!

Core data support, BAT’s potential should not be underestimated

1. Support level as solid as a rock: The 4-hour line at $0.25948 is a strong support at the lower Bollinger Band, and the previous low of $0.24019 formed a double bottom structure. The current $0.25907 is very close to the support level, with only 4% downside potential, but over 12% upside po
BAT-9.75%
View Original
post-image
[The user has shared his/her trading data. Go to the App to view more.]
  • Reward
  • Comment
  • Repost
  • Share
$PIPPIN pipp is currently experiencing a overall downward correction, but the daily chart shows a bullish trend. The aggressive bottom-fishing strategy is as follows!
Position batch #Gate11月透明度报告出炉
First batch (initial position) 0.312-0.315 15-minute Bollinger Bands lower band (0.331285) + previous low of 0.31263 form a support resonance, which is a strong short-term support zone. Total position 30%
Second batch (additional purchase) 0.325-0.330 1-hour MA60 (0.329048) + 4-hour MA20 (0.327494) form a medium-term support band, with strong buying support when falling into this range. Total posit
PIPPIN7.7%
View Original
[The user has shared his/her trading data. Go to the App to view more.]
  • Reward
  • Comment
  • Repost
  • Share
Trend determination: ETH 4-hour chart is in a consolidation and bottoming phase after a decline, with bearish momentum continuously weakening. Bulls are attempting to rebound but have not yet broken through the key resistance. Overall, the trend is oscillating with a slight bullish bias.
Core trend logic
1. Support level: The price has formed effective support at $3,042, with multiple tests without breaking. The lower band of the Bollinger Bands (at $3,027.77) provides resonant support, and the bottom pattern is gradually solidifying;
2. Resistance level: MA20 ($3,149.83) and MA60 ($3,146.88)
ETH-4.74%
View Original
post-image
post-image
[The user has shared his/her trading data. Go to the App to view more.]
  • Reward
  • 1
  • Repost
  • Share
GateUser-d10f5768vip:
Just go for it💪
Trend Determination: The 15-minute / 1-hour / 4-hour charts are simultaneously showing a short-term oscillating upward trend, with bullish momentum gradually warming up and no clear top reversal signals appearing.
Long Entry Points
1. Conservative Buy Low: Enter directly on a pullback to the $0.325-0.330 range, relying on the MA20 moving average support for positioning;

2. Confirming a Breakout: Add positions after breaking through $0.350 (Bollinger upper band resistance), further strengthening the bullish trend.
Short Entry Points
1. Resistance Short: Build a position on a rebound to the $0
View Original
post-image
post-image
post-image
[The user has shared his/her trading data. Go to the App to view more.]
  • Reward
  • Comment
  • Repost
  • Share
1. Long Strategy
- Entry Point: $0.29-$0.30 range, no more than 2% of total funds;
- Stop Loss: below $0.28;
- Take Profit: first target $0.33, second target $0.35 (look for $0.38 after breakout).
2. Short Strategy
- Entry Point: rebound to $0.35-$0.36 range;
- Stop Loss: above $0.38;
- Take Profit: $0.32, look for $0.30 after breakdown.
View Original
post-image
[The user has shared his/her trading data. Go to the App to view more.]
  • Reward
  • Comment
  • Repost
  • Share
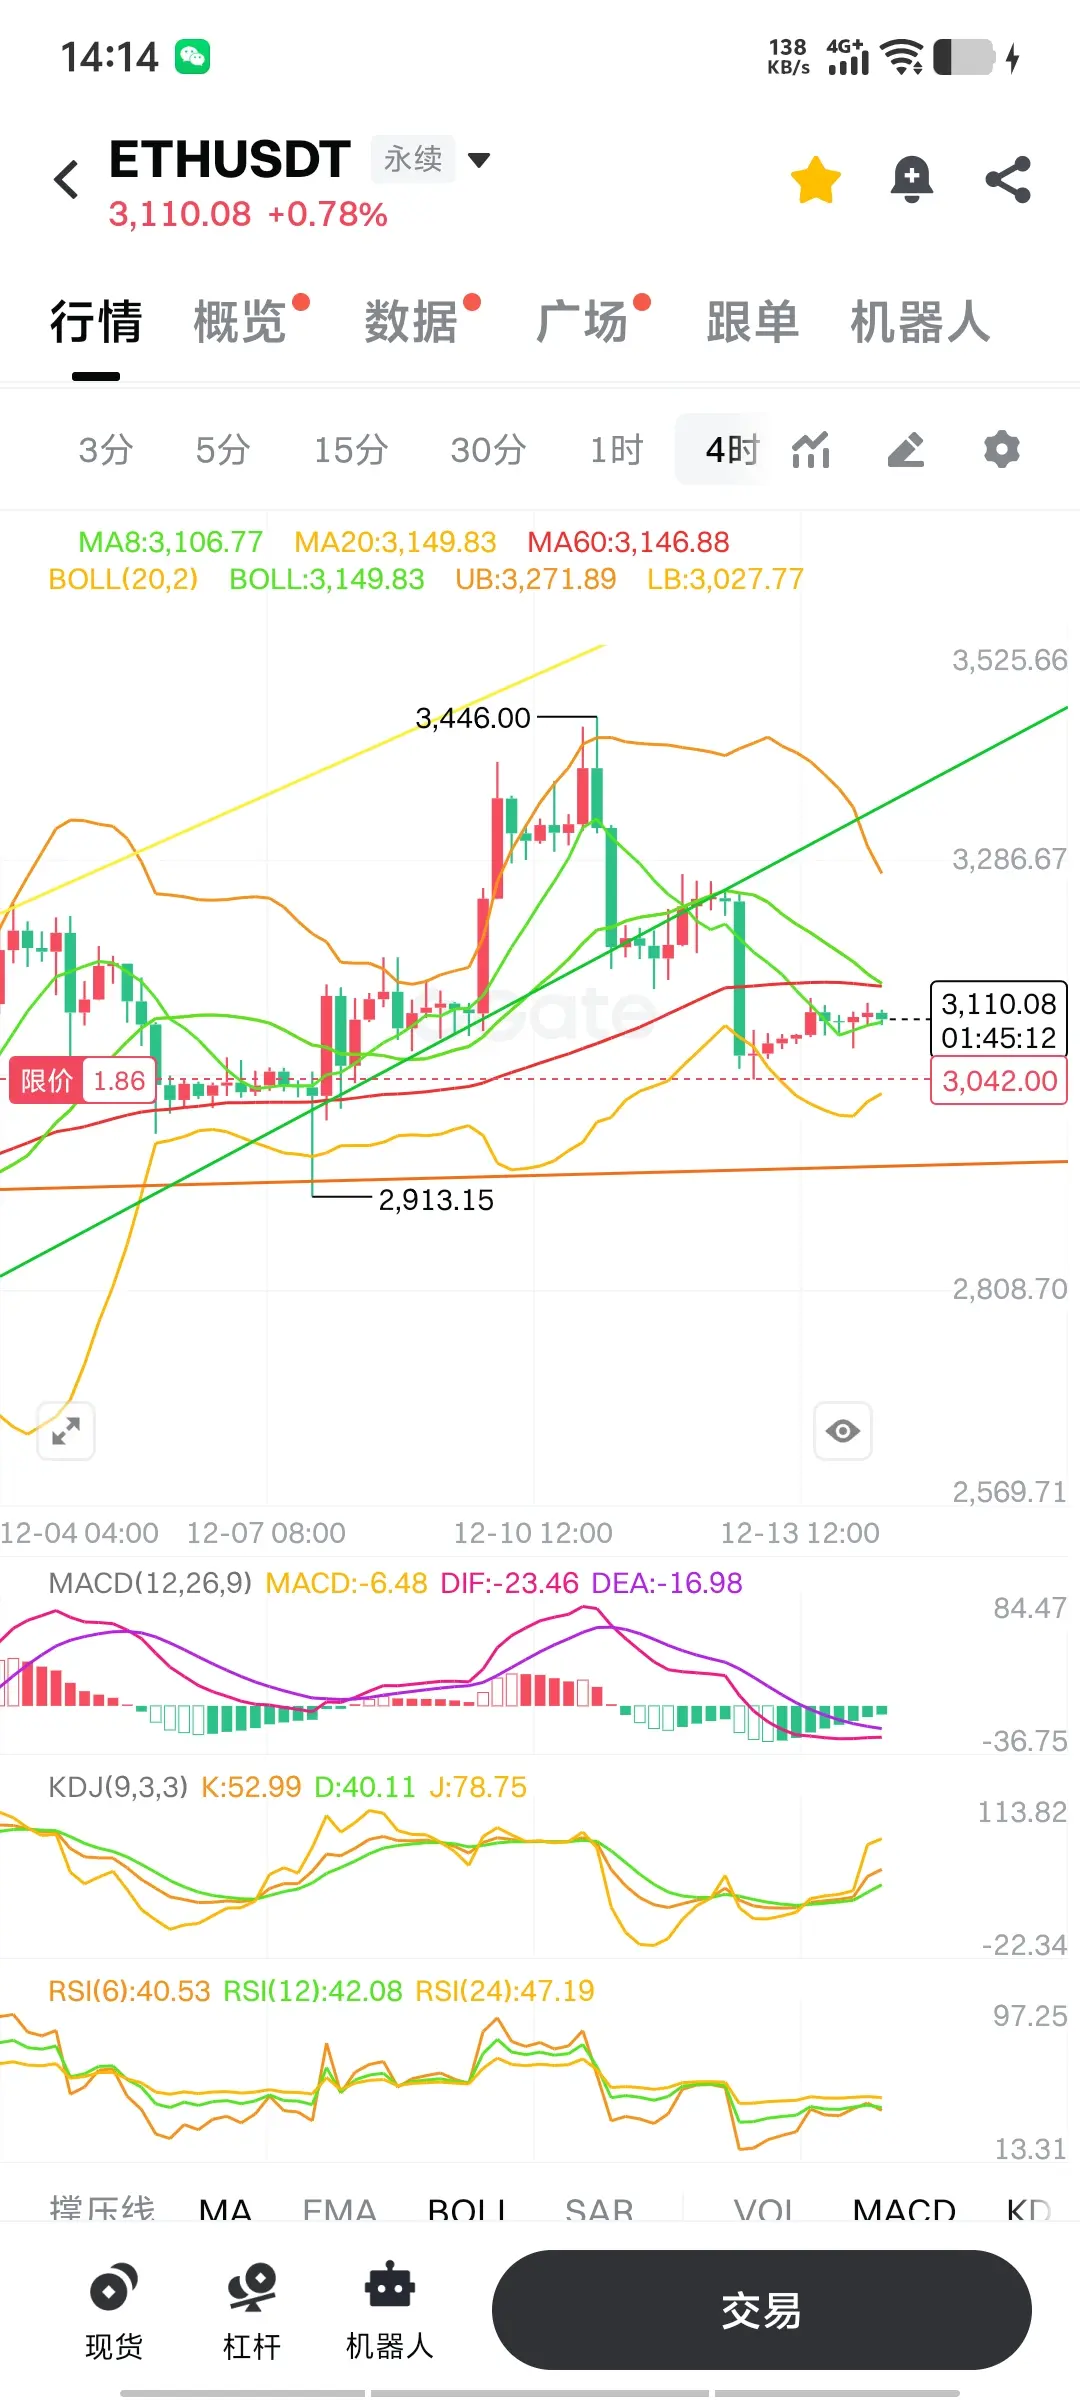
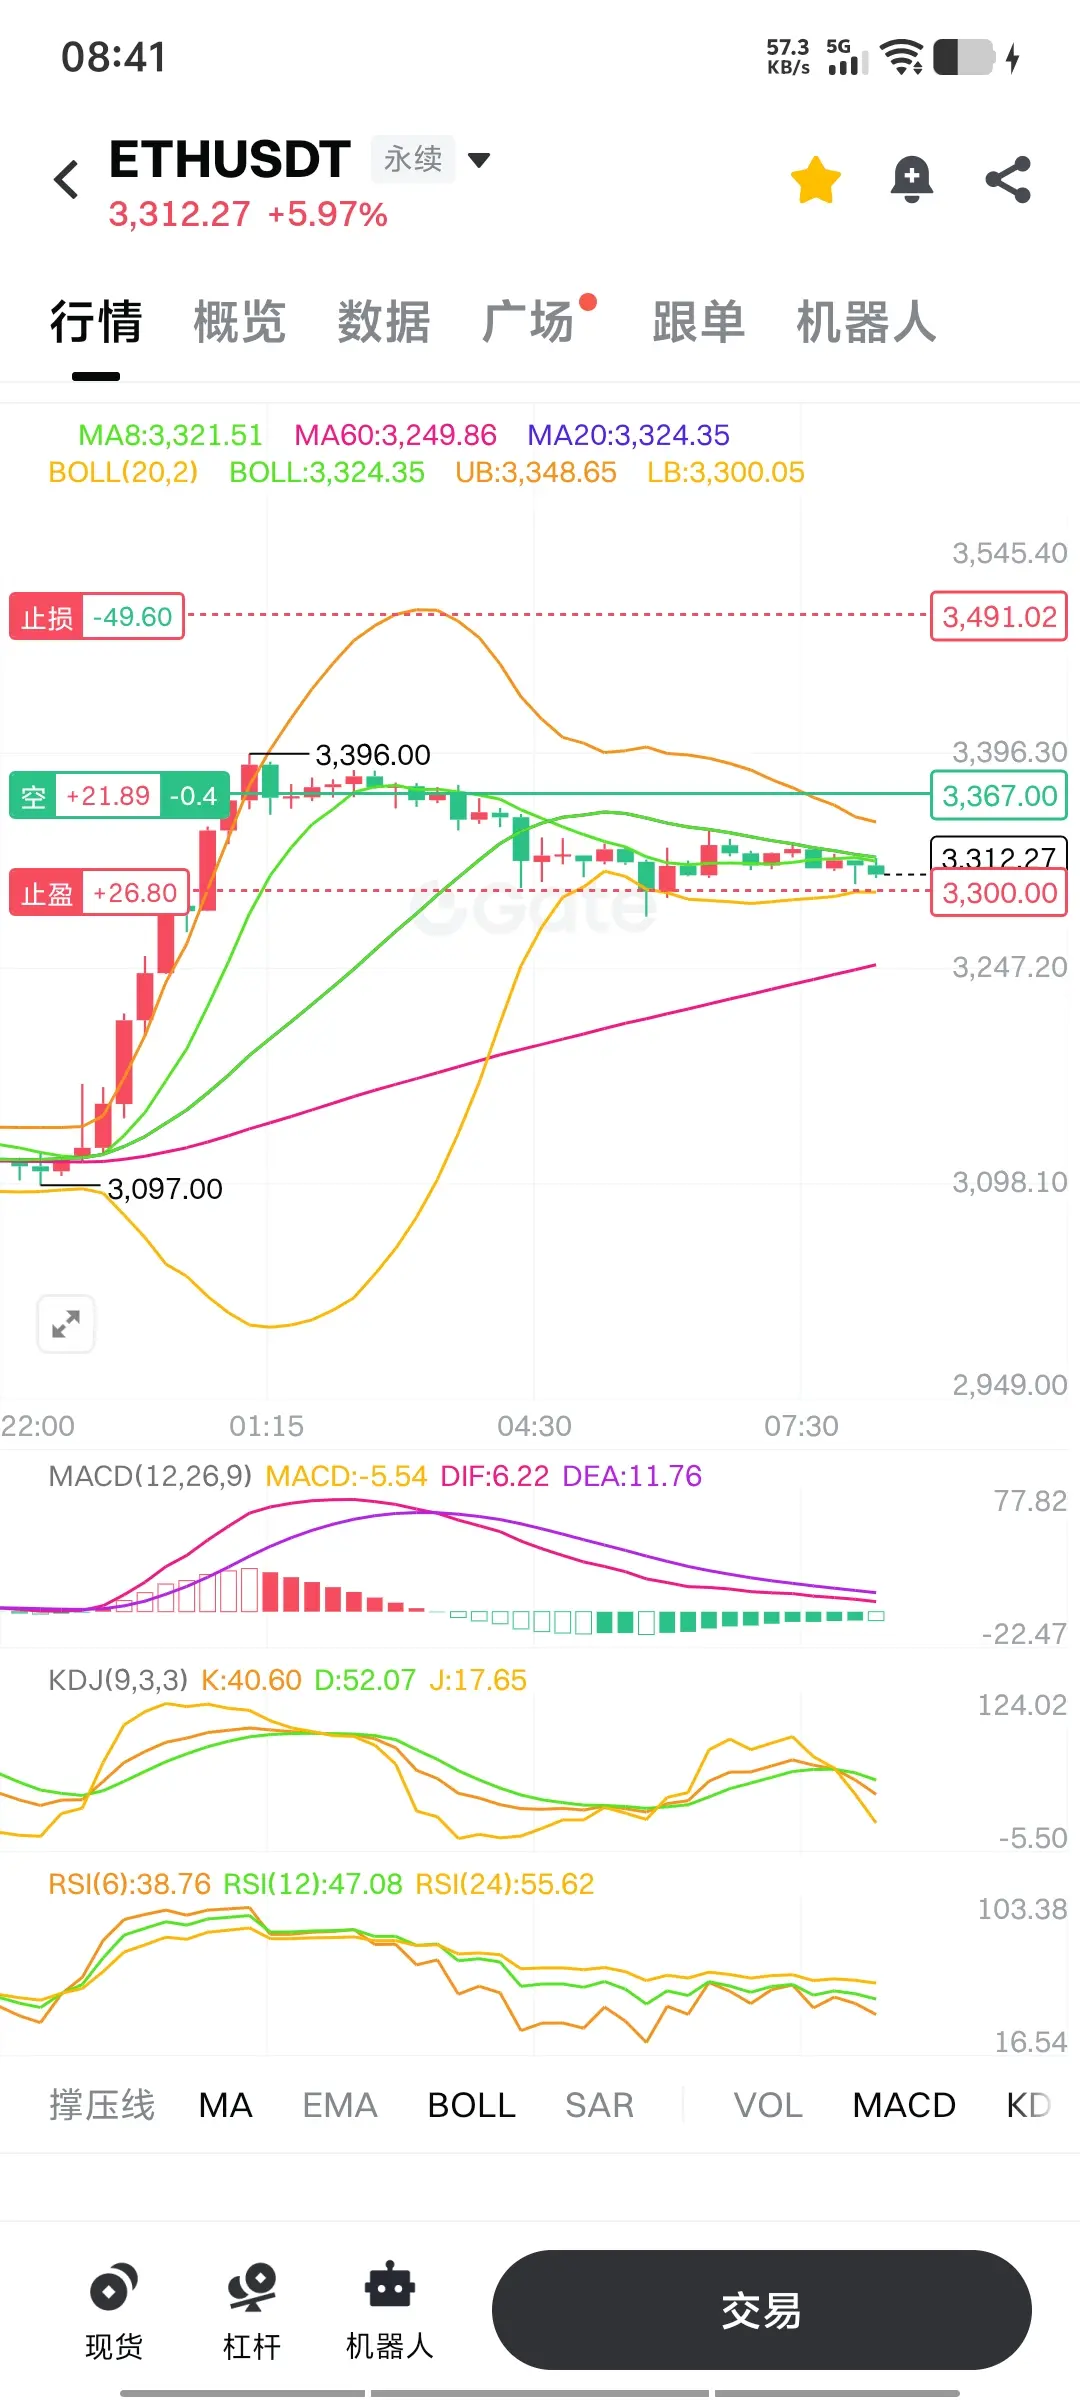
Based on the ETH/USDT 1-hour candlestick chart
I. Resistance Level Analysis
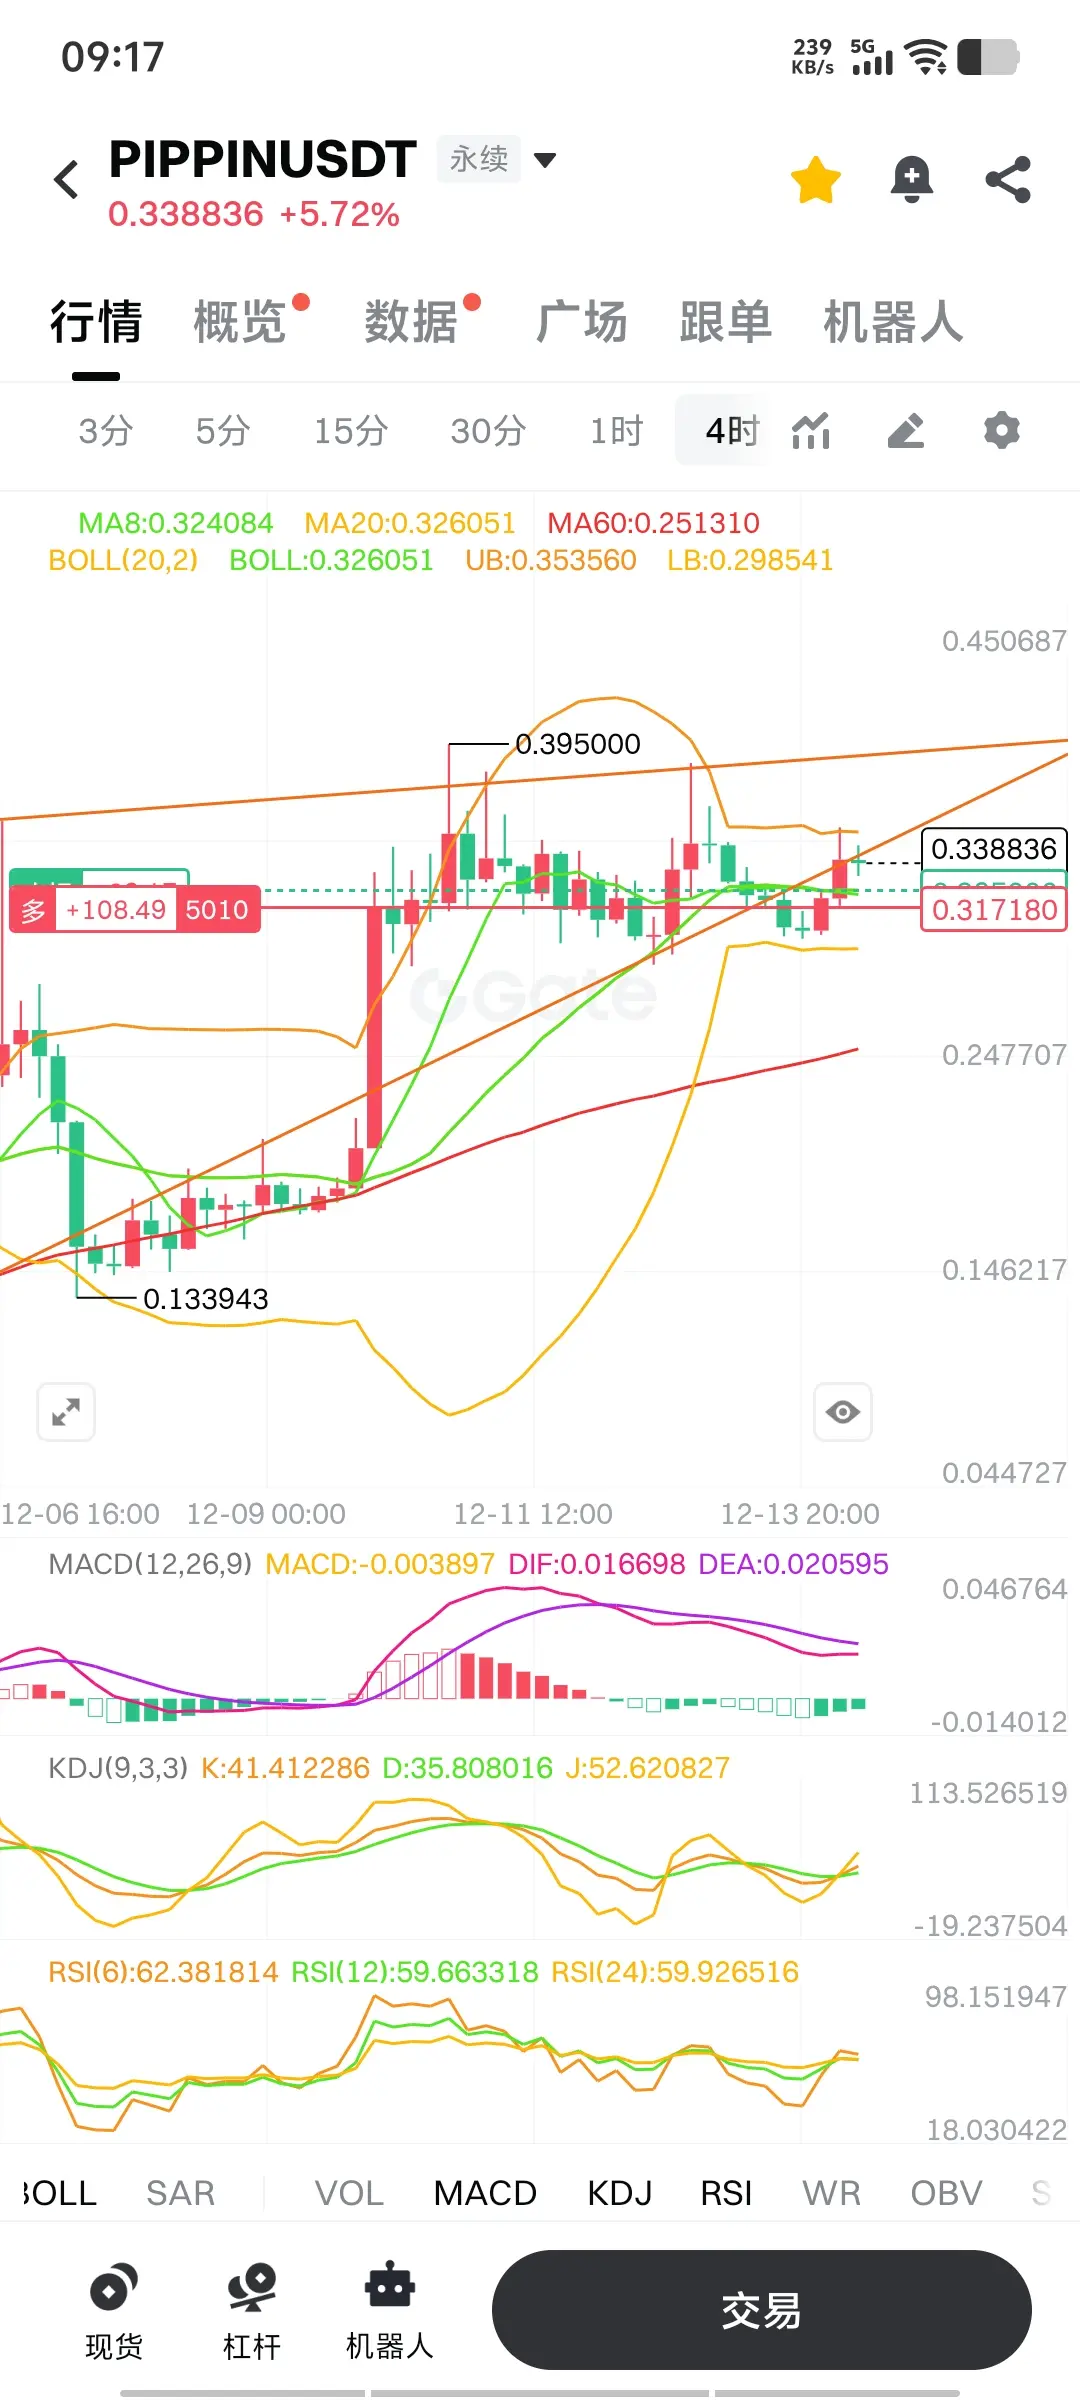
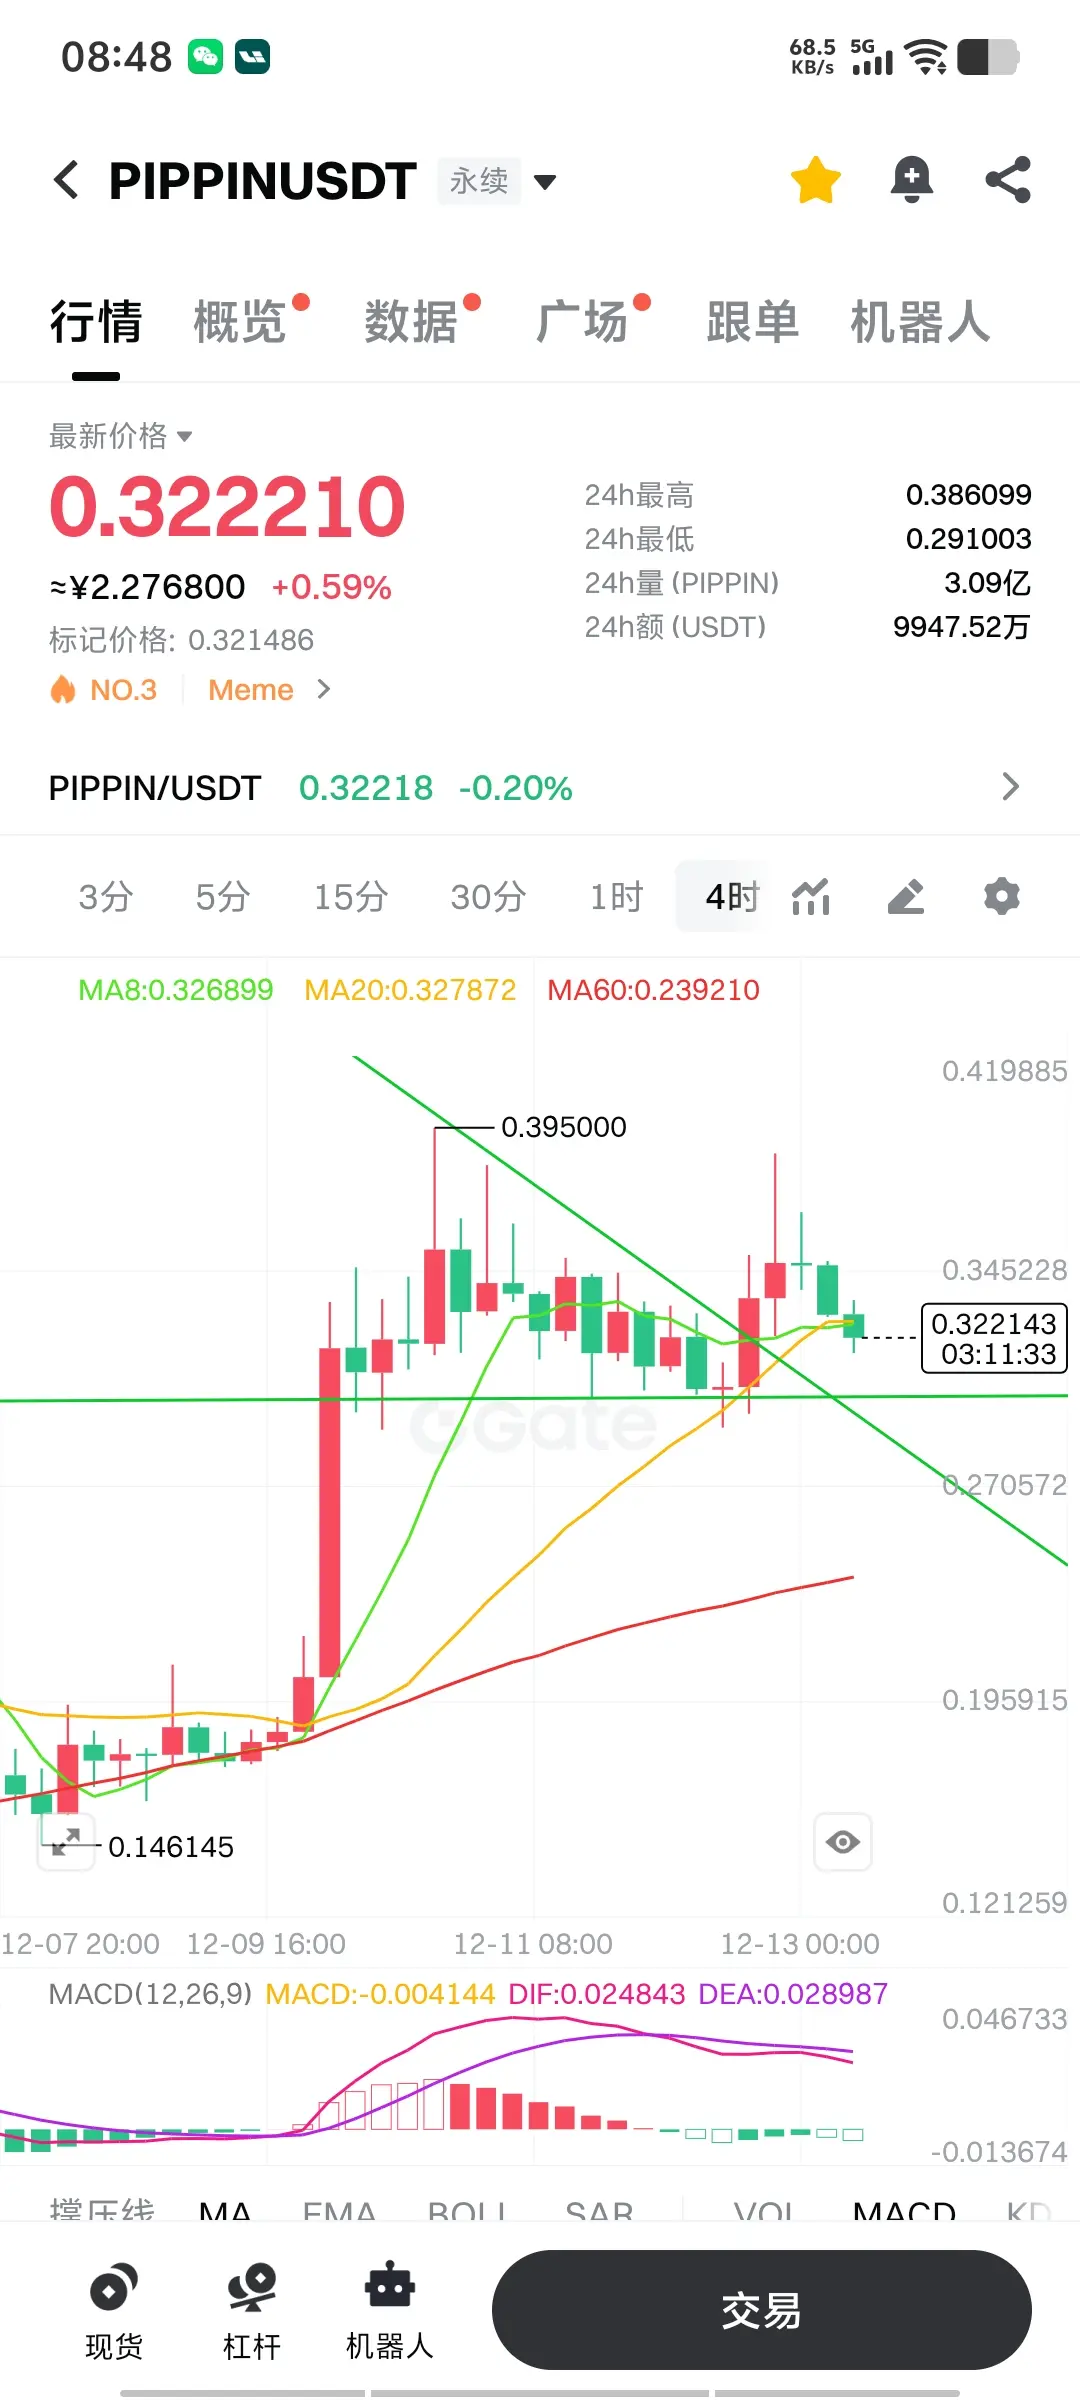
1. First Resistance Level: $3300-$3360 range
2. Second Resistance Level: $3424.49 (Bollinger Upper Band)
II. Support Level Analysis
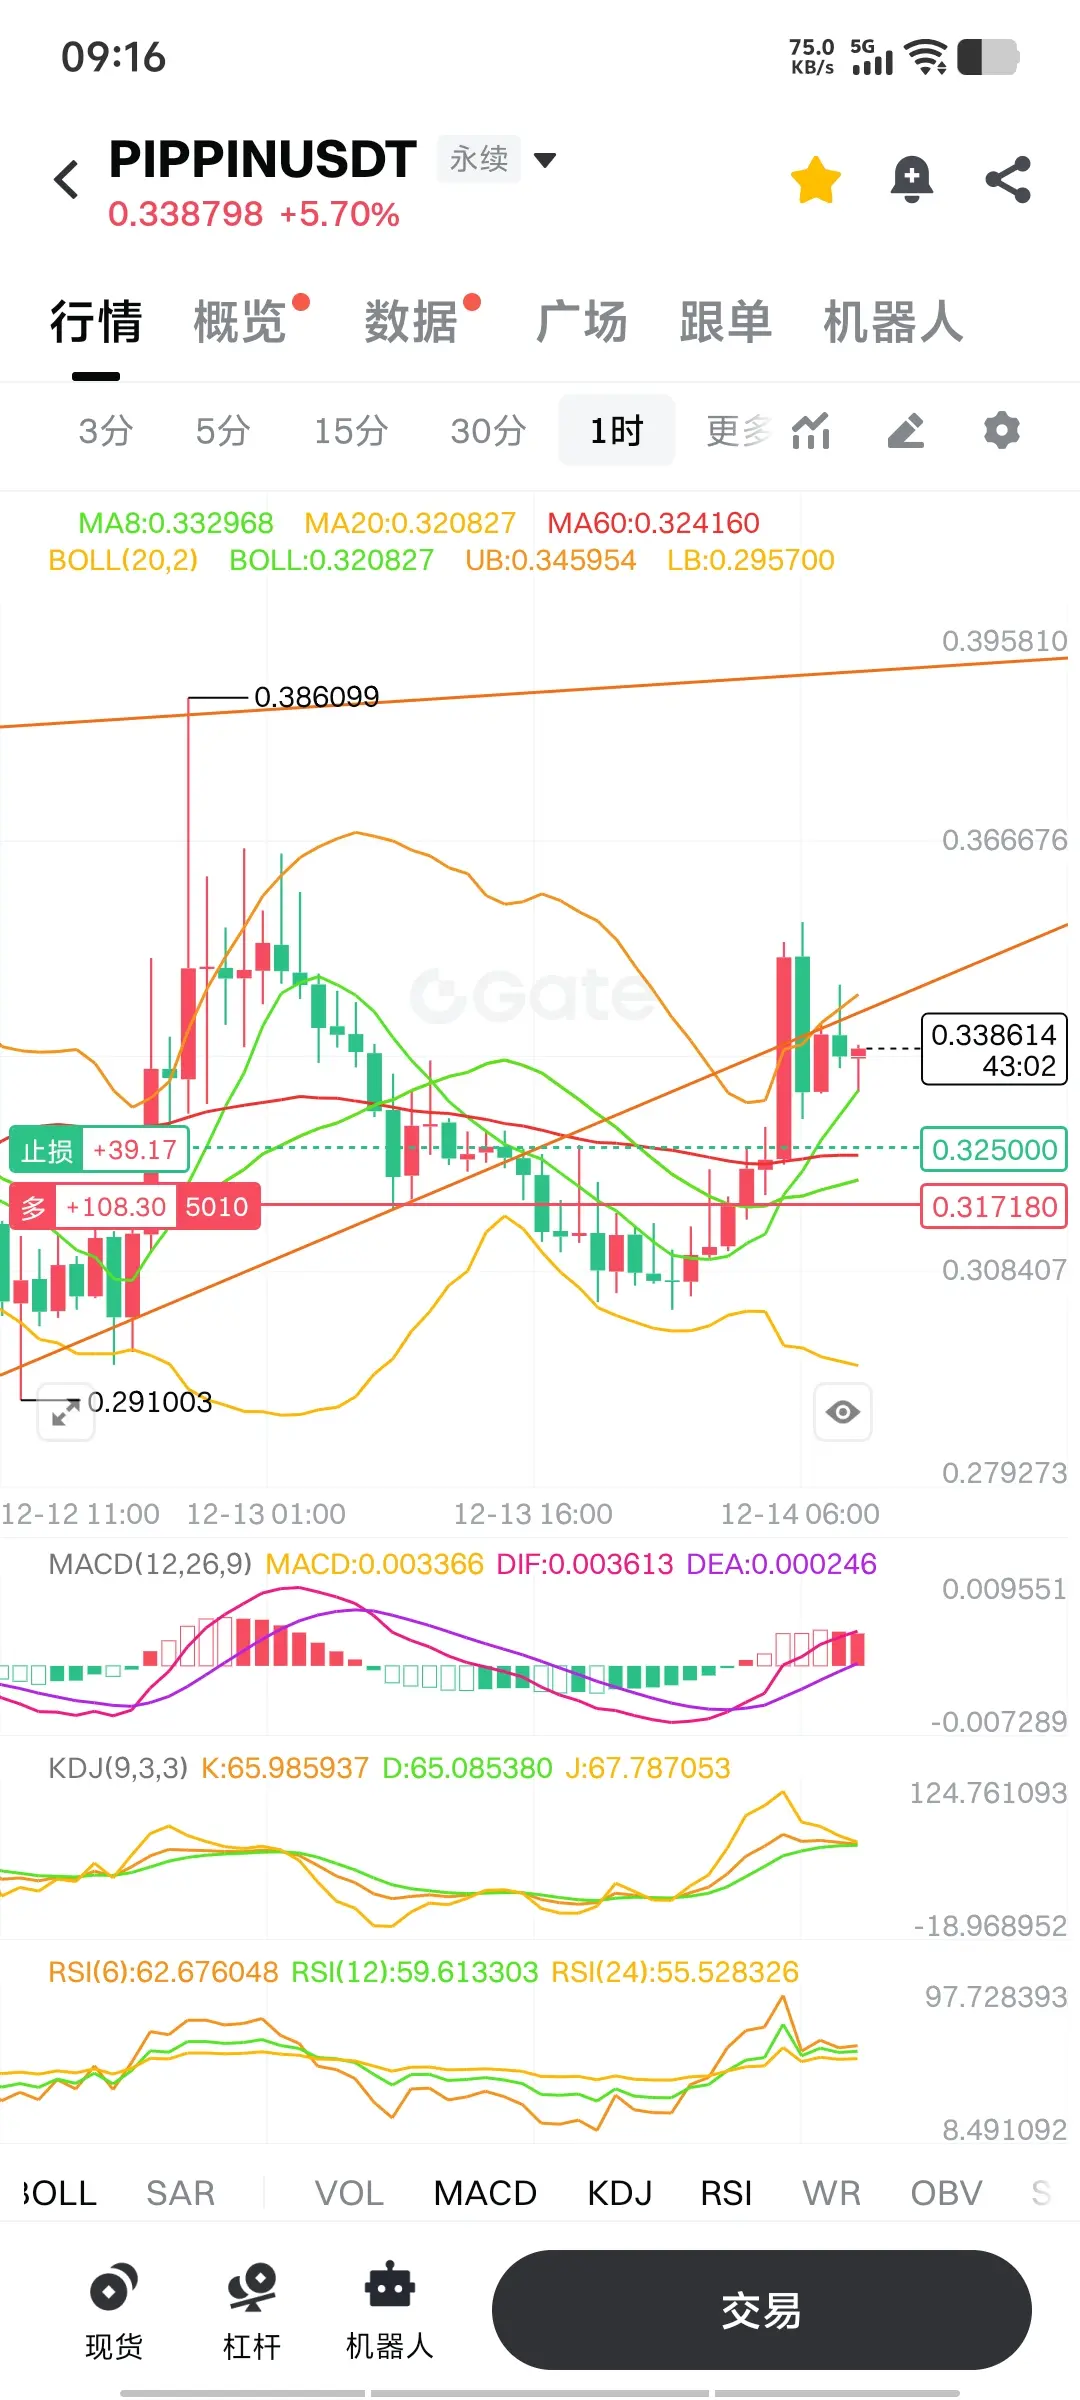
1. First Support Level: $3170.35
2. Second Support Level: $3188.30 (Bollinger Lower Band)
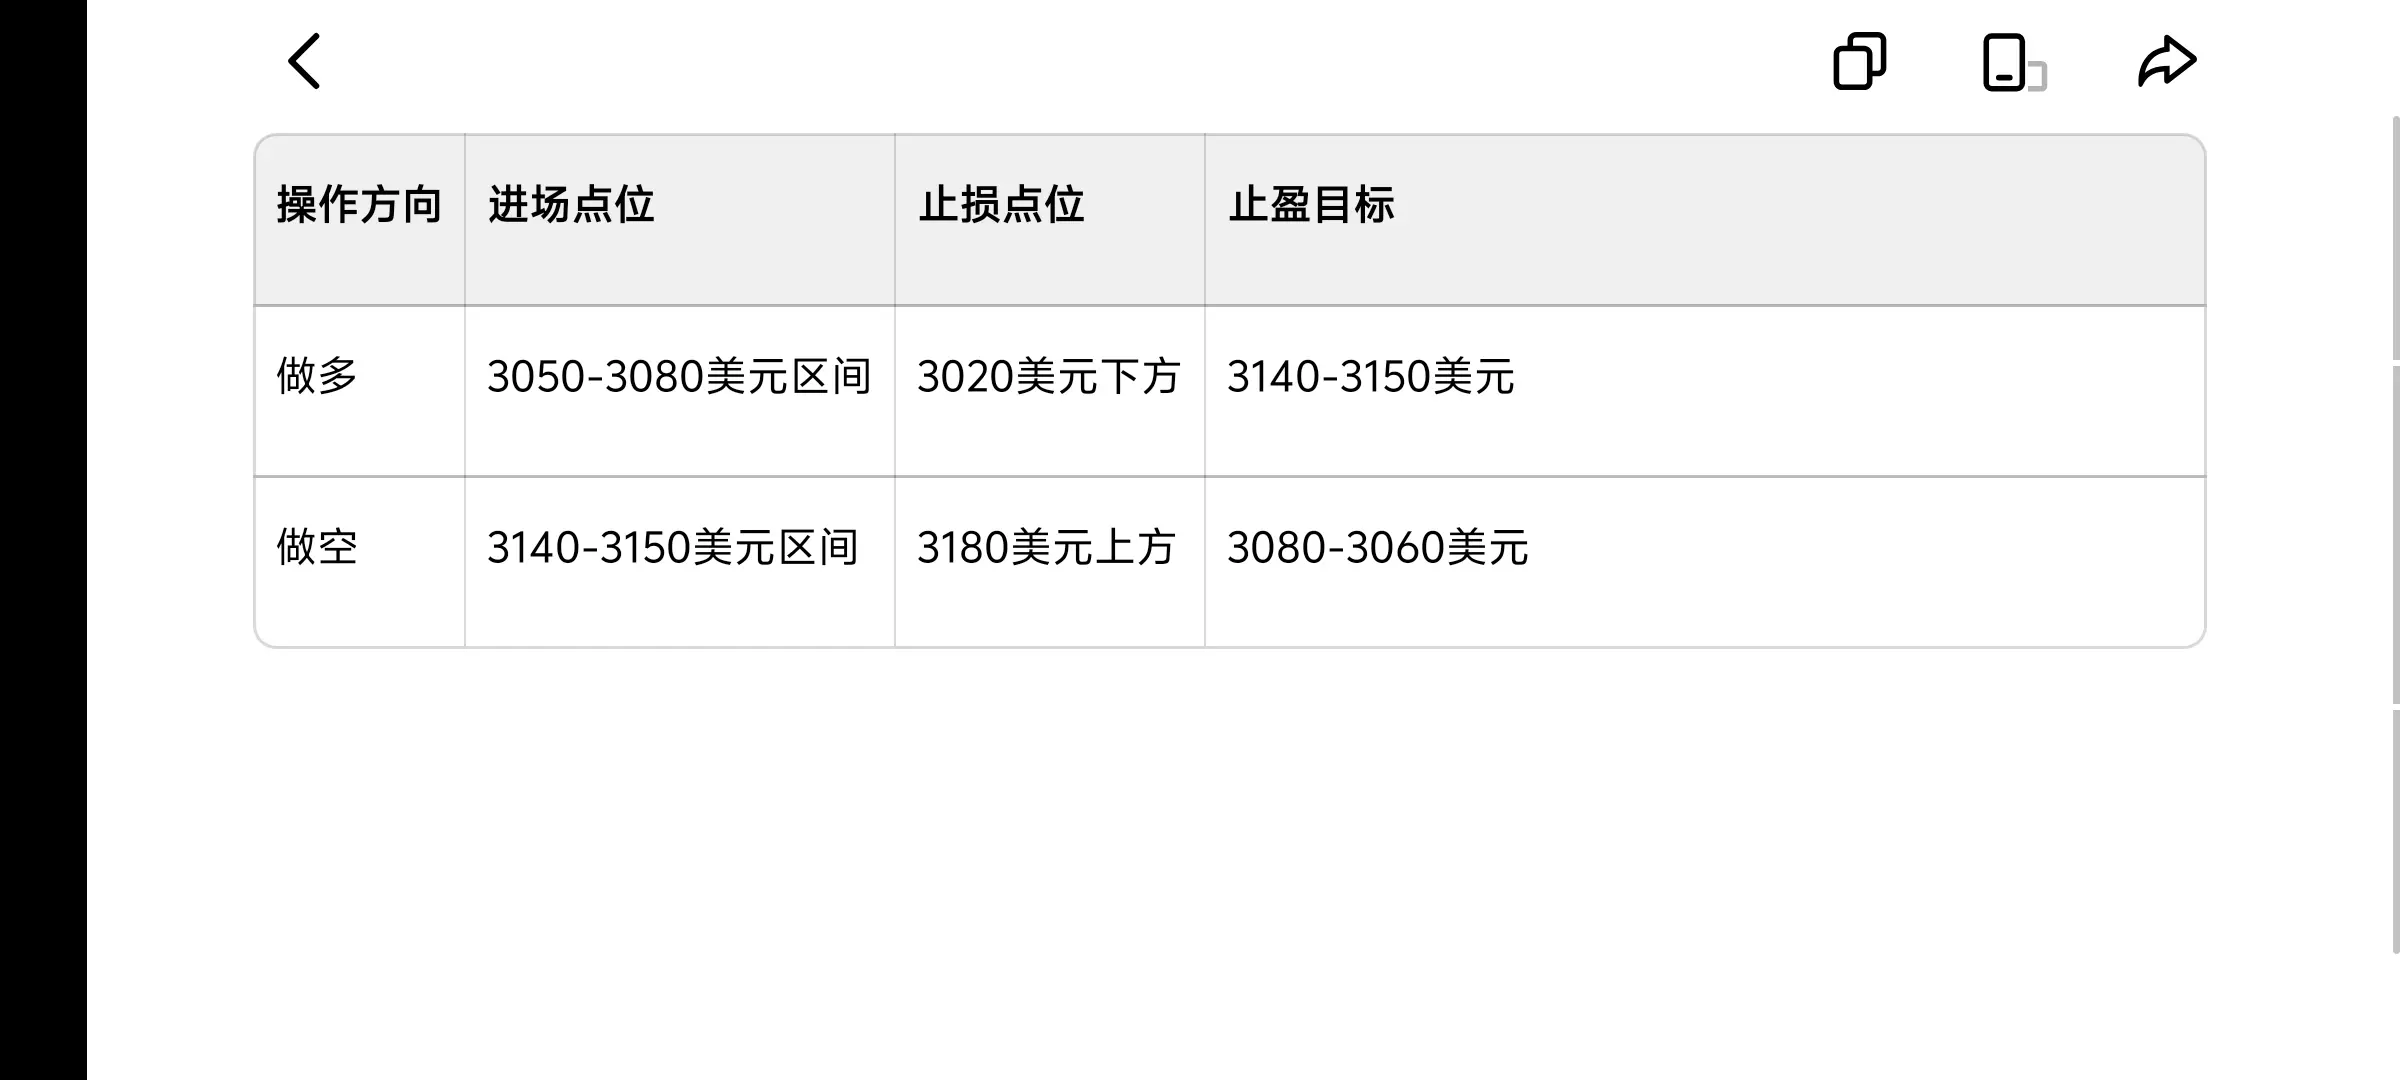
#广场发帖领$50
III. Trading Strategy Suggestions
Long Strategy
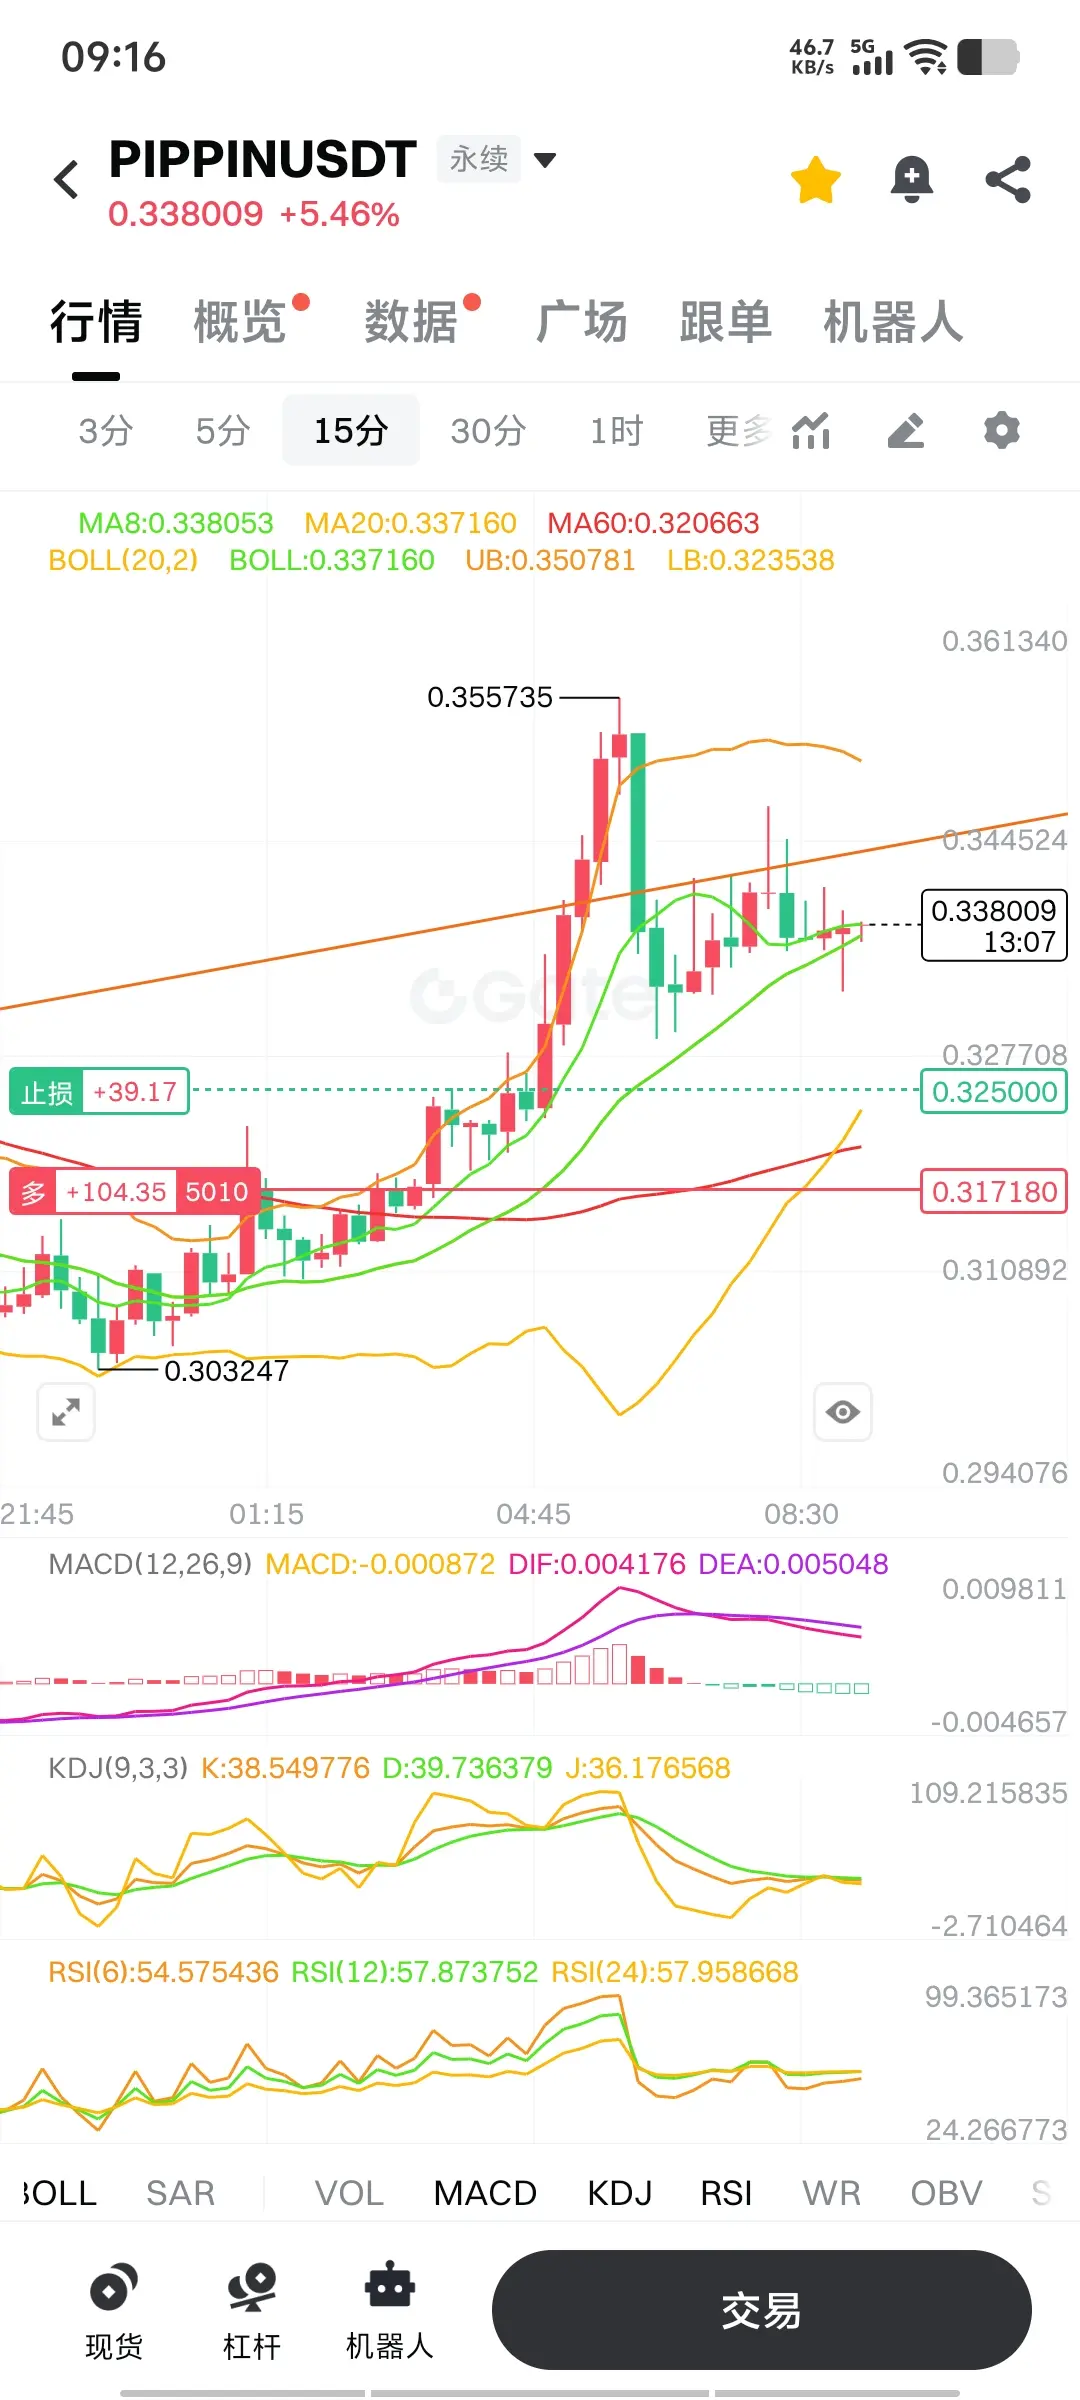
- Conservative Entry Point: $3170-$3190 range, stop loss set below $3080, target set at $3250-$3300, and upon breakout, aim for $3360.
- Technical Basis: RSI(6) has fallen to 24.52 in the oversold zone, and the KDJ indicator J value at 12.56 i
ETH-4.74%
View Original
[The user has shared his/her trading data. Go to the App to view more.]
  • Reward
  • Comment
  • Repost
  • Share
#参与创作者认证计划月领$10,000 is out of the short market, and the bulls are ready to move! The support of 3300 is already very consolidated. The next target stands firm at 3368 and goes straight to 3500. $ETH
ETH-4.74%
View Original
[The user has shared his/her trading data. Go to the App to view more.]
  • Reward
  • Comment
  • Repost
  • Share
#参与创作者认证计划月领$10,000 short-term operation (intraday):

-Long opportunity: If ETH falls back to the pivot point of 3310-3300 USDT and stabilizes, you can take a light long position and set a stop loss of 3282 USDT, with a target of 3334 USDT (R1 resistance) first, and then look up at 3363 USDT (R2) after breaking through.

- Take Profit/Short Opportunities: If ETH rises to 3363-3386 USDT and there is a reversal pattern such as a long upper shadow or short engulfment, you can place long take profit in batches or test short positions with a stop loss of 3400 USDT and a target of 3334-3310 USDT.
ETH-4.74%
View Original
  • Reward
  • Comment
  • Repost
  • Share
$ETH #参与创作者认证计划月领$10,000 ‌Overall Trend: Today, ETH first surged to 3396 USDT before pulling back. Currently, the price is fluctuating around 3312.27 USDT, down about 2.5% from the intraday high, which constitutes a technical correction after the rally.
- Candlestick Pattern: On the 4-hour chart, a bearish combination has formed with several consecutive small red candles, and the price has fallen below the MA8 (3321.51 USDT), indicating weakening short-term bullish momentum. The middle band of the Bollinger Bands (3324.35 USDT) has become the key resistance level, while the lower band (3300 U
ETH-4.74%
View Original
post-image
  • Reward
  • Comment
  • Repost
  • Share
  • Trending TopicsView More
  • Pin
Trade Crypto Anywhere Anytime
qrCode
Scan to download Gate App
Community
  • 简体中文
  • English
  • Tiếng Việt
  • 繁體中文
  • Español
  • Русский
  • Français (Afrique)
  • Português (Portugal)
  • Bahasa Indonesia
  • 日本語
  • بالعربية
  • Українська
  • Português (Brasil)