
【Price Trend Analysis】
1. Candlestick Patterns:
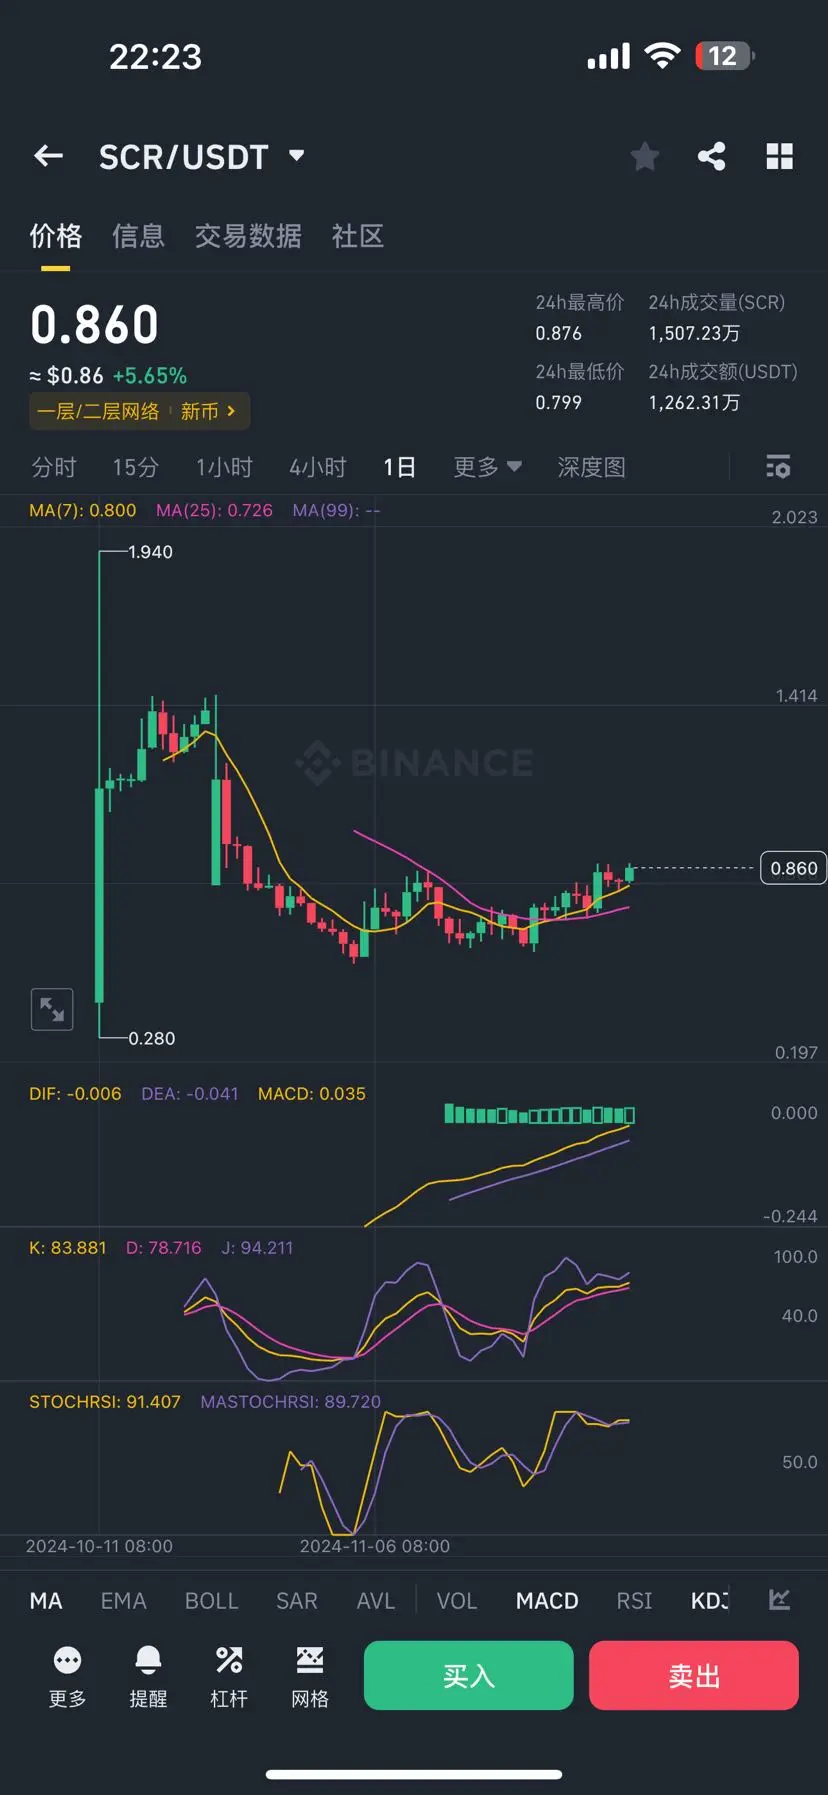
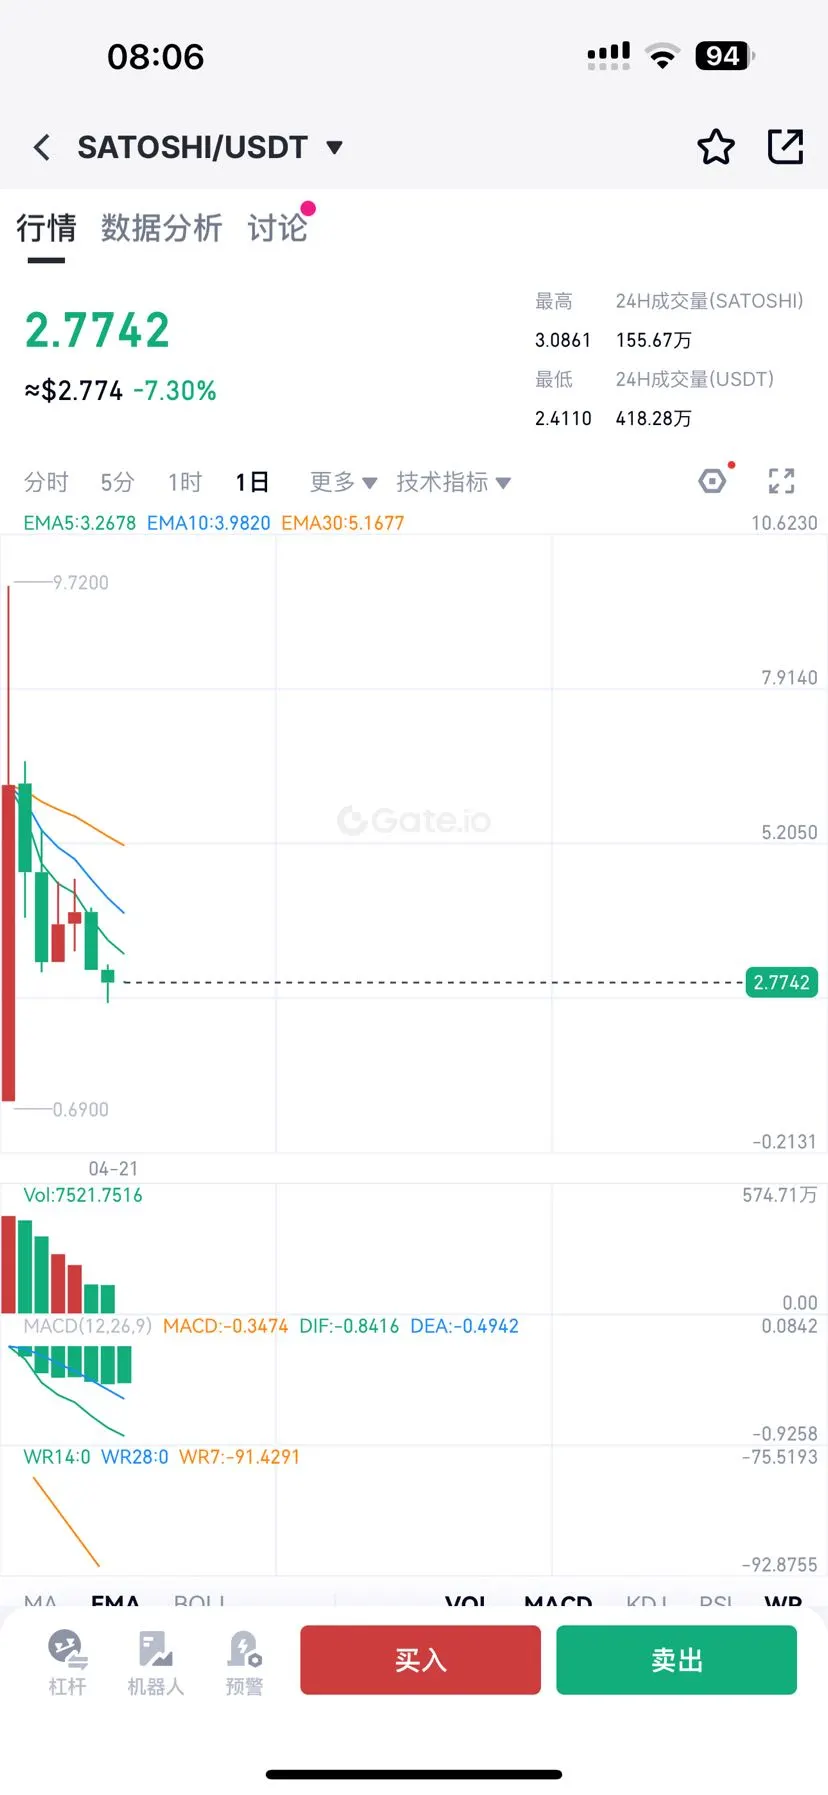
- The price has been fluctuating in the range of 3600 to 3700 recently, forming a consolidation pattern.
- On December 2nd, a candlestick with a long upper shadow appeared, indicating strong resistance above.
2. Technical Indicators:
- MACD: The current DIF and DEA are both negative values, and the MACD histogram shows green bars, indicating that the market is in a short-term bearish trend, but with signs of convergence.
- RSI: The RSI value hovers around 50, without entering overbought or oversold areas, indicating that the market does not hav
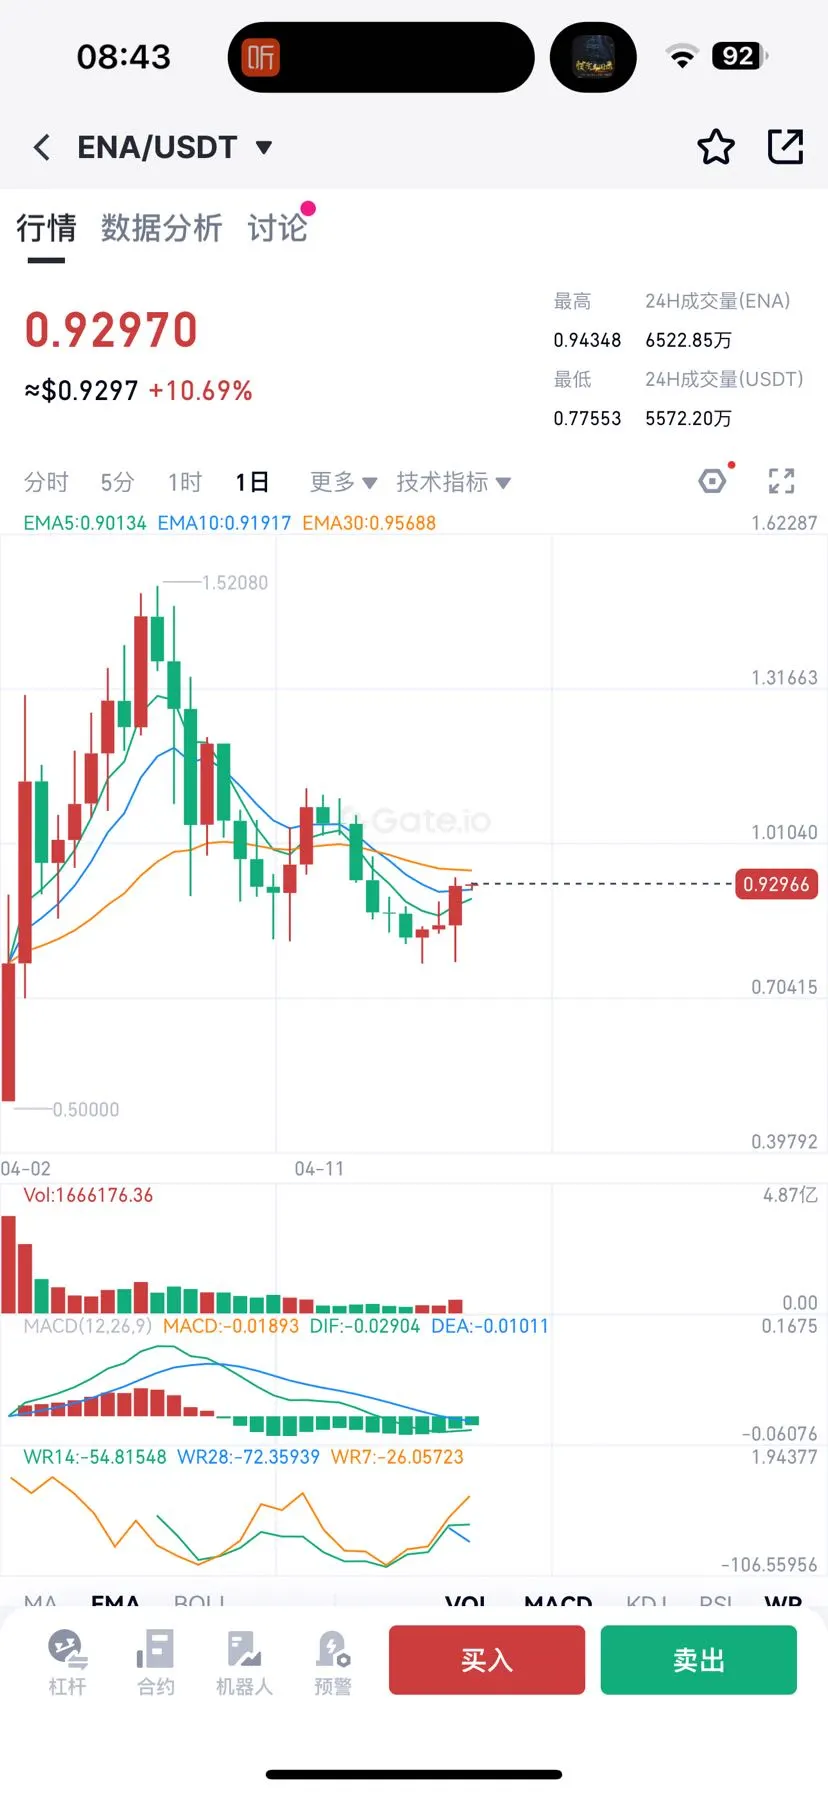
1. Candlestick Patterns:
- The price has been fluctuating in the range of 3600 to 3700 recently, forming a consolidation pattern.
- On December 2nd, a candlestick with a long upper shadow appeared, indicating strong resistance above.
2. Technical Indicators:
- MACD: The current DIF and DEA are both negative values, and the MACD histogram shows green bars, indicating that the market is in a short-term bearish trend, but with signs of convergence.
- RSI: The RSI value hovers around 50, without entering overbought or oversold areas, indicating that the market does not hav
ETH2,47%