Trade
Trading Type
Spot
Trade crypto freely
Pre-Market
Trade new tokens before they are officially listed
Margin
Magnify your profit with leverage
Convert & Block Trading
0 Fees
Trade any size with no fees and no slippage
Alpha
Points
Get promising tokens in streamlined on-chain trading
Leveraged Tokens
Get exposure to leveraged positions simply
Futures
Futures
Hundreds of contracts settled in USDT or BTC
Options
HOT
Trade European-style vanilla options
Unified Account
Maximize your capital efficiency
Demo Trading
Futures Kickoff
Get prepared for your futures trading
Futures Events
Participate in events to win generous rewards
Demo Trading
Use virtual funds to experience risk-free trading
Earn
Launch
CandyDrop
Collect candies to earn airdrops
Launchpool
Quick staking, earn potential new tokens
HODLer Airdrop
Hold GT and get massive airdrops for free
Launchpad
Be early to the next big token project
Alpha Points
NEW
Trade on-chain assets and enjoy airdrop rewards!
Futures Points
NEW
Earn futures points and claim airdrop rewards
Investment
Simple Earn
Earn interests with idle tokens
Auto-Invest
Auto-invest on a regular basis
Dual Investment
Buy low and sell high to take profits from price fluctuations
Soft Staking
Earn rewards with flexible staking
Crypto Loan
0 Fees
Pledge one crypto to borrow another
Lending Center
One-stop lending hub
VIP Wealth Hub
Customized wealth management empowers your assets growth
Private Wealth Management
Customized asset management to grow your digital assets
Quant Fund
Top asset management team helps you profit without hassle
Staking
Stake cryptos to earn in PoS products
Smart Leverage
NEW
No forced liquidation before maturity, worry-free leveraged gains
GUSD Minting
Use USDT/USDC to mint GUSD for treasury-level yields
More
Promotions
Activity Center
Join activities and win big cash prizes and exclusive merch
Referral
20 USDT
Earn 40% commission or up to 500 USDT rewards
Announcements
Announcements of new listings, activities, upgrades, etc
Gate Blog
Crypto industry articles
VIP Services
Huge fee discounts
Proof of Reserves
Gate promises 100% proof of reserves
# معلومات.لاتقدر.بثمن
1.99K
BasheerAlgundubi
#معلومه.تفيدك.كمتداول
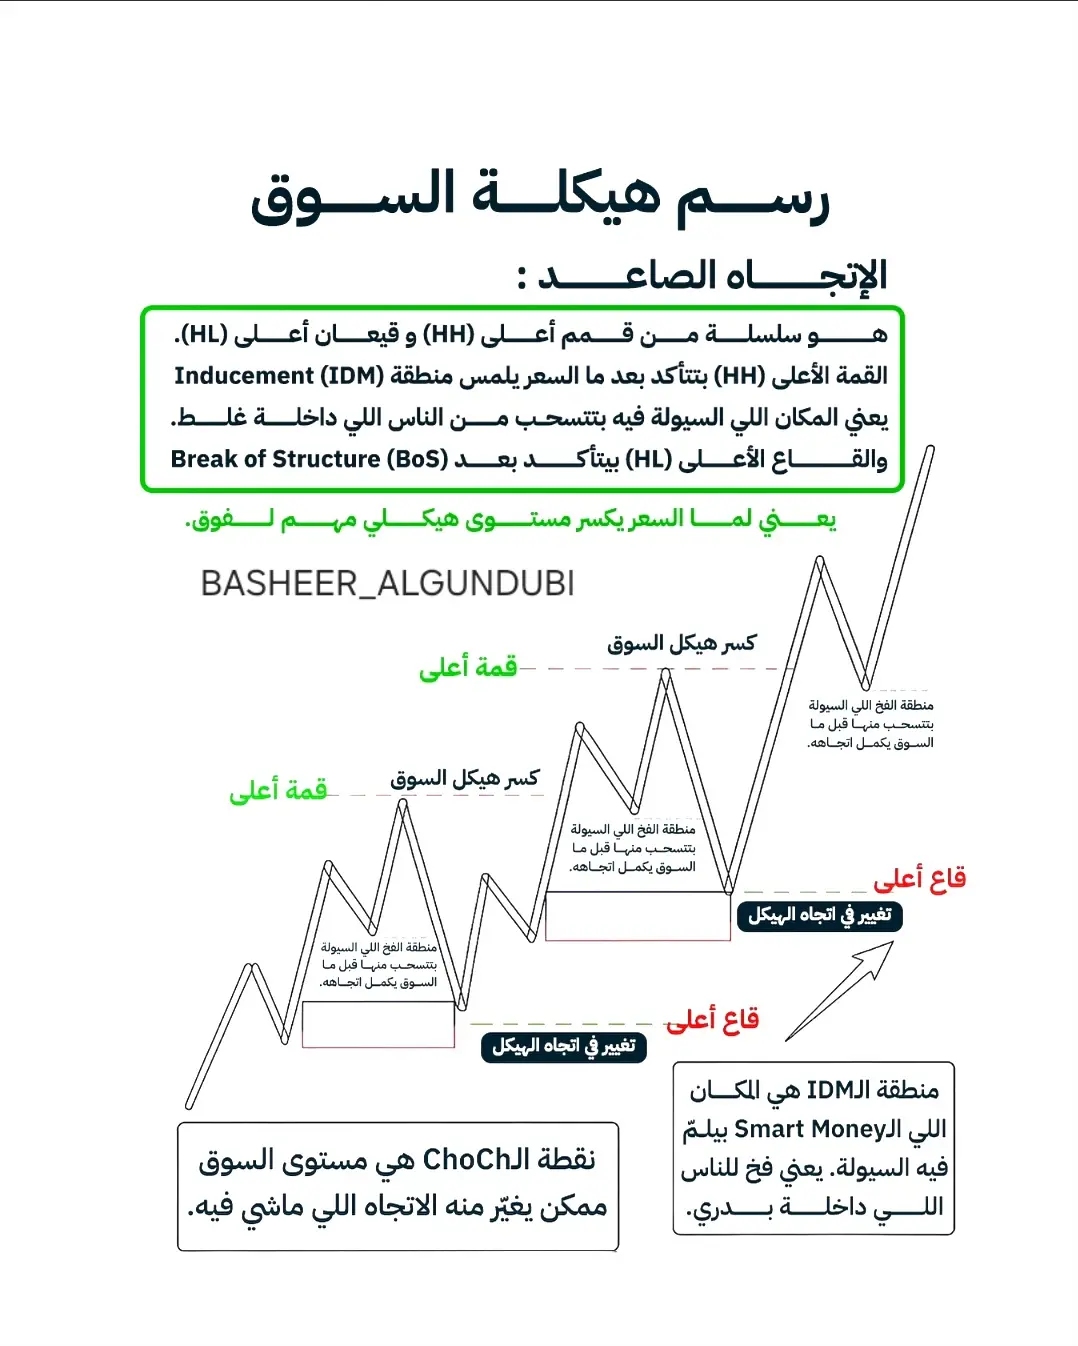
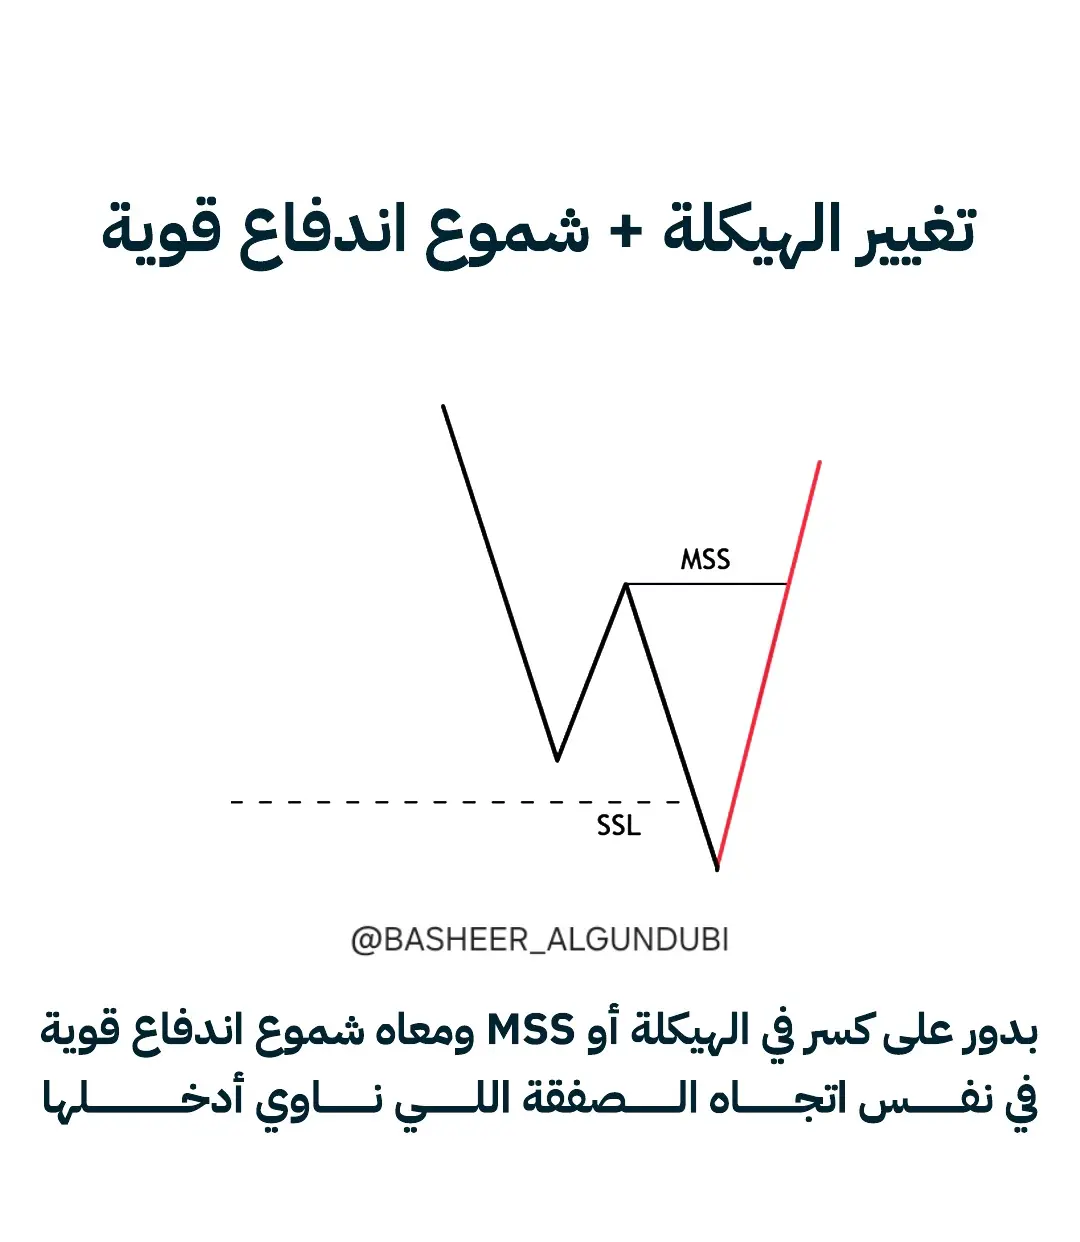
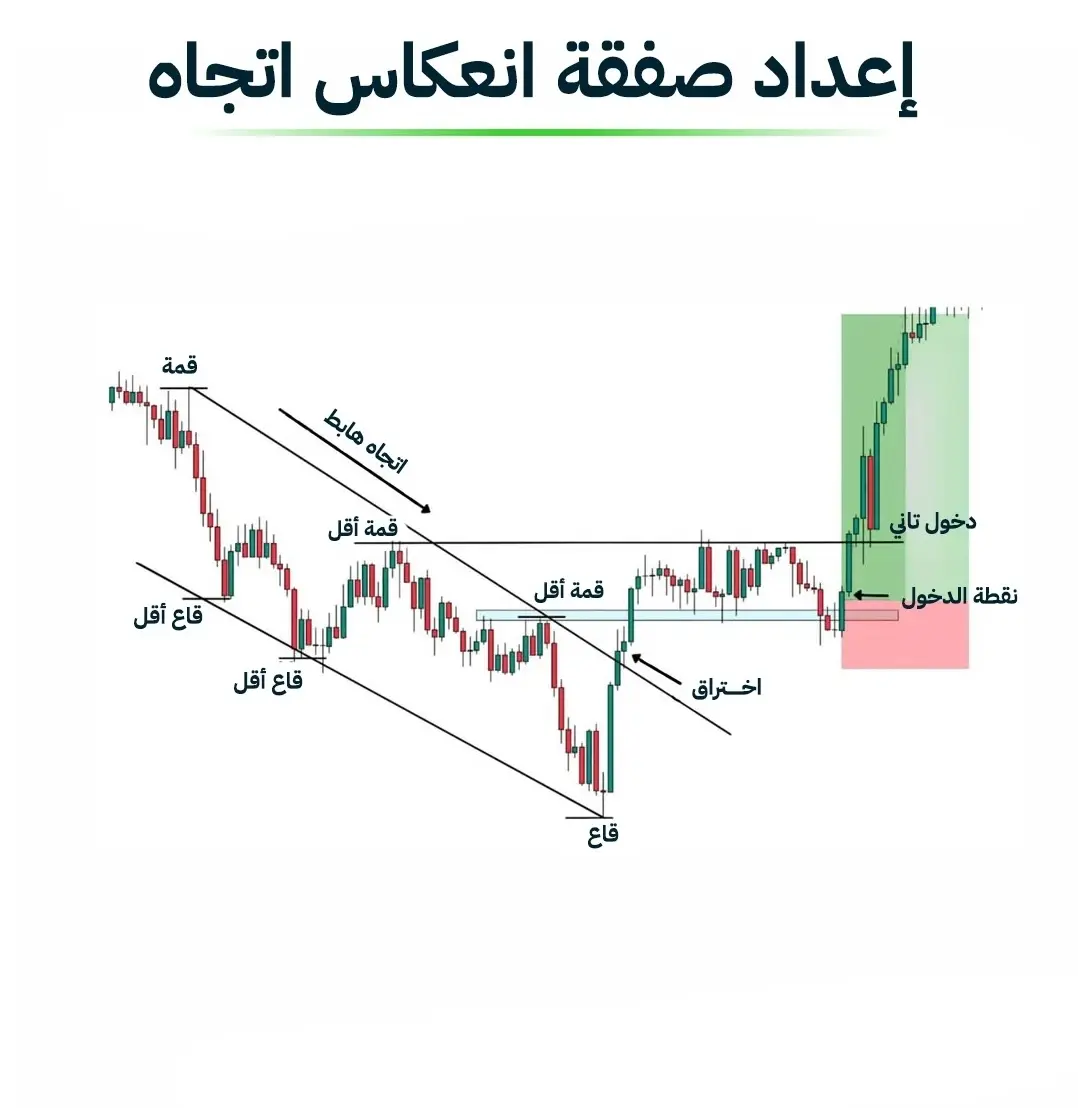
If you understand the market structure.. you will understand every price movement happening in front of you.
The most common reason that causes traders to lose is entering from the wrong places just because the price is "rising" or "falling" without understanding the true direction.
This is how you need to know what HH – HL – BoS – ChoCh – IDM means 🔥
Simply understand:
• What does upward trend mean 👆
• Break of Structure
• Where is the Smart Money area where withdrawals are made from people who entered incorrectly 📍
• When does the trend start to change ChoCh
👈
View OriginalIf you understand the market structure.. you will understand every price movement happening in front of you.
The most common reason that causes traders to lose is entering from the wrong places just because the price is "rising" or "falling" without understanding the true direction.
This is how you need to know what HH – HL – BoS – ChoCh – IDM means 🔥
Simply understand:
• What does upward trend mean 👆
• Break of Structure
• Where is the Smart Money area where withdrawals are made from people who entered incorrectly 📍
• When does the trend start to change ChoCh
👈
- Reward
- 3
- 1
- Repost
- Share
BasheerAlgundubi:
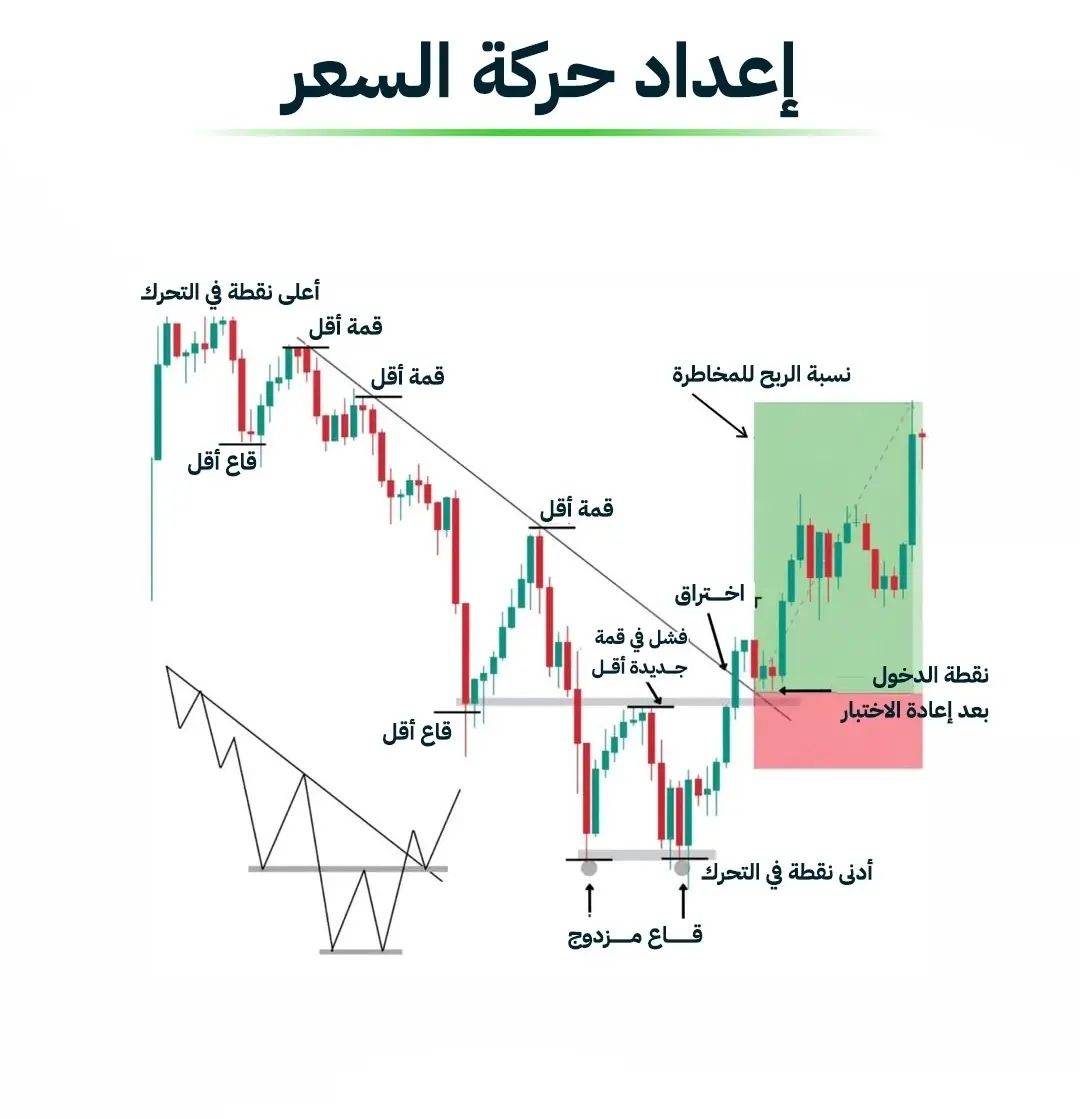
Priceless information to learn👌One of the best ways to enter trading.
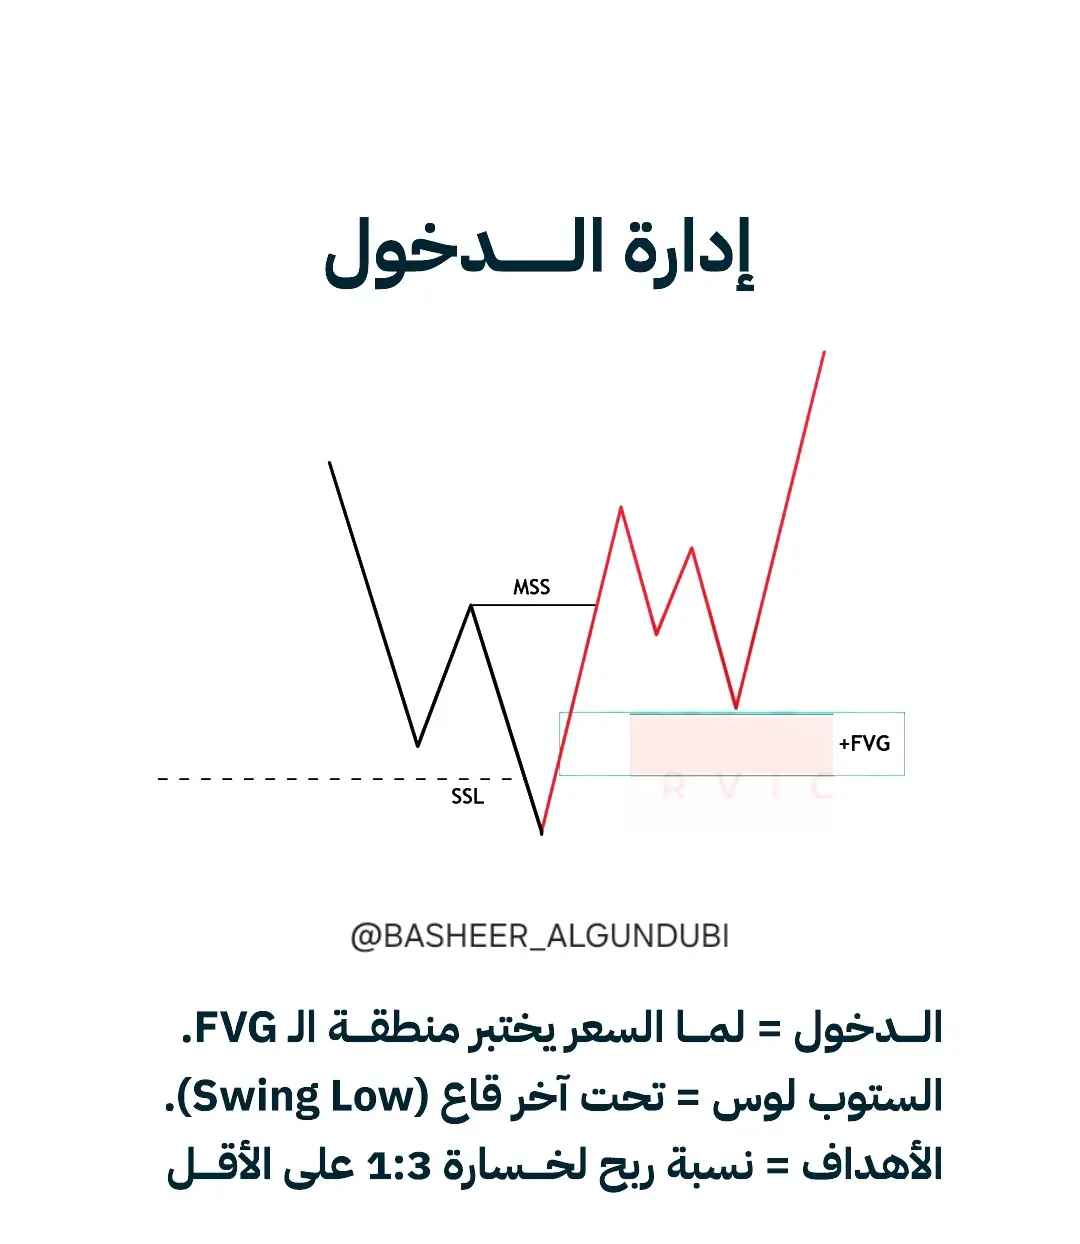
Most losses are not because of bad analysis…
But because the entry was made too early 👀
The market doesn’t move like that simply.
First, it consolidates orders
And then it decides where to go.
What appears on the chart 👇
• Break of a high or low
• A quick move that tricks the impatient
• Then the real trend appears
📌 The right entry is not at the first move
📌 Nor at the first candle
📌 The right entry is after the market has finished its game
When you wait:
✔️ The picture becomes clearer
✔️ The stop becomes reasonable
✔️ The decision becomes calmer
Tr
View OriginalMost losses are not because of bad analysis…
But because the entry was made too early 👀
The market doesn’t move like that simply.
First, it consolidates orders
And then it decides where to go.
What appears on the chart 👇
• Break of a high or low
• A quick move that tricks the impatient
• Then the real trend appears
📌 The right entry is not at the first move
📌 Nor at the first candle
📌 The right entry is after the market has finished its game
When you wait:
✔️ The picture becomes clearer
✔️ The stop becomes reasonable
✔️ The decision becomes calmer
Tr

- Reward
- 1
- 1
- Repost
- Share
BasheerAlgundubi:
Learn, teach, benefit, and gain knowledge#معلومات.لاتقدر.بثمن
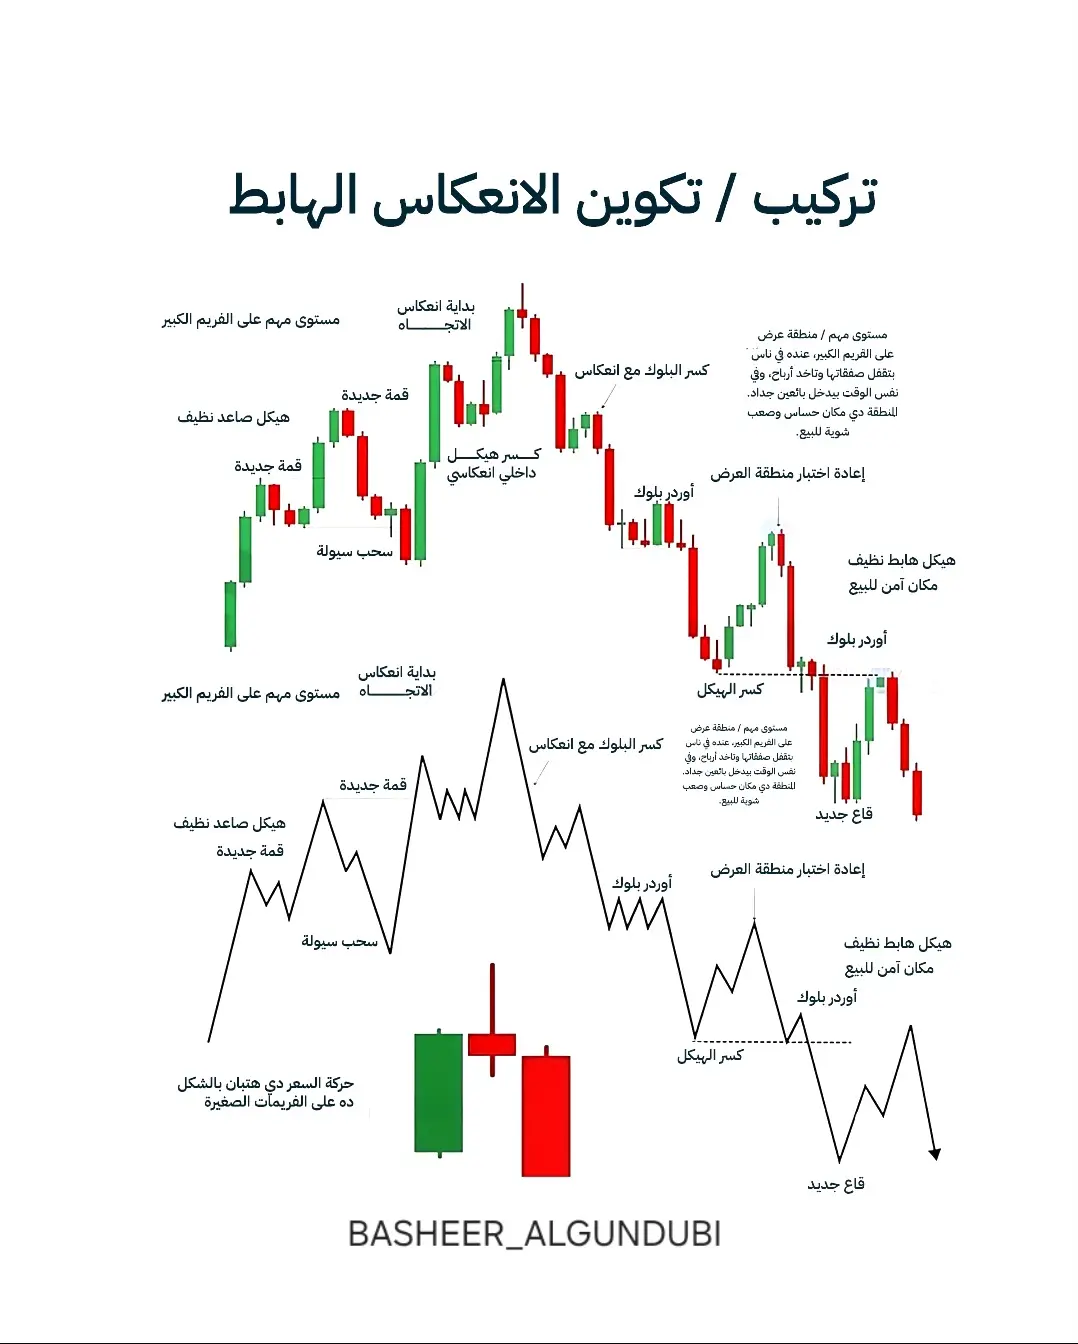
Learn how to set high-quality reflection settings.
Comment below! 💭
#معلومه.وفائده
#JoinGrowthPointsDrawToWiniPhone17
#DecemberRateCutForecast
#ReboundTokenstoWatch
$SOL
$SOL
$GT
View OriginalLearn how to set high-quality reflection settings.
Comment below! 💭
#معلومه.وفائده
#JoinGrowthPointsDrawToWiniPhone17
#DecemberRateCutForecast
#ReboundTokenstoWatch
$SOL
$SOL
$GT
- Reward
- 1
- Comment
- Repost
- Share
#معلومات.لاتقدر.بثمن
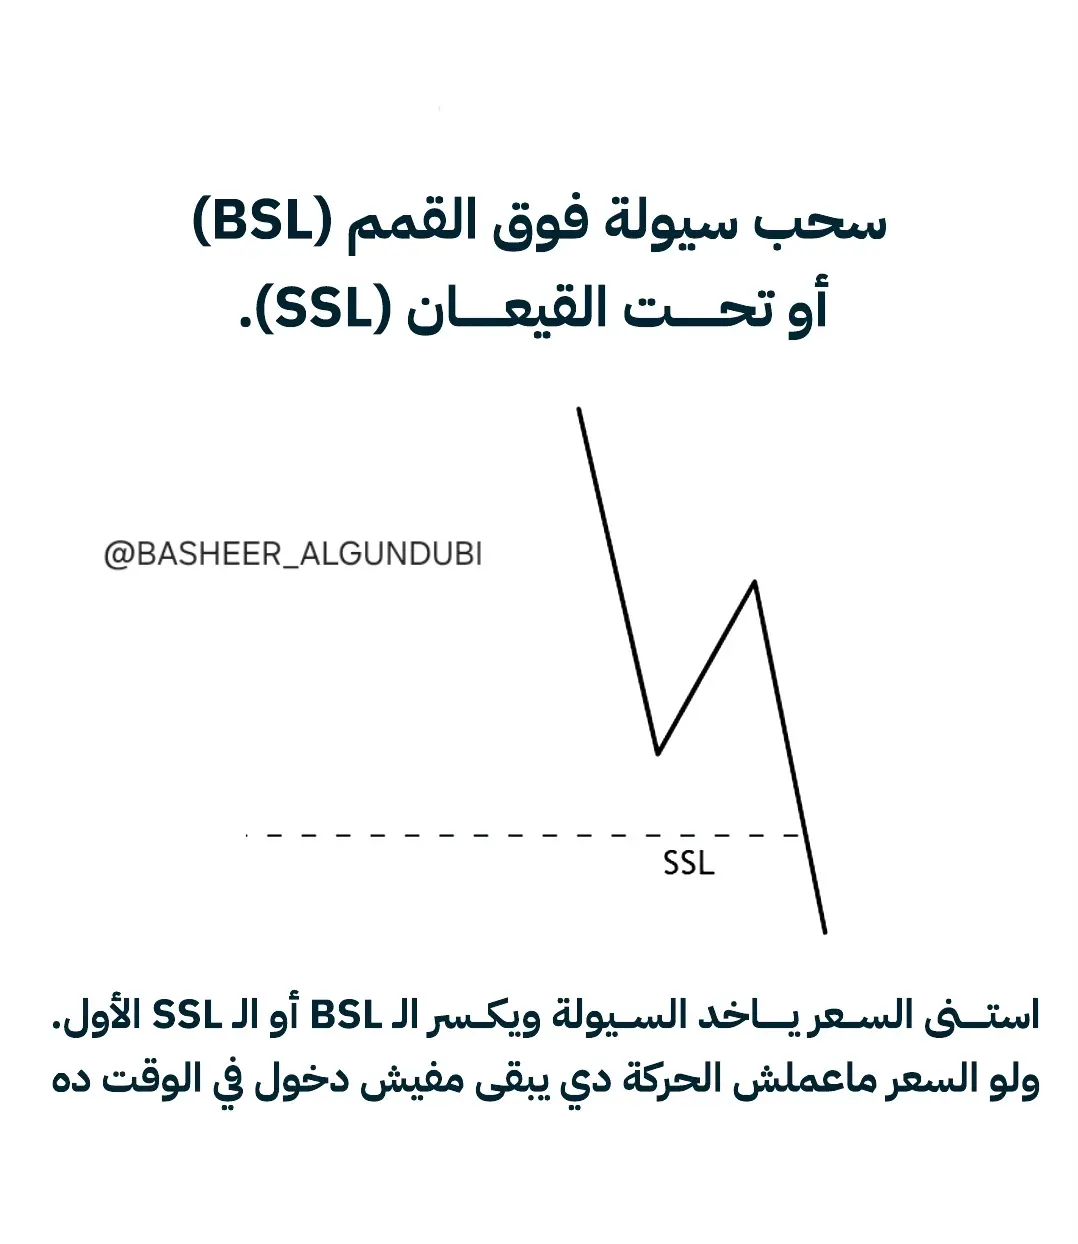
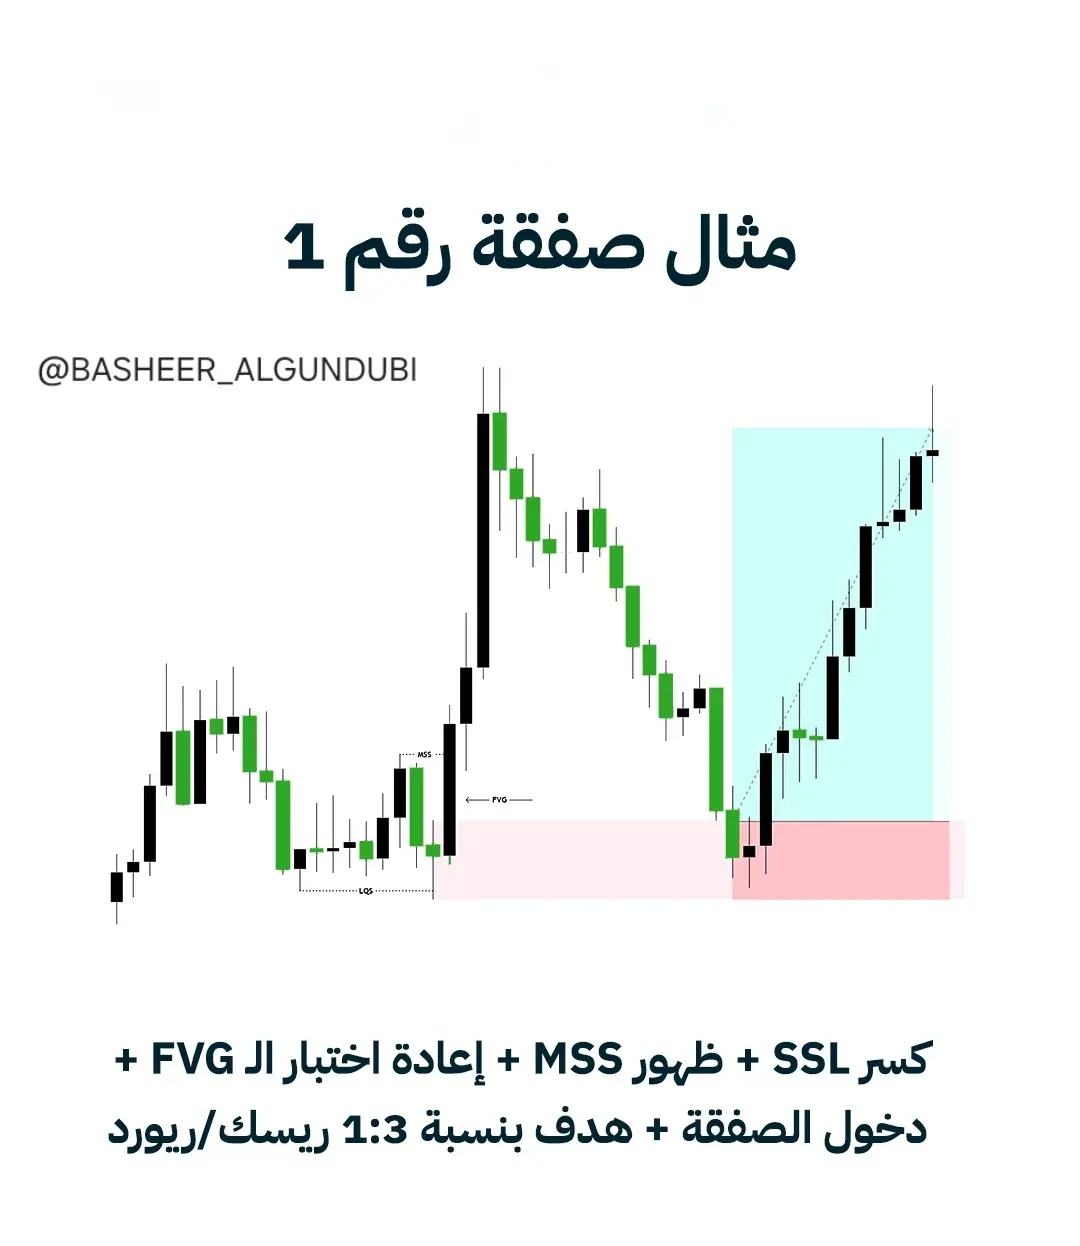
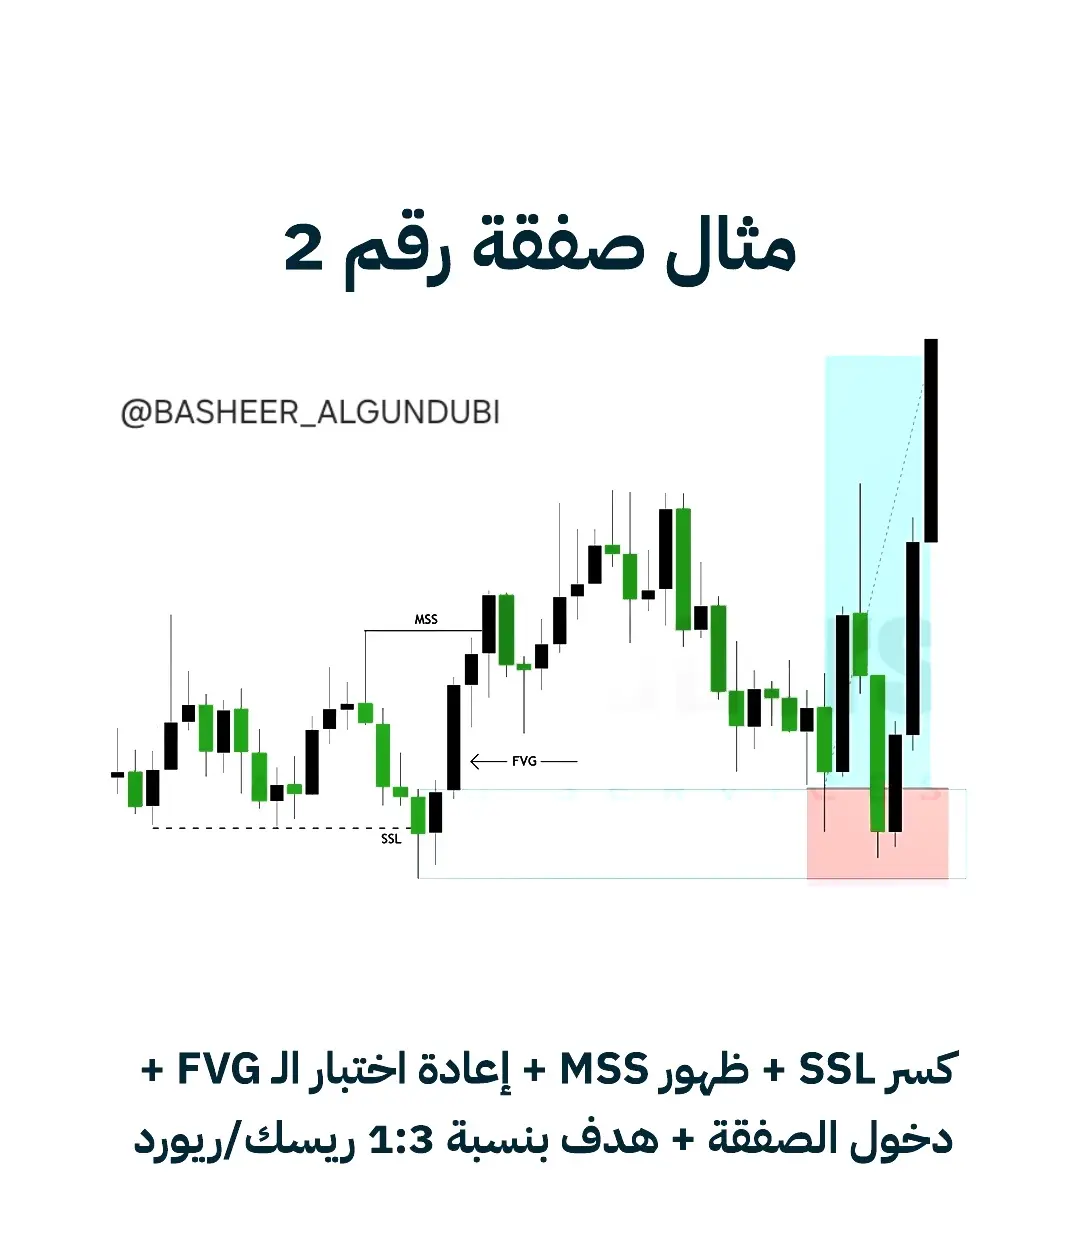
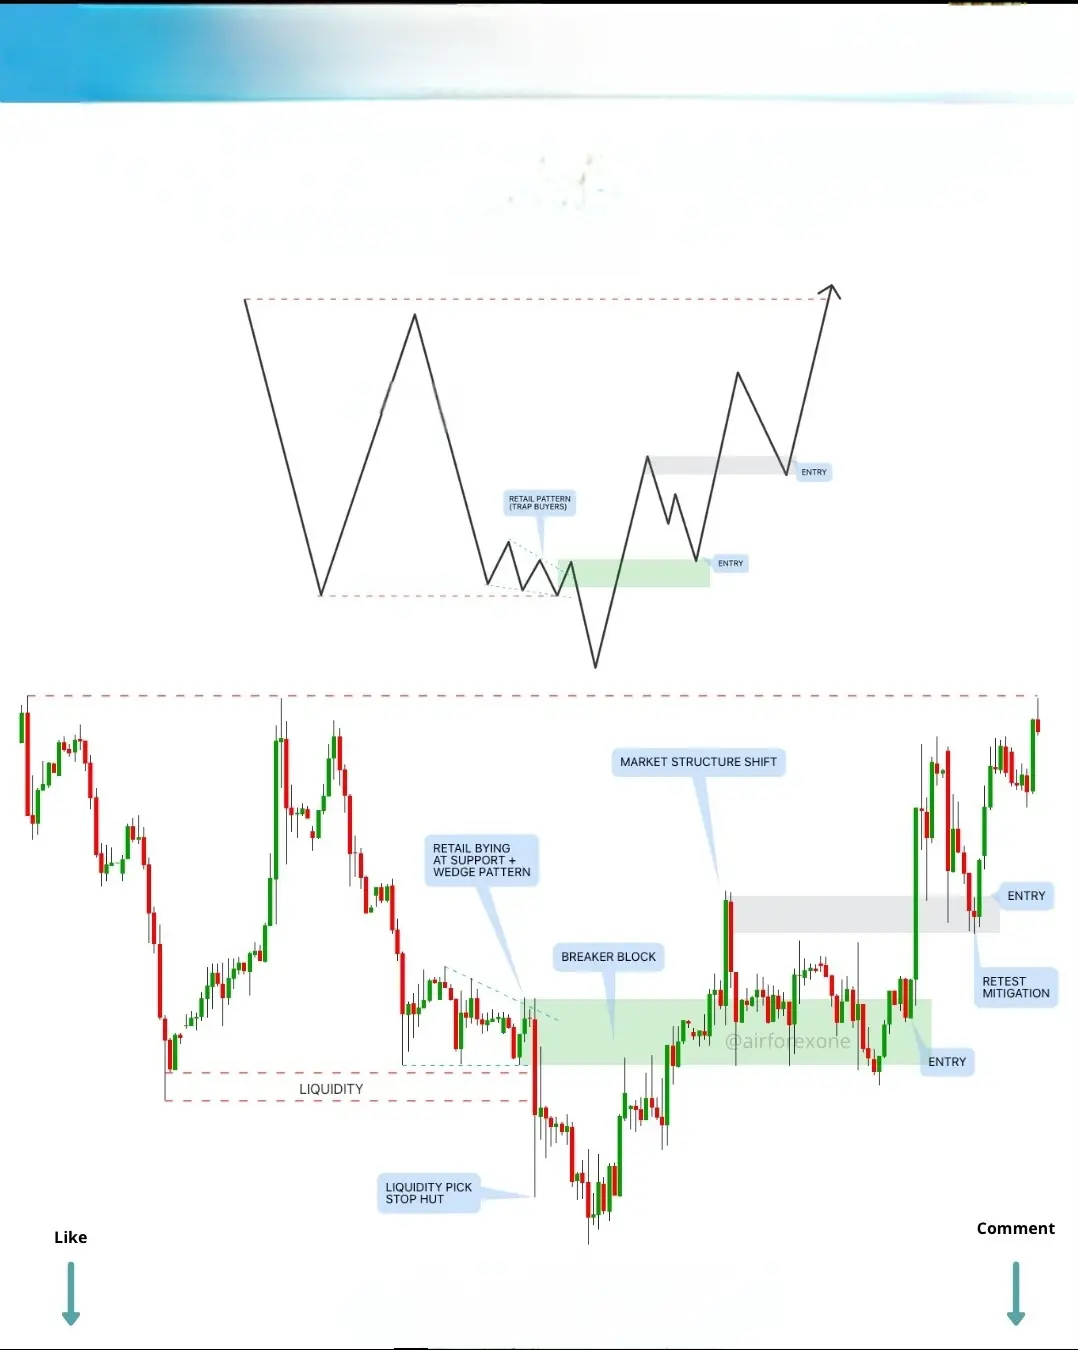
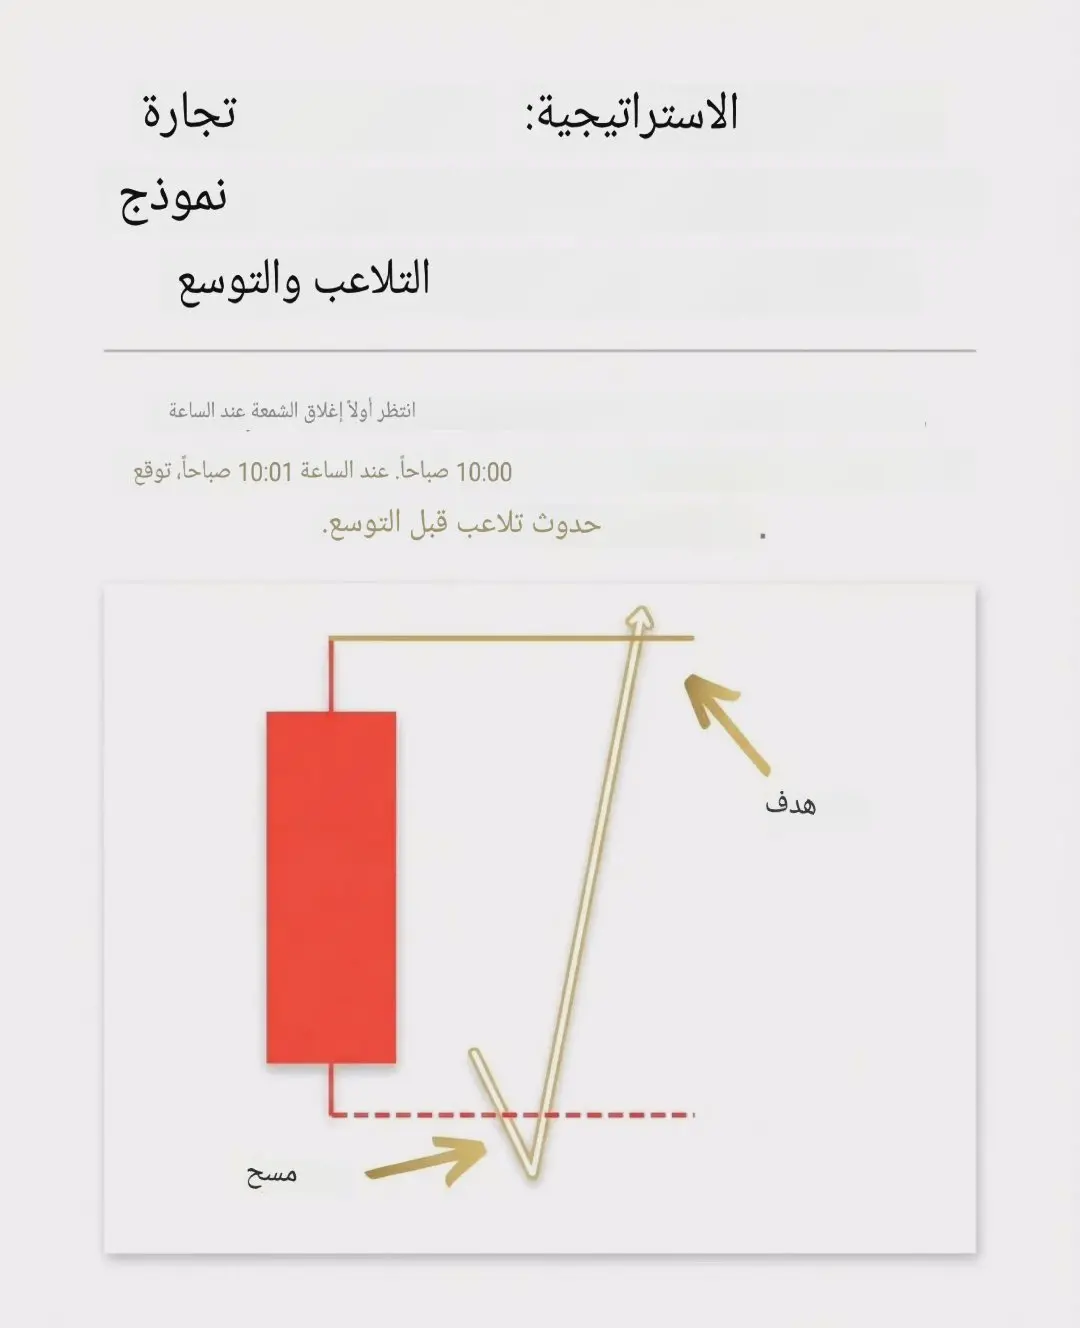
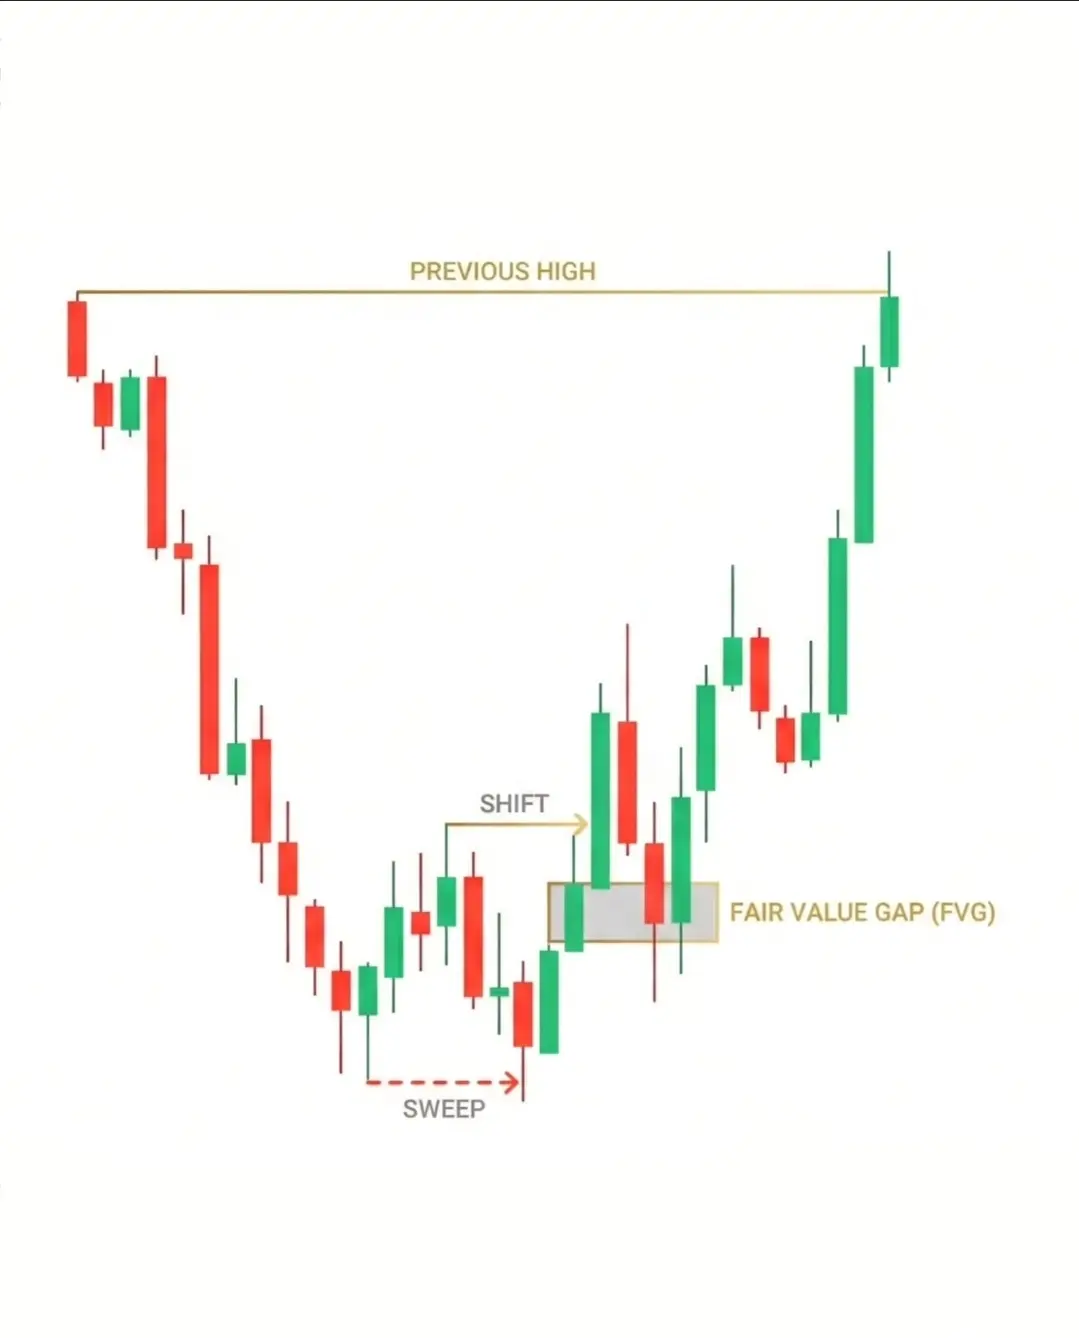
Markets do not move randomly.
Instead, they seek liquidity, then expand consciously and strategically.
Learn patience. Learn execution.
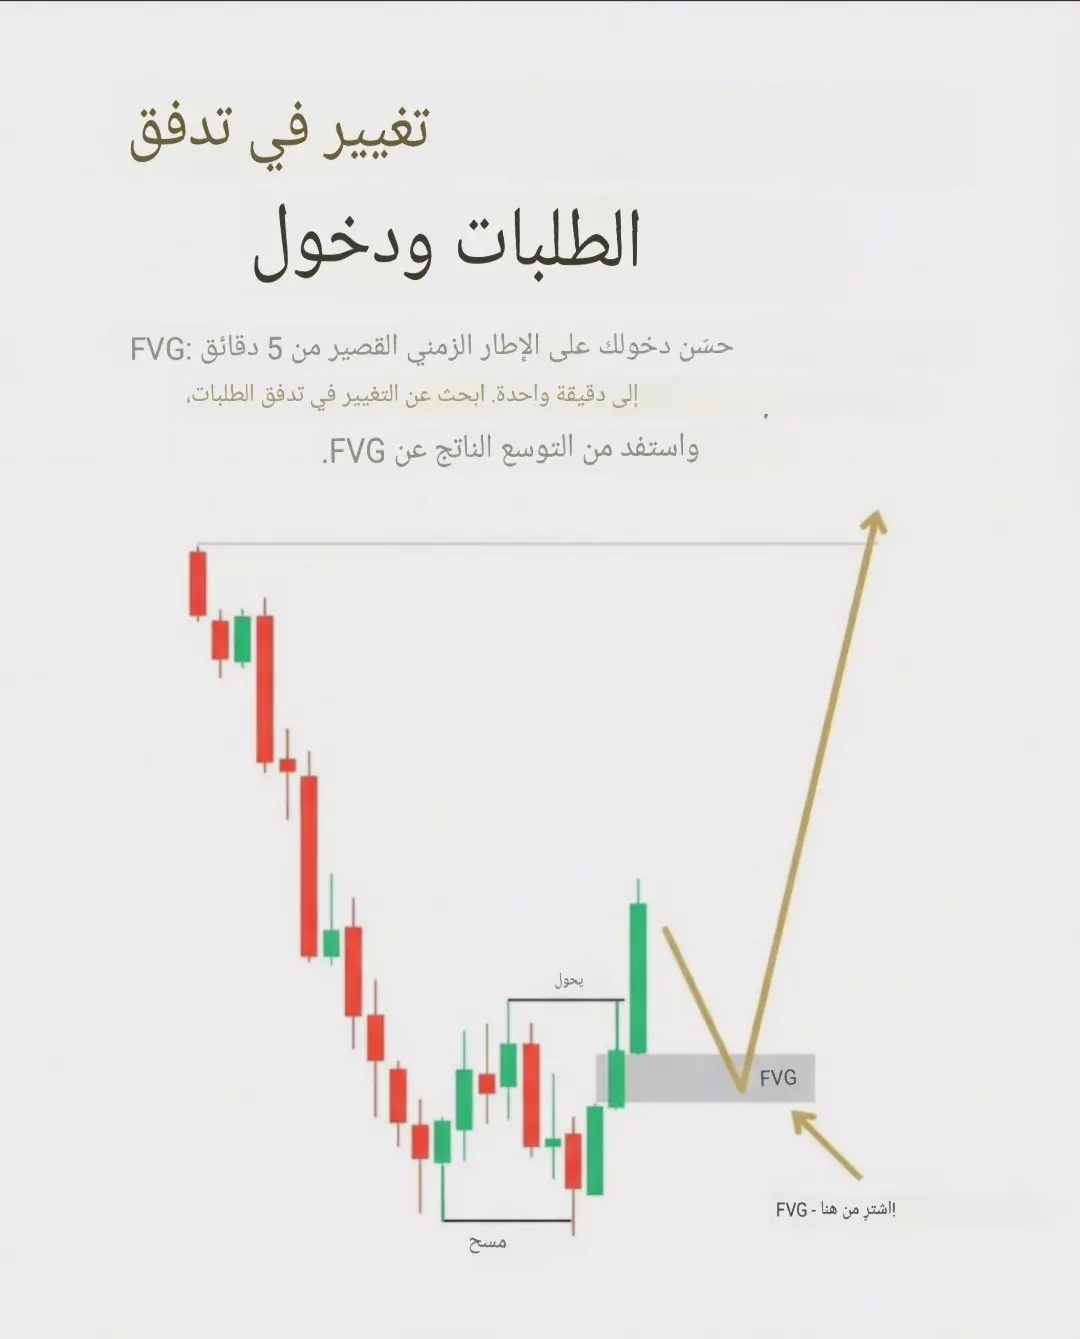
✔ Exploit liquidity on higher timeframes
✔ Shift order flow on lower timeframes
✔ Enter from the fair value gap
✔ Expand to a target on higher timeframes
Patience is not an option; it is the secret to success.
📌 Save this post so you don't forget
📌 Follow for more.
View OriginalMarkets do not move randomly.
Instead, they seek liquidity, then expand consciously and strategically.
Learn patience. Learn execution.
✔ Exploit liquidity on higher timeframes
✔ Shift order flow on lower timeframes
✔ Enter from the fair value gap
✔ Expand to a target on higher timeframes
Patience is not an option; it is the secret to success.
📌 Save this post so you don't forget
📌 Follow for more.
[The user has shared his/her trading data. Go to the App to view more.]
- Reward
- 1
- Comment
- Repost
- Share
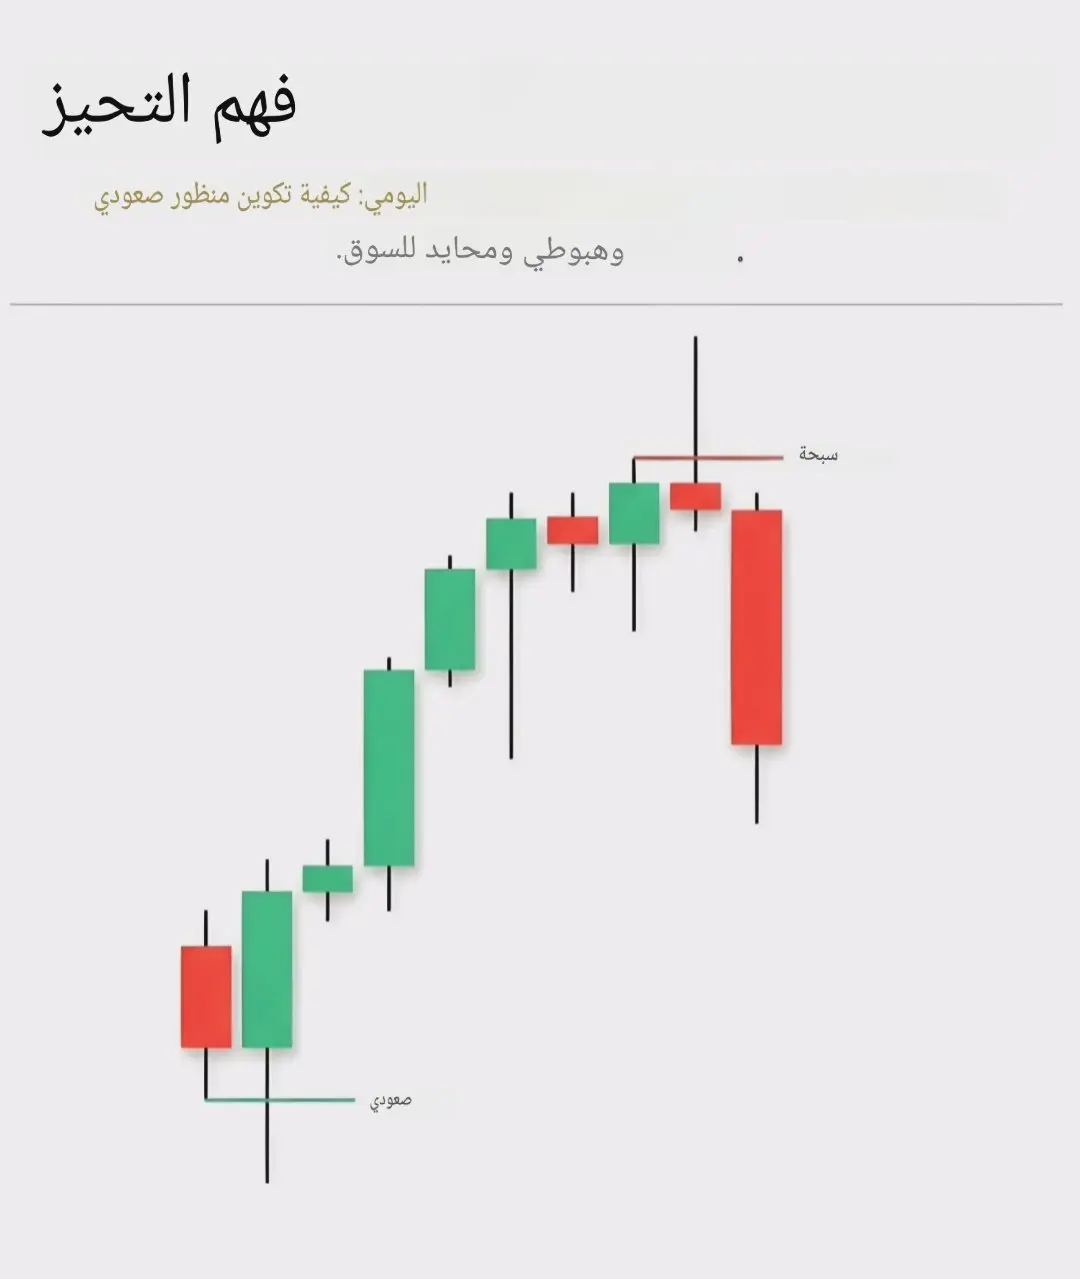
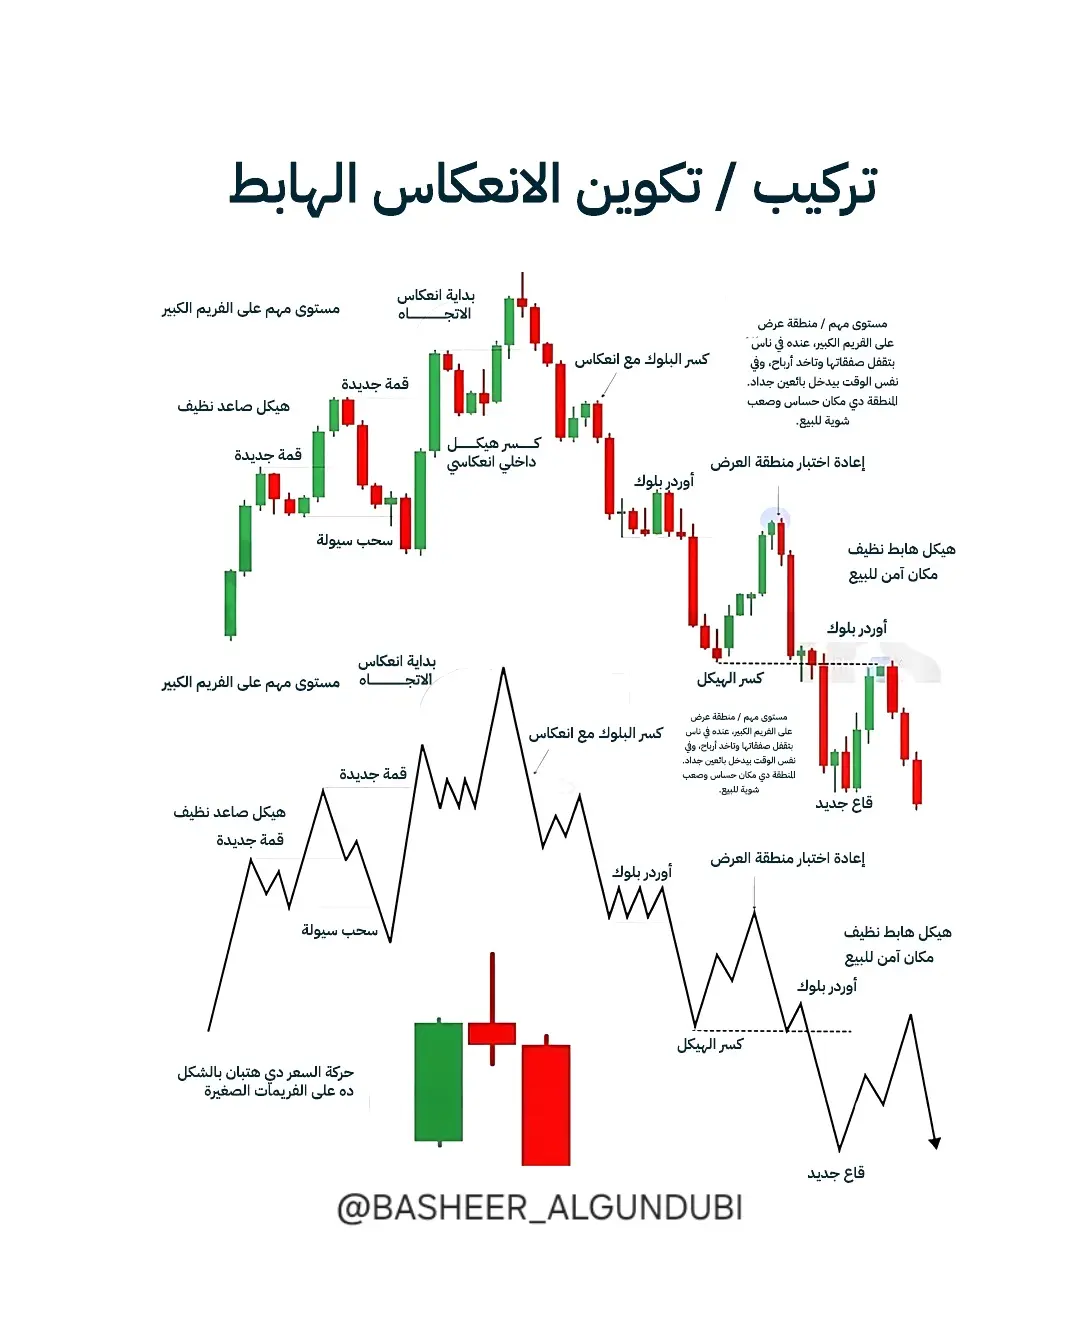
Every day, the market shows you a bullish, bearish, or just sideways trend.
The secret lies in spotting this trend early.
Here's how:
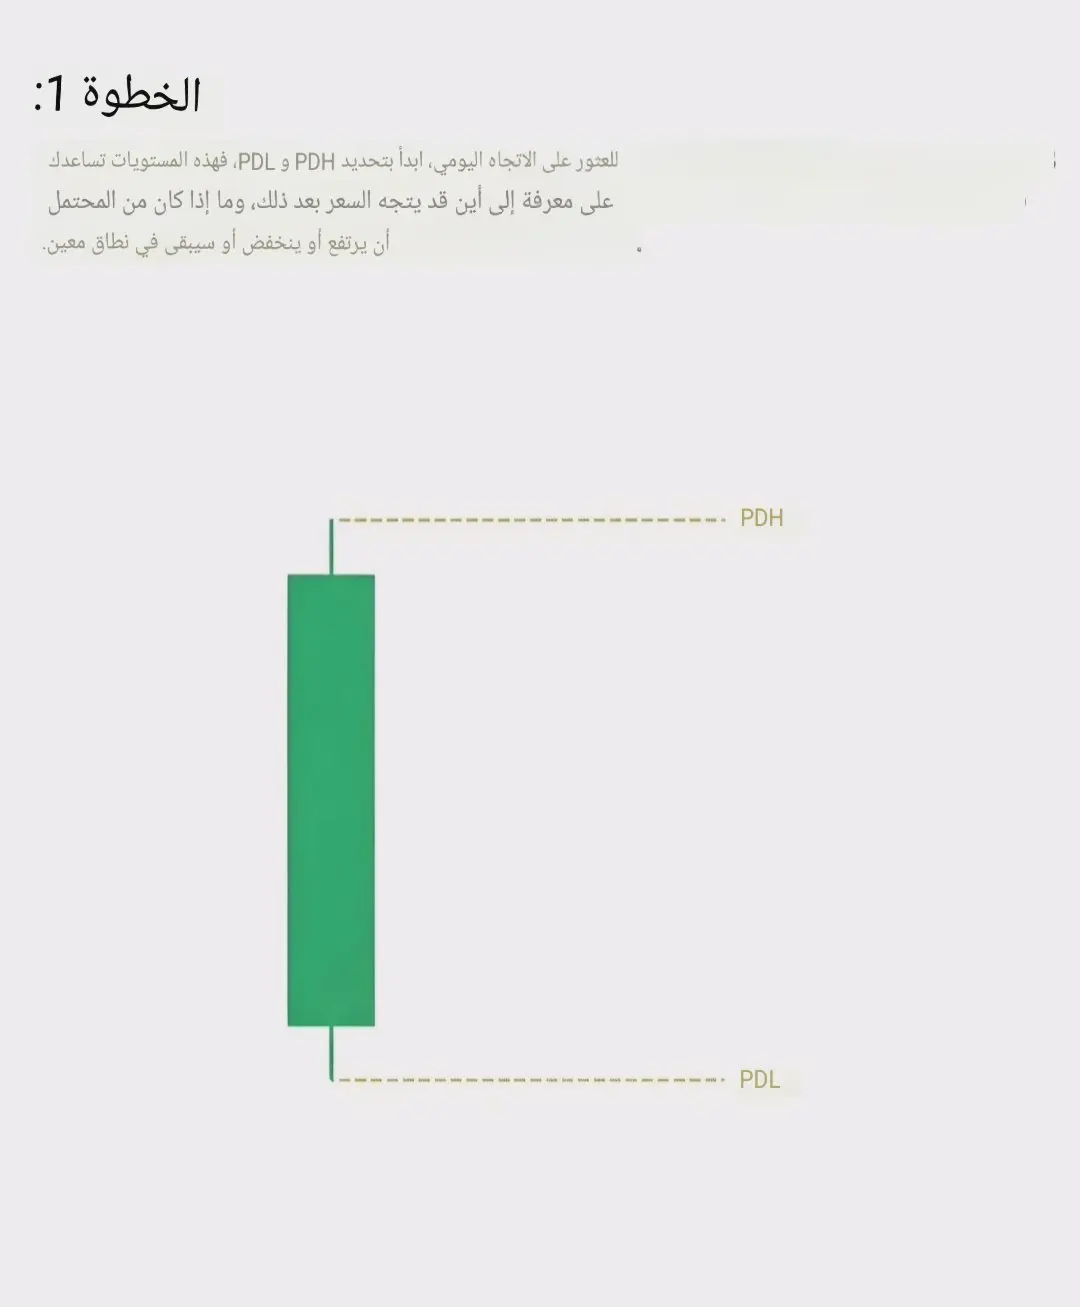
👉 Identify the start point of trading (PDH) / the end point of trading (PDL)
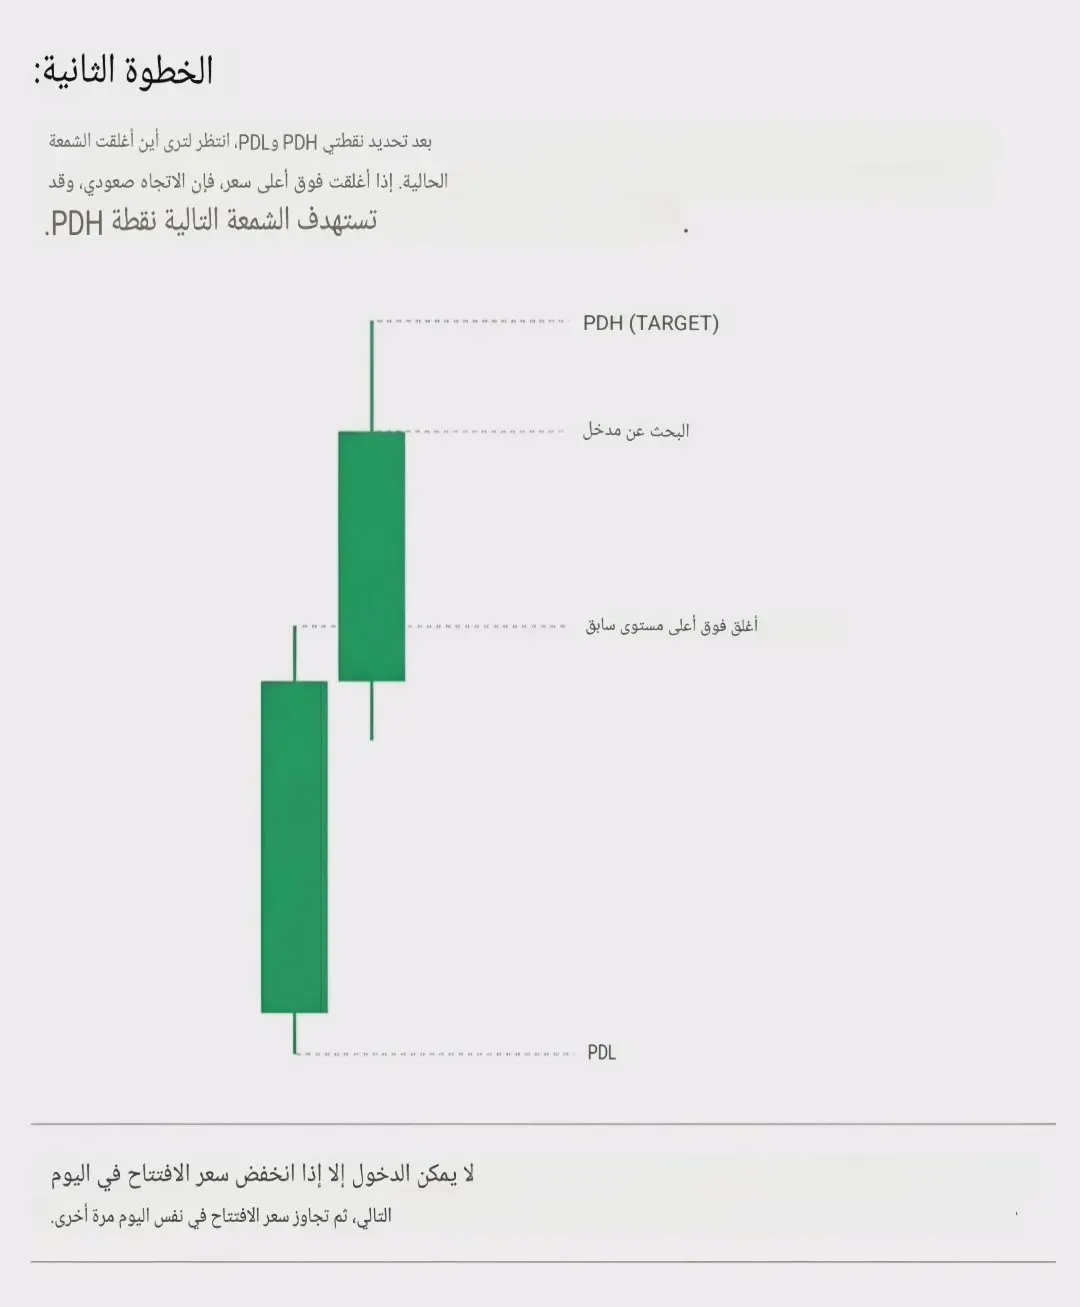
👉 Wait for the daily candle to close
👉 Follow this trend with a clear and high-probability entry 🎯
Don't overcomplicate the process.
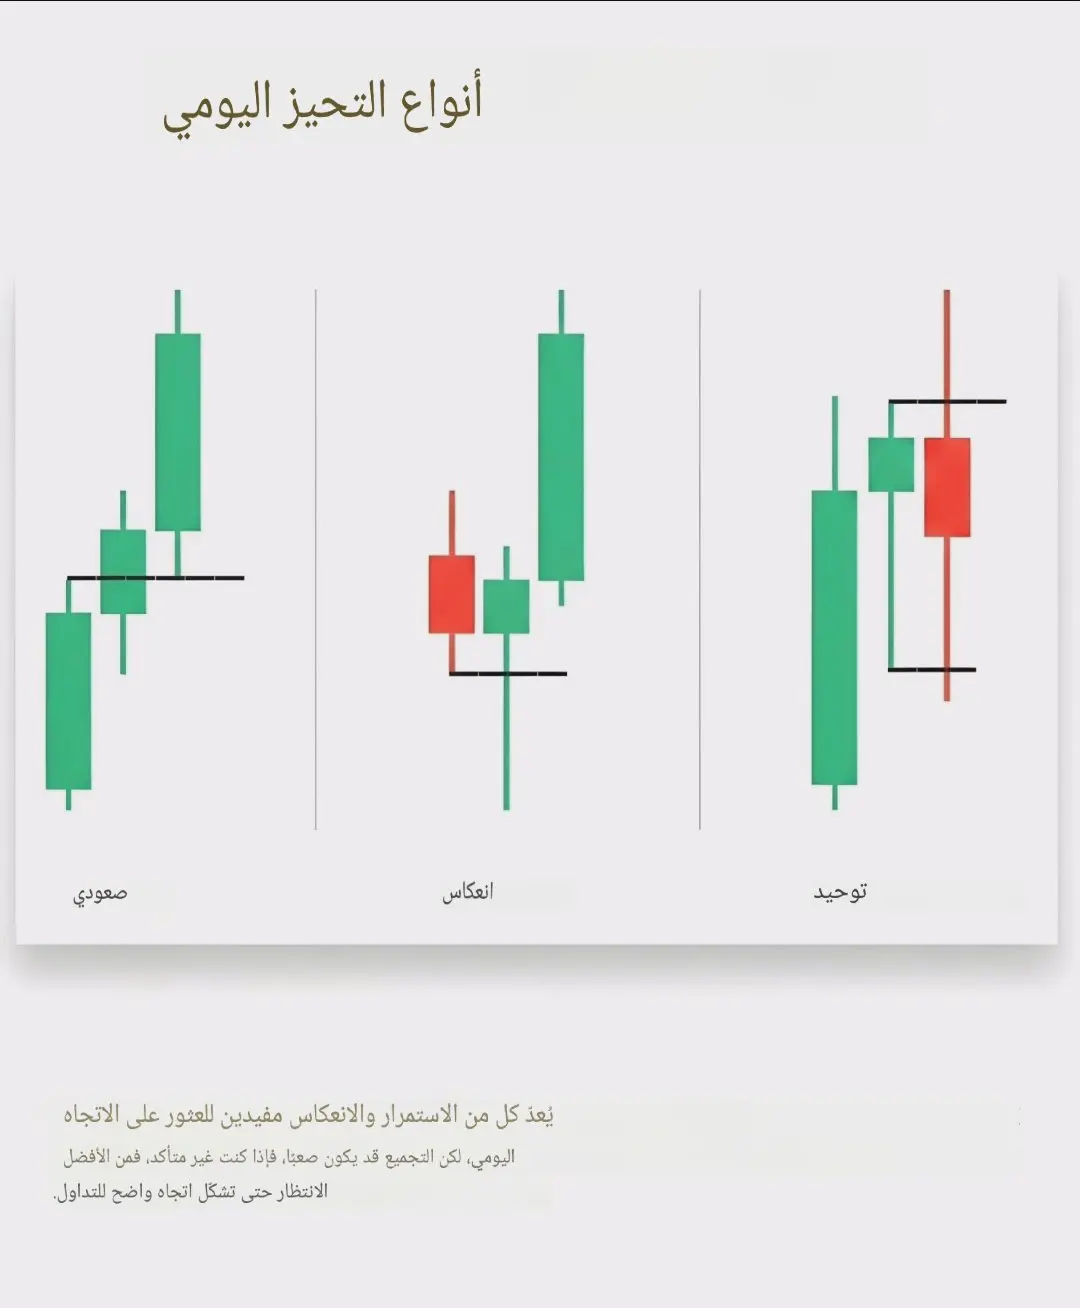
Trade based on the prevailing trend, maintain discipline, and ignore noise.
This is how continuity is built.
#معلومات.لاتقدر.بثمن
If you want a detailed analysis for long-term entry points using the daily trend and others, follow us,
$SOL
$XRP
View OriginalThe secret lies in spotting this trend early.
Here's how:
👉 Identify the start point of trading (PDH) / the end point of trading (PDL)
👉 Wait for the daily candle to close
👉 Follow this trend with a clear and high-probability entry 🎯
Don't overcomplicate the process.
Trade based on the prevailing trend, maintain discipline, and ignore noise.
This is how continuity is built.
#معلومات.لاتقدر.بثمن
If you want a detailed analysis for long-term entry points using the daily trend and others, follow us,
$SOL
$XRP


- Reward
- 1
- 1
- Repost
- Share
GateUser-61f914df :
:
#معلومه.وفائده
👇👇
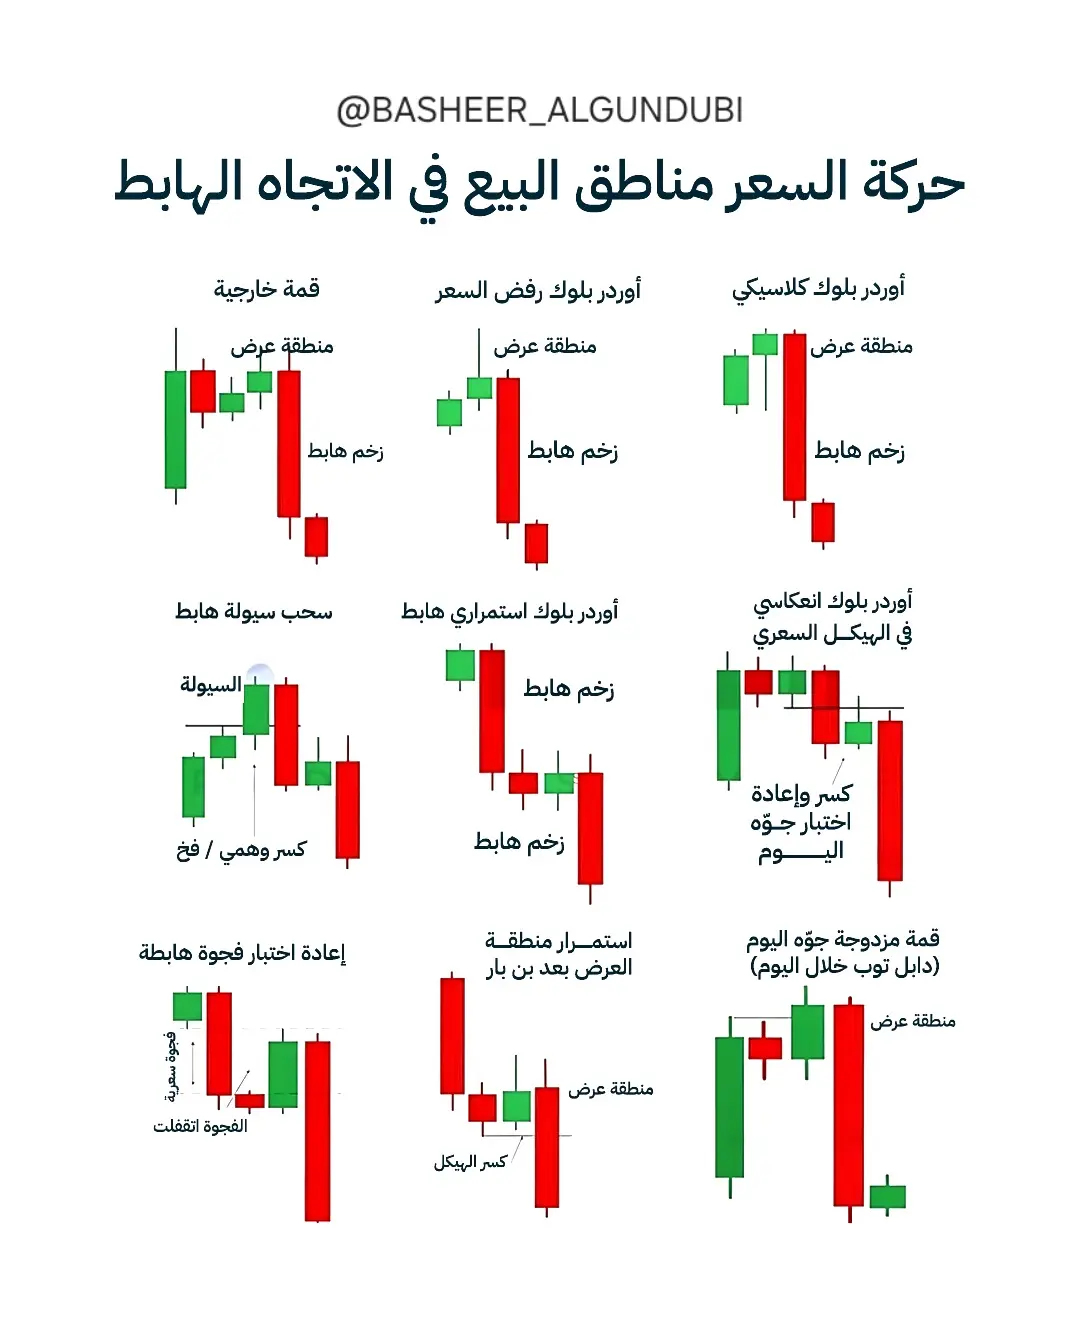
#أقوى.مناطق.البيع + Confirmation signals + Bearish reversal formation
In this post, I have gathered for you the most important real patterns that institutions draw before any strong downward movement:
📌 Pages 1–2:
Types of supply zones that the market always revisits before a decline
– Structure Break
– Liquidity Drain
– Order Block
– Price Gaps (FVG)
Each pattern is explained simply and easy to understand.
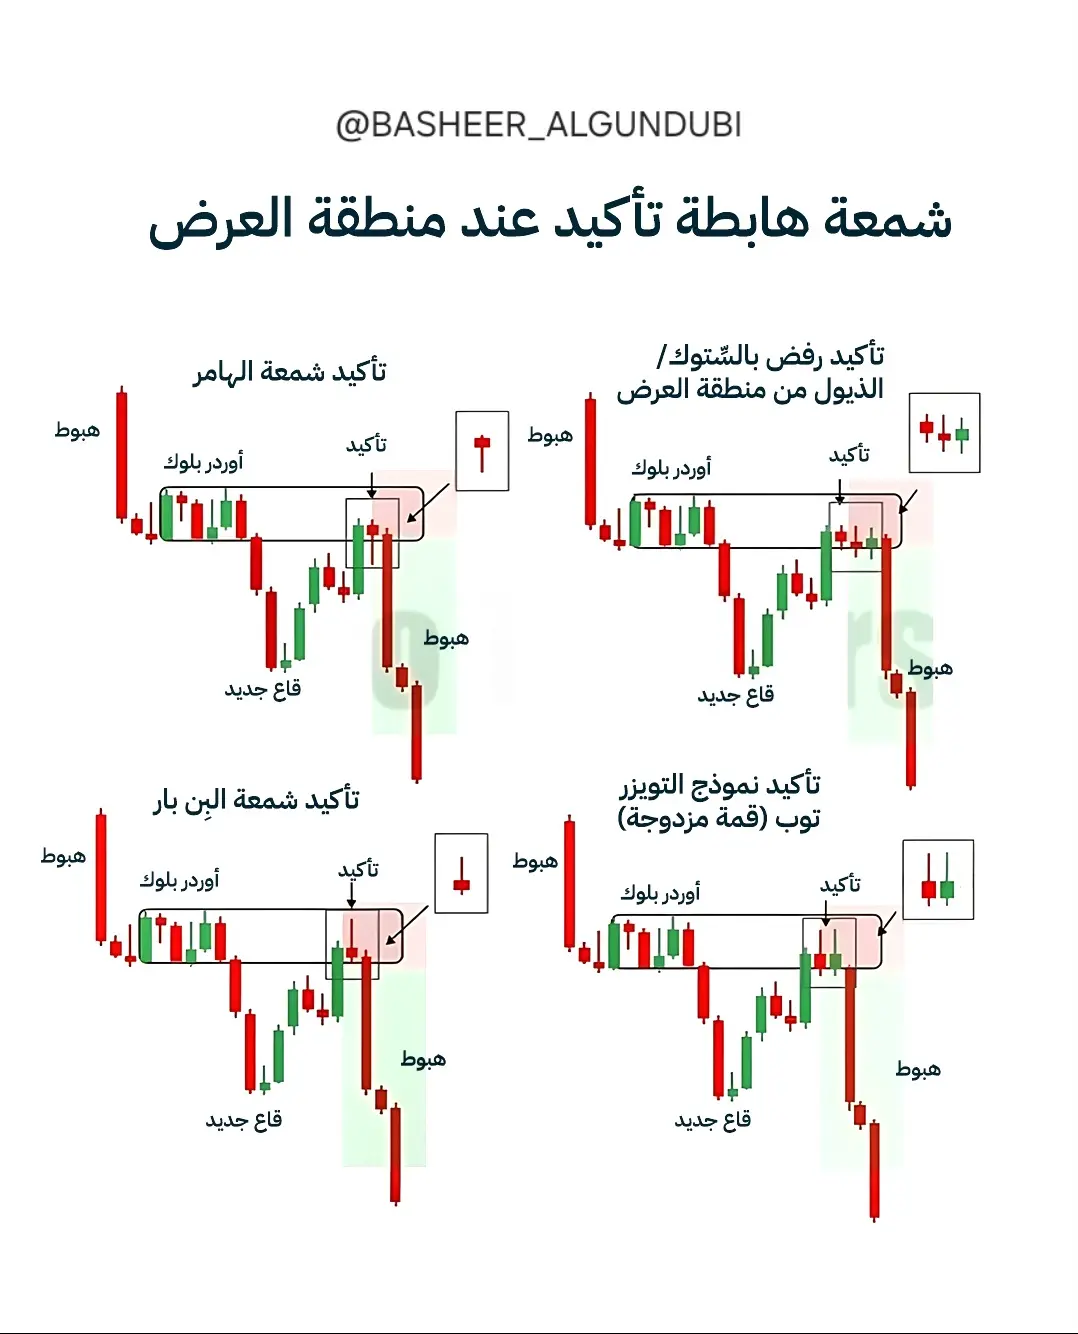
📌 Pages 3–4:
Candlestick signals that confirm the supply zone is truly active
– Hammer Candle
– Inside Bar
– Price Rejection
– Tweezer Pattern
This way, you can ente
View Original👇👇
#أقوى.مناطق.البيع + Confirmation signals + Bearish reversal formation
In this post, I have gathered for you the most important real patterns that institutions draw before any strong downward movement:
📌 Pages 1–2:
Types of supply zones that the market always revisits before a decline
– Structure Break
– Liquidity Drain
– Order Block
– Price Gaps (FVG)
Each pattern is explained simply and easy to understand.
📌 Pages 3–4:
Candlestick signals that confirm the supply zone is truly active
– Hammer Candle
– Inside Bar
– Price Rejection
– Tweezer Pattern
This way, you can ente
- Reward
- 1
- 1
- Repost
- Share
BasheerAlgundubi:
Do your own research ( DYOR ) 🤓Professional trading step by step 👌👌
#معلومات.لاتقدر.بثمن
Stage 1: Building the Foundation
Understanding the basic concepts
What is the difference between Forex stocks and cryptocurrencies?
The difference between technical analysis and fundamental analysis.
)...market, limit, stop loss order types
Learn technical analysis tools
Japanese candlesticks.
Support and resistance.
Trends and trend lines.
The basic technical indicator
. Understanding Capital Management
- How much do you risk in a single trade?
- What is the appropriate lot size?
How do you protect your account from crashing?
Phase
View Original#معلومات.لاتقدر.بثمن
Stage 1: Building the Foundation
Understanding the basic concepts
What is the difference between Forex stocks and cryptocurrencies?
The difference between technical analysis and fundamental analysis.
)...market, limit, stop loss order types
Learn technical analysis tools
Japanese candlesticks.
Support and resistance.
Trends and trend lines.
The basic technical indicator
. Understanding Capital Management
- How much do you risk in a single trade?
- What is the appropriate lot size?
How do you protect your account from crashing?
Phase


- Reward
- 2
- 2
- Repost
- Share
GateUser-92ad26f8:
O you who, when times are tough, are soothing And your help outpaces your steps with pride
Adversity laughs when it sees you and dares
Because you are a gift that does not know retreat
View More
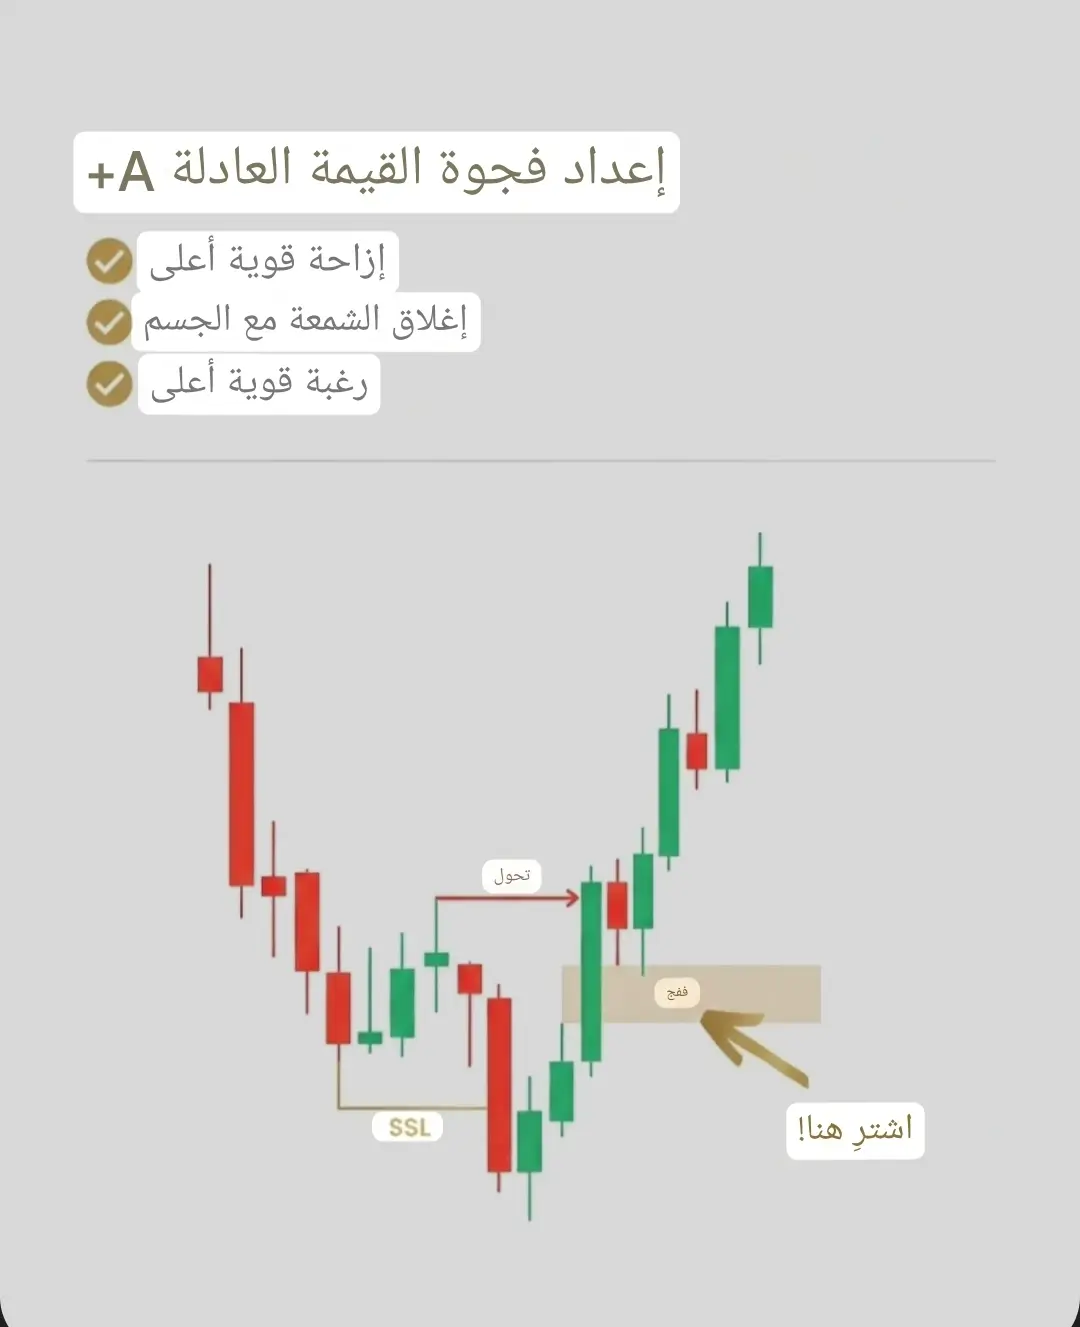
#معلومة.مفيدة
Most of #المتداولين is located here in error.
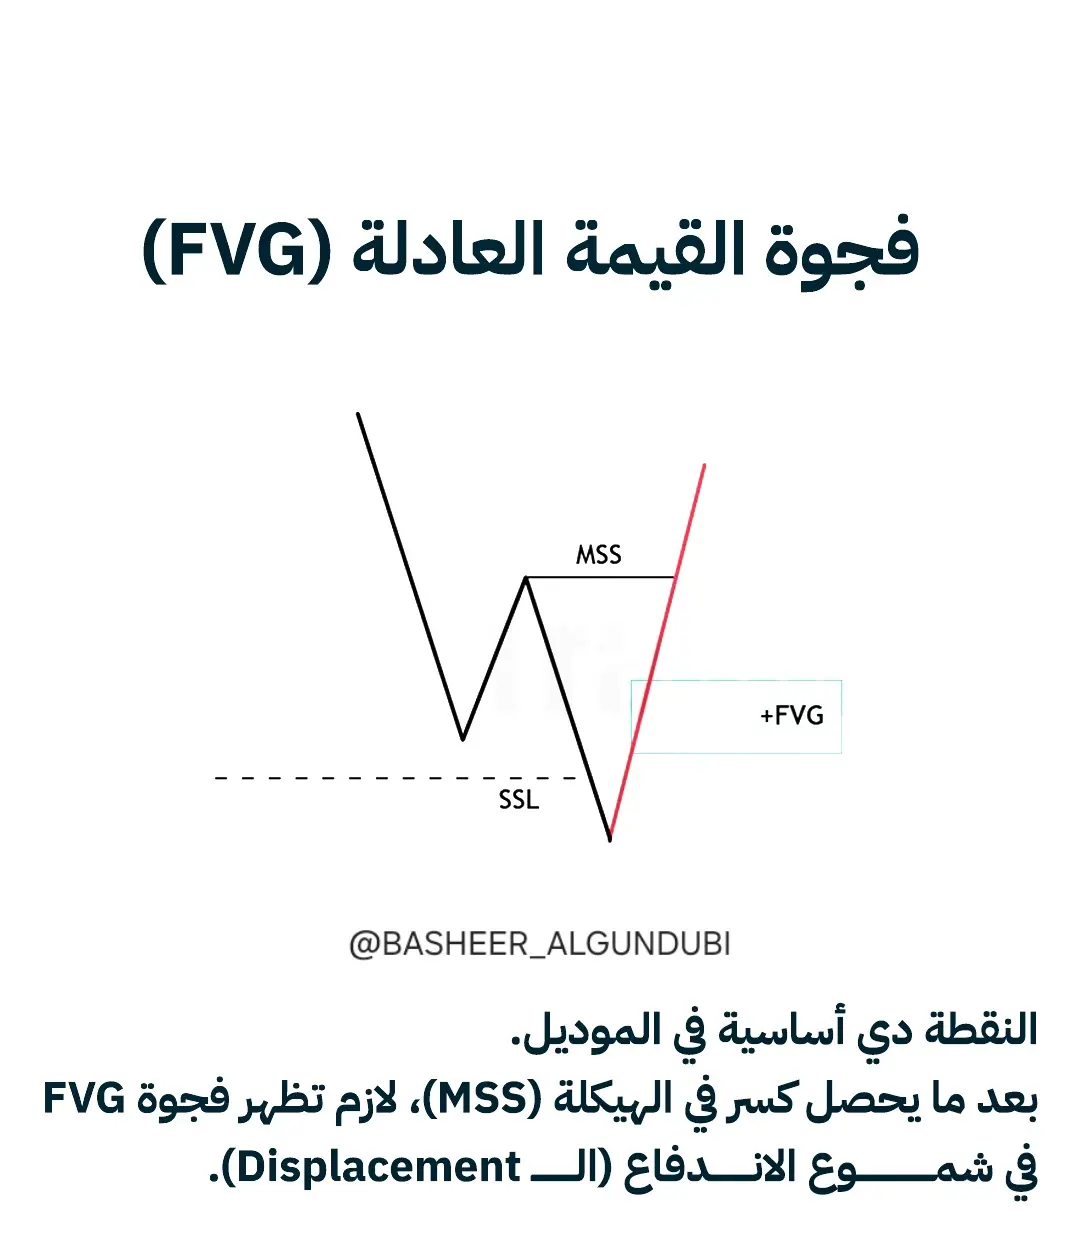
The fair value gap alone does not constitute a trading opportunity.
On the left, the price forms a fair value gap without a real shift, without a strong candle close, and without the desire to enter - the result is clear: the stop loss is triggered.
On the right, a type A+ fair value gap forms after liquidity is exploited, and the price moves consciously.
Strong candle bodies close at a high, the price structure changes, and only then does the fair value gap become tradable.
#معلومات.لاتقدر.بثمن
#USGDPUpdate
$DOT
$S
$TON
View OriginalMost of #المتداولين is located here in error.
The fair value gap alone does not constitute a trading opportunity.
On the left, the price forms a fair value gap without a real shift, without a strong candle close, and without the desire to enter - the result is clear: the stop loss is triggered.
On the right, a type A+ fair value gap forms after liquidity is exploited, and the price moves consciously.
Strong candle bodies close at a high, the price structure changes, and only then does the fair value gap become tradable.
#معلومات.لاتقدر.بثمن
#USGDPUpdate
$DOT
$S
$TON

- Reward
- 1
- Comment
- Repost
- Share
#معلومات.لاتقدر.بثمن
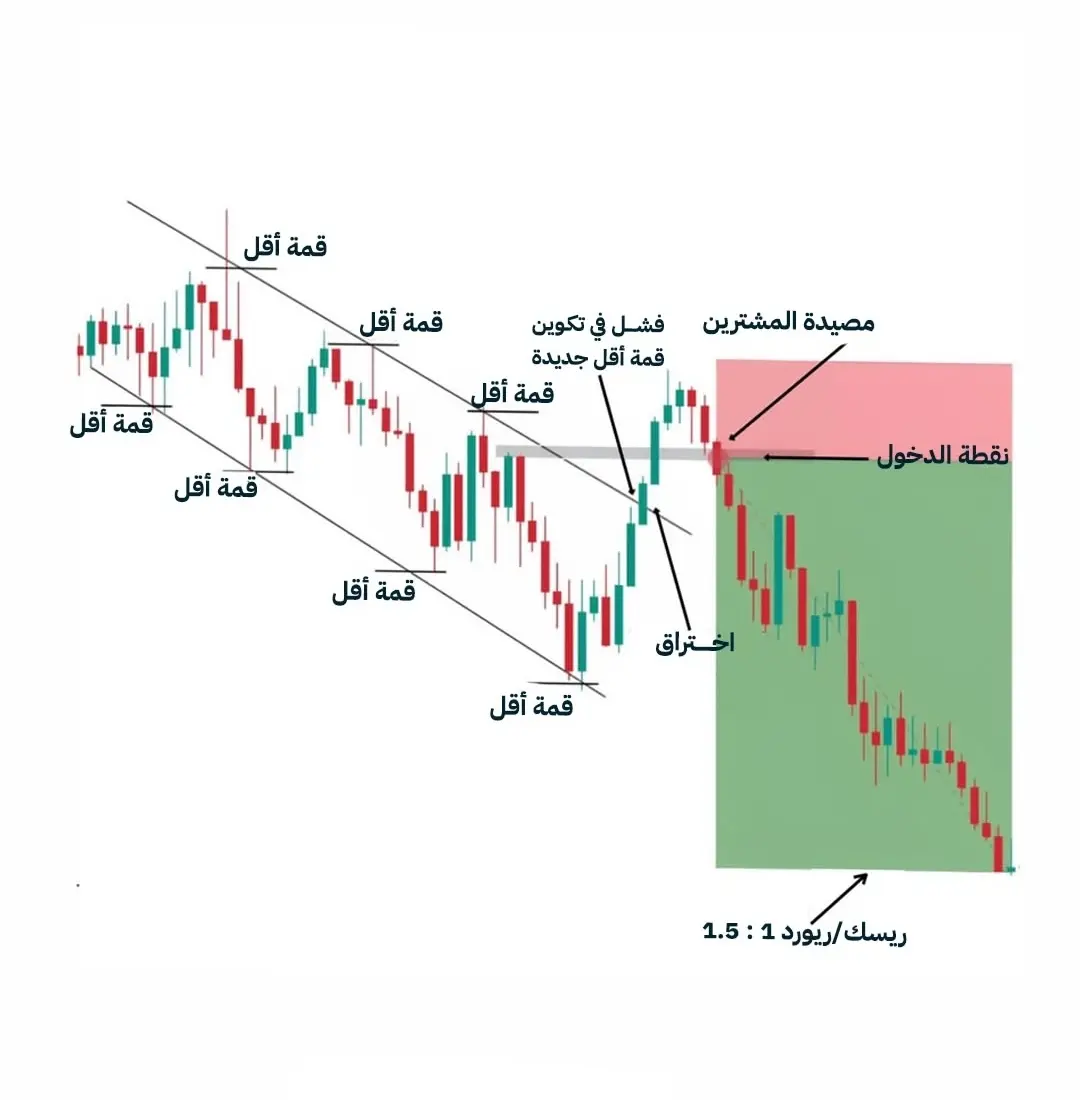
How to read price movement correctly?
Not every breakout is an opportunity… and not every rally continues 🔥
In this post, you'll understand:
✔️ What lower highs and lows mean
✔️ How to distinguish a false move failure
✔️ The difference between a real breakout and a trap
✔️ When to confidently enter a trade after a retest
✔️ How to identify a clear entry point
✔️ And maintain a professional risk/reward ratio reaching 1:4 💰
📉 Price always tries to fool the majority…
And the clever ones are not those who enter often,
The clever ones are those who wait for the right confi
View OriginalHow to read price movement correctly?
Not every breakout is an opportunity… and not every rally continues 🔥
In this post, you'll understand:
✔️ What lower highs and lows mean
✔️ How to distinguish a false move failure
✔️ The difference between a real breakout and a trap
✔️ When to confidently enter a trade after a retest
✔️ How to identify a clear entry point
✔️ And maintain a professional risk/reward ratio reaching 1:4 💰
📉 Price always tries to fool the majority…
And the clever ones are not those who enter often,
The clever ones are those who wait for the right confi
- Reward
- 1
- Comment
- Repost
- Share
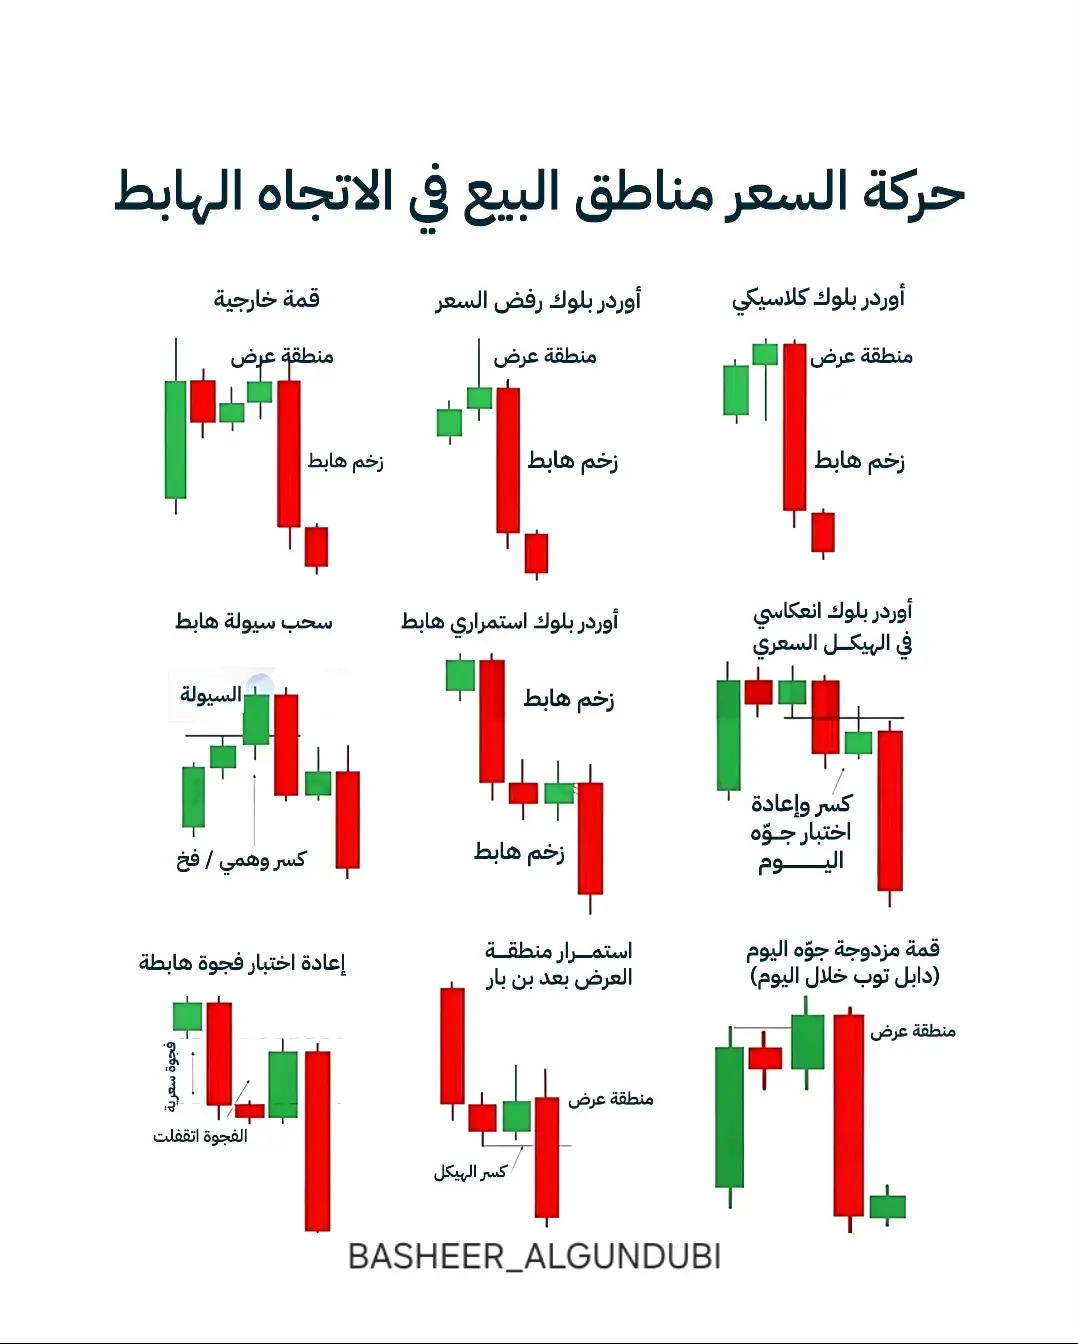
#معلومة.مفيدة
Strongest selling zones + confirmation signals + bearish reversal formation
In this carousel, I’ve gathered for you the most important real patterns that institutions draw before any strong downward movement:
📌 Pages 1–2:
Types of supply zones that the market always returns to before a drop
– Structure break
– Liquidity grab
– Order Block
– Price gaps (FVG)
Each pattern is illustrated simply and is easy to understand.
📌 Pages 3–4:
Candle signals that confirm the supply zone will actually work
– Bearish engulfing candle
– Pin bar
– Price rejection
– Tweezer pattern
So you can e
View OriginalStrongest selling zones + confirmation signals + bearish reversal formation
In this carousel, I’ve gathered for you the most important real patterns that institutions draw before any strong downward movement:
📌 Pages 1–2:
Types of supply zones that the market always returns to before a drop
– Structure break
– Liquidity grab
– Order Block
– Price gaps (FVG)
Each pattern is illustrated simply and is easy to understand.
📌 Pages 3–4:
Candle signals that confirm the supply zone will actually work
– Bearish engulfing candle
– Pin bar
– Price rejection
– Tweezer pattern
So you can e

- Reward
- 1
- 1
- Repost
- Share
BasheerAlgundubi:
Wait and see cautiously 🔍Load More
Join 40M users in our growing community
⚡️ Join 40M users in the crypto craze discussion
💬 Engage with your favorite top creators
👍 See what interests you
Trending Topics
20.05K Popularity
59.81K Popularity
68.06K Popularity
93.76K Popularity
4.54K Popularity
9.51K Popularity
173.44K Popularity
25.79K Popularity
89.78K Popularity
31.35K Popularity
220.2K Popularity
12.45K Popularity
13.94K Popularity
3.33K Popularity
227.93K Popularity
News
View MoreOverview of Major Whales: The bullish whales led by "BTC OG Insider Whale" have not adjusted their positions, while the "Shanzhai Air Force Leader" increased their LIT short position to $9.3 million.
10 h
The Farm2 community founded by AI16Z founder Shaw is about to launch the world's first 3D AI Agent
10 h
Solana founder Toly: Instead of buybacks, a long-term capital structure should be built through staking mechanisms
10 h
Deshare launches on-chain stock "IPO subscription" feature, unlocking a new way to participate in IPOs
11 h
Yili Hua: Before the 2026 big bull market, short sellers close early with small losses, and later close with huge and disastrous losses.
11 h
Pin