- Kava’s price analysis indicates bullishness and delivers a positive outlook.
- Buyers are regaining strength and are trying to extend their gains above the $0.60 level.
The KAVA price is trading in bullish territory above key moving averages, showing bullish momentum. On the daily technical chart, the Kava price is moving in an upward direction and staying above the 50-day and 200-day EMA levels
KAVA is surging, up approximately 11% in the last 24 hours. This pushes its market cap to around $617.6 million and places it among the top performers in the last 24 hours. In recent trading sessions, buyers have demonstrated their strength. They also continued buying and accumulating more to extend the upward trend.
The analysis suggests that the KAVA price is poised for a significant uptrend with a potential price increase of 30% to 40% in the upcoming days. Bulls are working hard to maintain these levels and show confidence in the upward price movement
According to CMC data, at the time of publication, the Kava price is trading at $0.5741 with an intraday increase of 11%, showing optimism on the technical chart. The trading volume has increased by 74.91% and is currently at $42.56 million.
Will Kava Price Break Above $0.75 Mark?
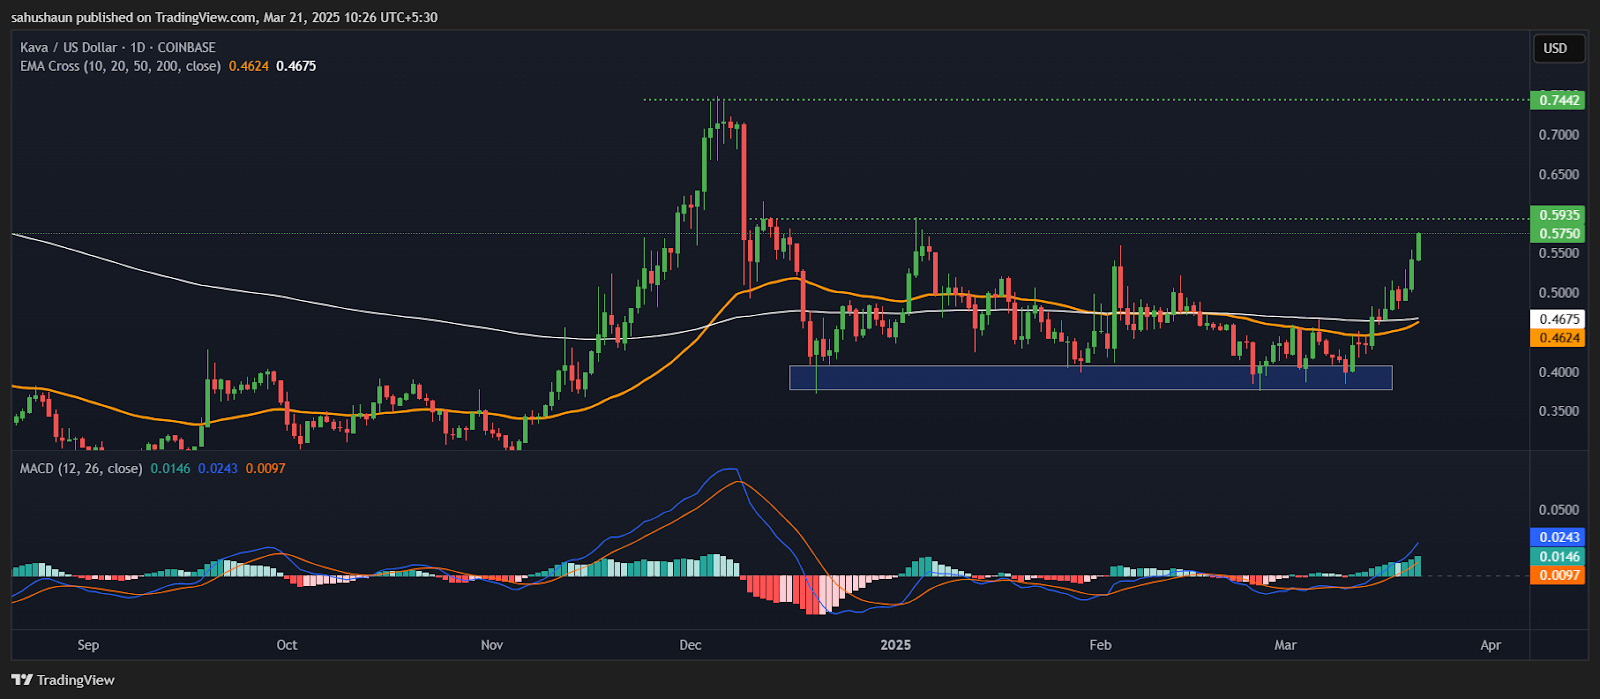 Source: TradingviewKava’s price is currently trading above its 50-day and 200-day exponential moving averages (EMA), which supports its price momentum. The current RSI value is 72 points. The 14 SMA is above the center line at 55.86 points, suggesting positive momentum
Moreover, MACD is also showcasing positive signs and trading in the bullish zone. Both the MACD curve and signal curve heading in the upward direction with a green histogram.
Kava’s price analysis demonstrates bullish momentum, trading above key EMAs with positive indicators like RSI and MACD. Buyers aim for further gains, eyeing a potential 30%-40% uptrend as market confidence strengthens.
Highlighted Crypto News Today:
BNB Eyes Major Rally as Bullish Pattern Takes Shape – $700 Next?
Disclaimer: The information on this page may come from third parties and does not represent the views or opinions of Gate. The content displayed on this page is for reference only and does not constitute any financial, investment, or legal advice. Gate does not guarantee the accuracy or completeness of the information and shall not be liable for any losses arising from the use of this information. Virtual asset investments carry high risks and are subject to significant price volatility. You may lose all of your invested principal. Please fully understand the relevant risks and make prudent decisions based on your own financial situation and risk tolerance. For details, please refer to
Disclaimer.