Ethena (ENA) experienced an impressive breakout, reaching a local high of $0.12 on Wednesday (03/04). Previously, a report from Coin Photon noted a rapid price increase accompanied by a significant rise in open interest (OI), indicating short-term bullish sentiment spreading across the market.
Daily trading volume also surged, reflecting high investor participation. However, the long-term outlook remains uncertain as the bearish structure still exists. Over the past 48 hours, the bears quickly regained control, exerting considerable pressure on the price.
At the time of writing, ENA has fallen about 15% from the local high of $0.12. Based on current data, the scenario of further price correction is still considered highly likely.
Ethena Buyers Still Can’t “Breathe Easy”
Over the past 8 months, all recovery efforts by the bulls have been fragile, with each rally lasting only 1–2 weeks before quickly being suppressed. Since the nearly $0.8 peak set in August, Ethena (ENA) has entered a prolonged downtrend with continuous sell-offs.
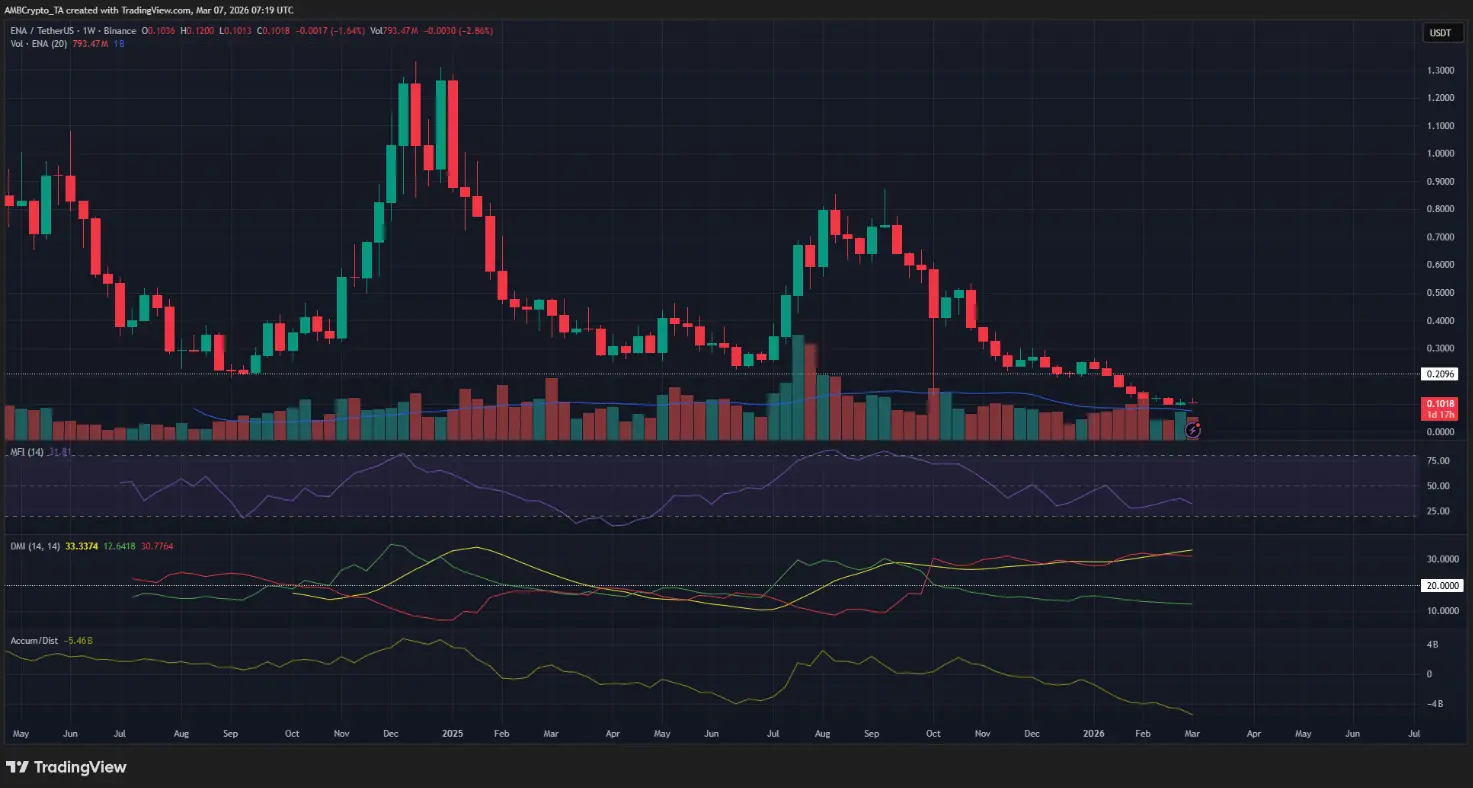 Weekly ENA/USDT Chart | Source: TradingView By mid-January, the market experienced a sharp hit as the critical support zone at $0.21 was broken. At the time of writing, ENA is trading just above $0.1, meaning it has lost about 50% of its value in just five weeks. This development serves as a clear warning to altcoin investors: once key support levels are broken, the decline can accelerate rapidly and strongly.
Technical indicators also reinforce this bearish picture. On the weekly timeframe, the Directional Movement Index (DMI) confirmed a strong downtrend since October. Meanwhile, the Money Flow Index (MFI) continued to decline, and the Accumulation/Distribution (A/D) indicator kept setting new lows. The consensus of these signals suggests that bears have almost complete control of the market in recent months.
What’s Next for ENA Traders?
A bullish divergence on momentum indicators provided a boost, helping the price rebound from the $0.12 region. Previous reports also indicated that the long-term trend structure, along with heavy liquidation around $0.12, acts as a “price magnet,” attracting short-term market activity.
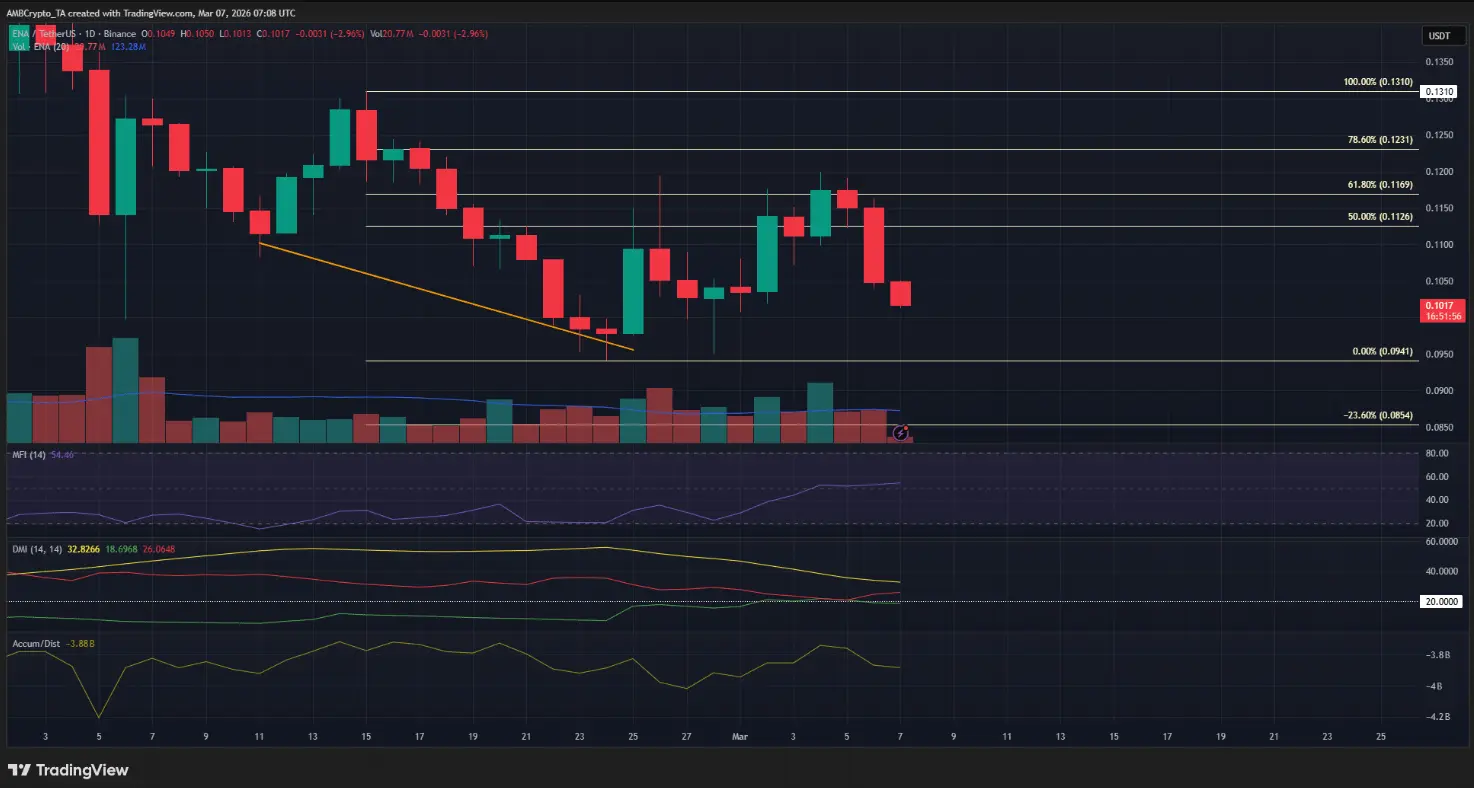 Daily ENA/USDT Chart | Source: TradingView However, Fibonacci levels paint a less optimistic picture. The 78.6% retracement at $0.123 was not even tested before the price was quickly rejected. This development partly confirms that the sellers still hold control, suggesting the overall trend remains bearish. Technical signals on this timeframe also align with this scenario.
With selling pressure still dominant, ENA’s next target likely lies in the lower extension around $0.085—a key support zone that could serve as an important test point if the downtrend continues.
Disclaimer: The information on this page may come from third parties and does not represent the views or opinions of Gate. The content displayed on this page is for reference only and does not constitute any financial, investment, or legal advice. Gate does not guarantee the accuracy or completeness of the information and shall not be liable for any losses arising from the use of this information. Virtual asset investments carry high risks and are subject to significant price volatility. You may lose all of your invested principal. Please fully understand the relevant risks and make prudent decisions based on your own financial situation and risk tolerance. For details, please refer to
Disclaimer.