As of the time this article was written on Saturday, Tron (TRX) is trading around $0.30, after retesting the strong resistance zone that the price previously broke through. Positive on-chain and derivatives market data continue to reinforce the bullish outlook for the price. From a technical perspective, current signals indicate that TRX is likely to maintain its upward momentum, aiming for higher levels around $0.32.
Positive On-Chain and Derivatives Data Indicate Potential for Price Increase
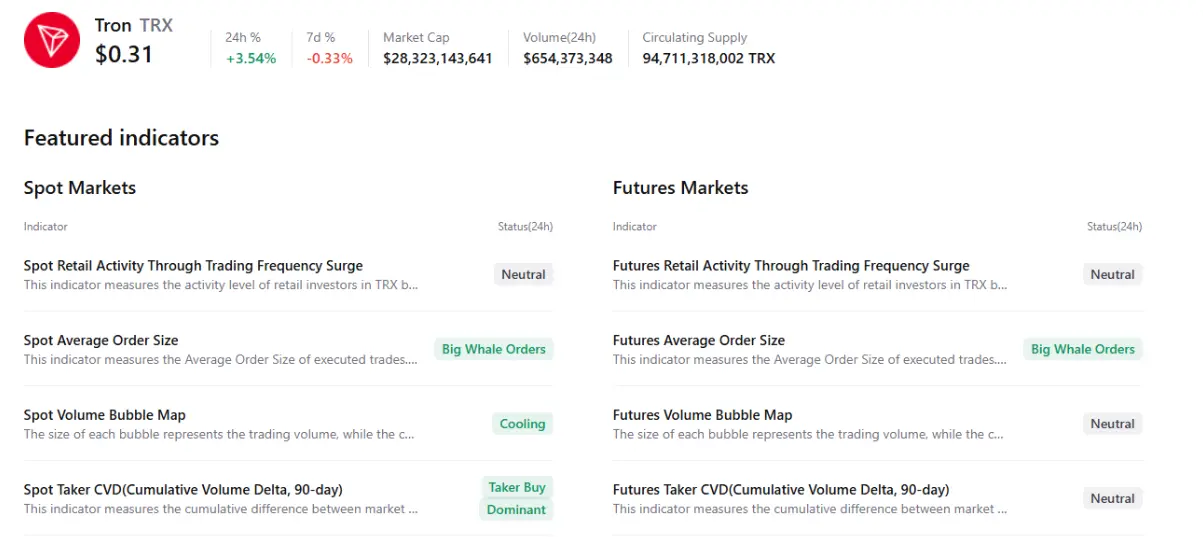
Aggregated data from CryptoQuant continues to support a bullish scenario for TRX, as both the Spot and Futures markets show large orders from whales. In the context of cooling market conditions and dominant buying pressure, these signals suggest TRX may be entering a phase of preparation for a new rally.
Meanwhile, data from DefiLama shows the total supply of stablecoins on the Tron network has been steadily increasing since late December, reaching a historical high of $84.63 billion on Wednesday before stabilizing around $84.43 billion on Friday. The expansion of stablecoins reflects growing demand for network usage, thereby improving liquidity, boosting on-chain activity, and strengthening the long-term bullish outlook for the Tron ecosystem.
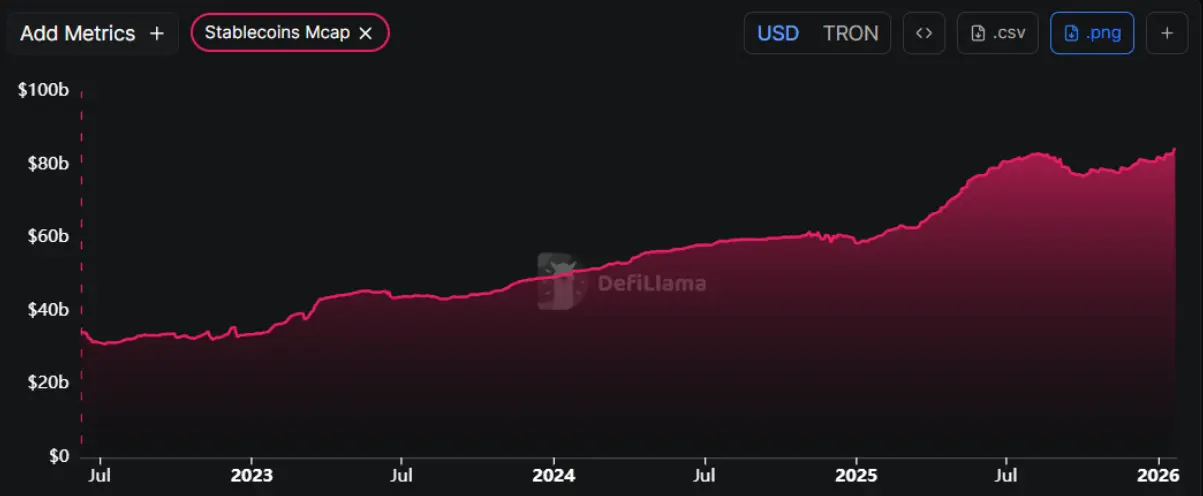 Stablecoin Market Capitalization Chart on Tron | Source: DefiLlama In the derivatives sector, according to Coinglass, the TRX long/short ratio reached 1.36 on Friday, approaching the highest level in a month. Maintaining this ratio above 1 indicates that most traders are leaning toward a continued upward price movement for Tron.
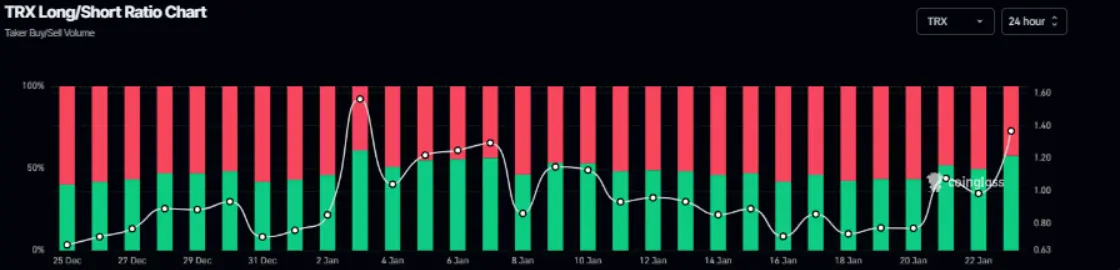 TRX Long/Short Ratio Chart. Source: Coinglass
Tron Price Analysis: Bulls Target $0.32
The Tron (TRX) price officially broke out of the descending channel pattern—formed by a series of peaks and troughs from late August—on January 13, gaining nearly 5% over the next four trading sessions. However, most of these gains were quickly erased on Tuesday as profit-taking pressure emerged.
On Wednesday, TRX retested the upper boundary of the recently broken pattern and rebounded by 3.42% in the following session, indicating that buying momentum remains steady. Notably, this support zone converges with several key technical factors, including the daily support level at $0.29 and the 50, 100, and 200-day EMAs, forming a highly reliable reversal area. As of Saturday, TRX is trading around the $0.30 mark.
In a bullish scenario, if the upward trend continues, TRX could extend its rally toward the $0.32 high set on October 22.
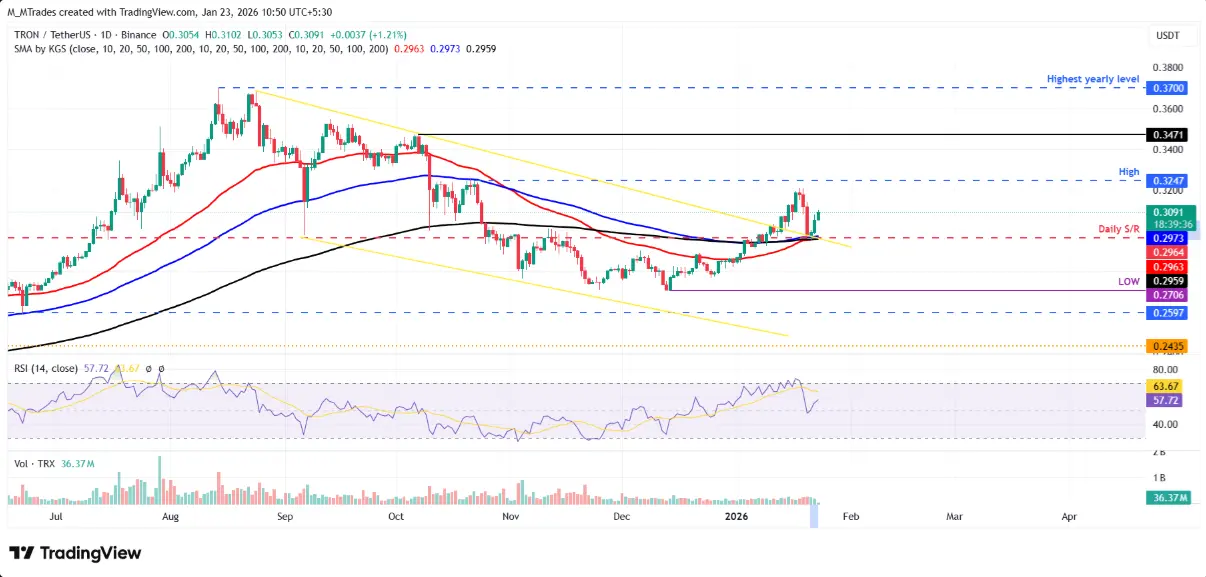 Daily TRX/USDT Chart | Source: TradingView The daily RSI indicator is currently at 57, rising from the neutral 50 level, reflecting a gradually strengthening bullish momentum.
Conversely, if selling pressure increases, TRX may retreat to test the nearest support zone around $0.29.
Disclaimer: The information on this page may come from third parties and does not represent the views or opinions of Gate. The content displayed on this page is for reference only and does not constitute any financial, investment, or legal advice. Gate does not guarantee the accuracy or completeness of the information and shall not be liable for any losses arising from the use of this information. Virtual asset investments carry high risks and are subject to significant price volatility. You may lose all of your invested principal. Please fully understand the relevant risks and make prudent decisions based on your own financial situation and risk tolerance. For details, please refer to
Disclaimer.