Author: doug funnie
Compiled by: Tim, PANews
Why do I not think we have reached the peak of the bull market?
I haven't made such a prediction since the beginning of 2024.
The content we are going to discuss:
- On-chain metrics
- Monthly RSI Indicator
- Business Cycle Correlation (Purchasing Managers' Index PMI)
- 50-week moving average support
- Recent Headlines
- “The chart had long shown signs”
- Total market capitalization of cryptocurrencies (excluding Bitcoin)
- Social Media
1) On-chain metrics
It is necessary to be clearly aware that all of these will experience diminishing returns.
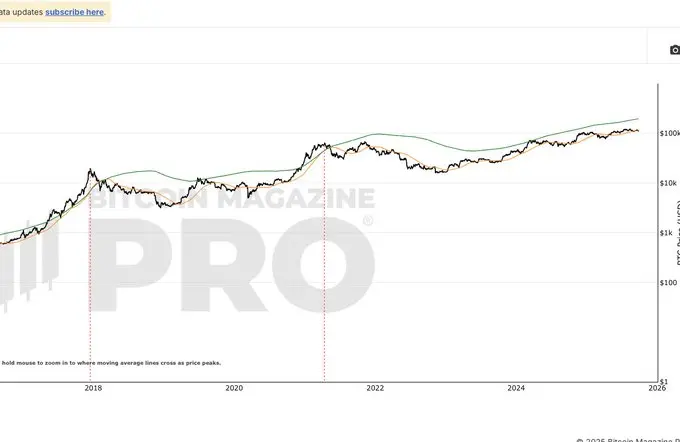
First is the top of the Pi cycle. Although the orange line crossed above the green line before reaching the top, the degree of crossing has diminished over the past three cycles. Assuming a diminishing returns effect exists, they may not even intersect. Currently, the green line is at 190,000, and the orange line is at 112,000. The green line continues to rise over time and is about to reach 200,000 and continue to rise.
Even considering the -50% diminishing return effect, this surge has driven Bitcoin to around $150,000. We are currently at $109,000. The gap from today is staggering, enough to float an aircraft carrier in between:
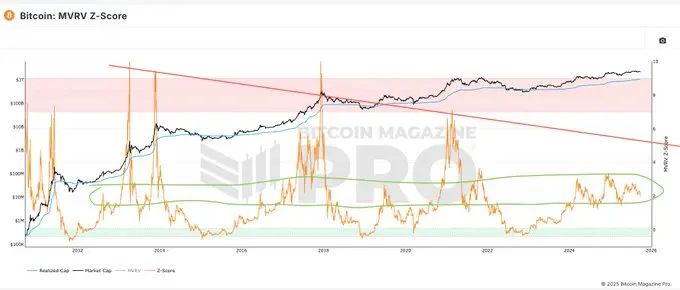
MRVZ
This indicator uses several criteria to identify market tops. Although the current value has slightly increased, it is still in the “cycle noise range,” similar to the bizarre elongated market in 2019, and it is far from reaching the level of the last aggressively fitted trendline of this indicator.
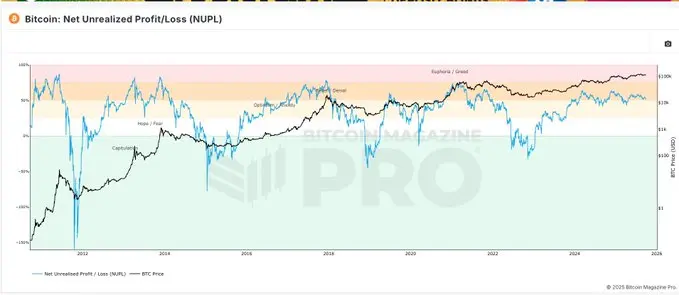
NUPL
The “diminishing returns” feeling of this indicator is not that strong: it measures the proportion of profitable individuals. When almost everyone is in a profitable state, the market is on the edge of danger. The last cycle peaked at 75%, and this cycle's local peak is about 65%. Currently, this number is 50%.
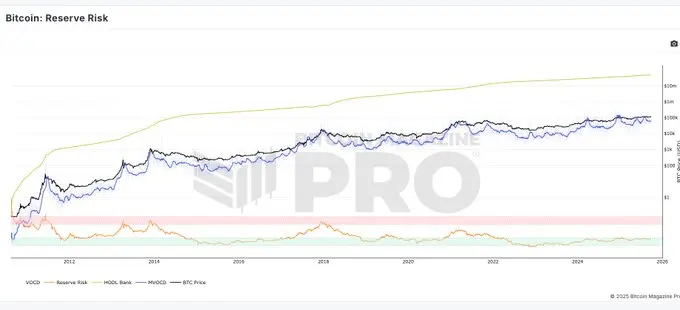
Bitcoin Reserve Risks
This indicator performs quite well in predicting local peaks. It successfully captured the turning points in March 2024 and January 2025, and also issued a signal in late July (after which liquidity sharply shrank). Currently, however, there is no activity.
Other on-chain metrics reflect a similar situation.
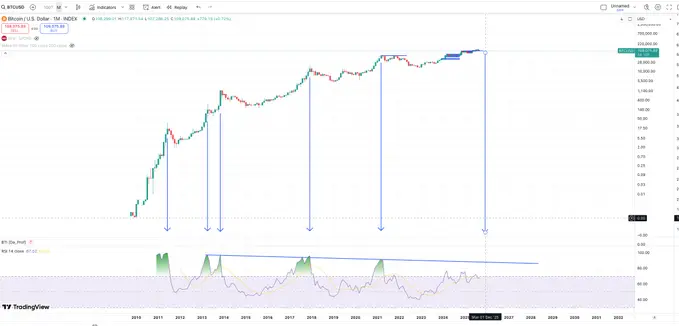
2) Monthly RSI Indicator
Let's take a look at another reliable indicator from the past cycles: the monthly RSI index. Whether at the peak of a surge or during the distribution phase, this indicator will definitely reach this level by the end of the historical cycle. If it rises at the fastest pace in history, the earliest point in time to reach this value would be around December:
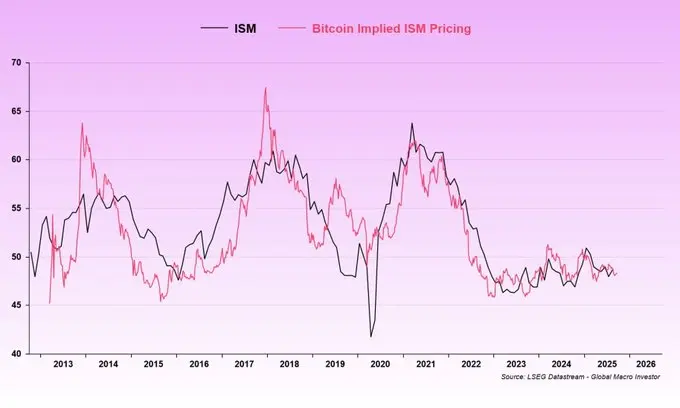
3) Business Cycle Correlation (Purchasing Managers' Index PMI)
Macroeconomic analyst Julien Bittel often discusses topics related to this index, and this is thanks to him. His view coincides perfectly with the statement that “we are currently in a distorted, deformed version of 2019, and we are just a few quarters behind the business cycle.” Although other sources of liquidity, a once-in-a-generation ETF cycle, and a frenzy of positive regulatory news have pushed Bitcoin significantly higher to date, we have yet to see the ISM index peak dramatically.
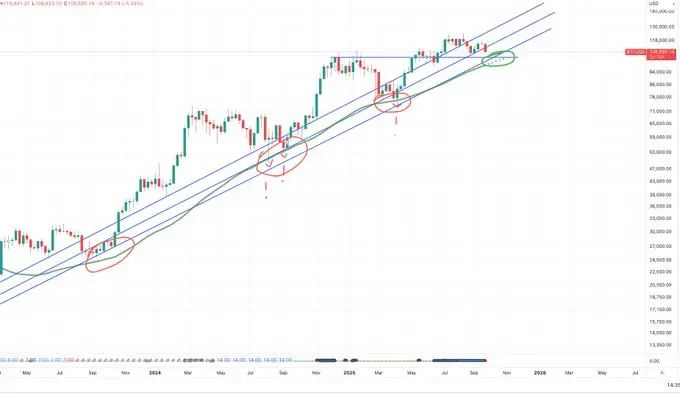
4) 50-week moving average support
In classic technical analysis, a crypto bull market is generally considered to officially end only when the weekly closing price falls below the 50-week moving average. Currently, the Bitcoin price still has about $10,000 of space from that average line. If it weren't for long-term market research and consistent record-keeping (or possessing an excellent memory), people might have already forgotten that we have dipped below that average line twice and even had multiple instances of lower shadows piercing through it. Right now, this moving average is trending upwards and is about to resonate with the support level between 98k and 104k. Historical precedents are available for reference.
Recent News Headlines
Cryptocurrency has experienced an exceptionally deep plunge, while the stock market continues to rise. We just received news that the U.S. Securities and Exchange Commission (yes, the “make crime legal” SEC from Trump's term) is investigating over 200 potential insider trading cases involving DATs (decentralized autonomous tokens). These DATs seem somewhat inflated to me, which may explain the relative weakness of cryptocurrencies, while possibly creating “pulling off a Band-Aid” type of painful moments. Since we are still far from key support levels, prices may actually have the potential for recovery.
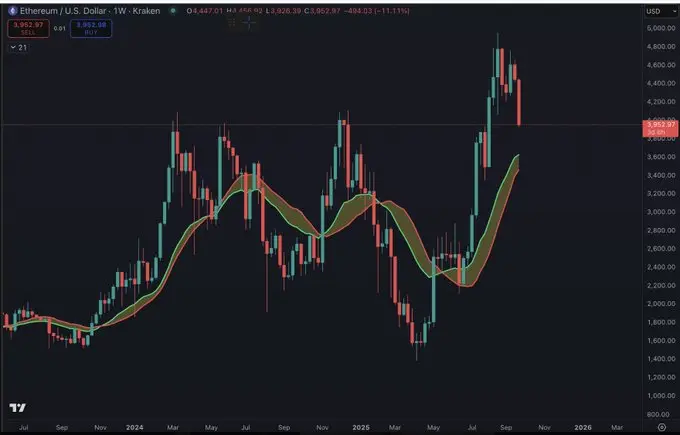
6) “The chart had already shown signs”
This pullback has already “appeared on the chart”. Unless we are in the last few weeks of a parabolic surge, ETH (and altcoins) will always retrace to support levels here, leading to an increase in Bitcoin's market cap dominance.

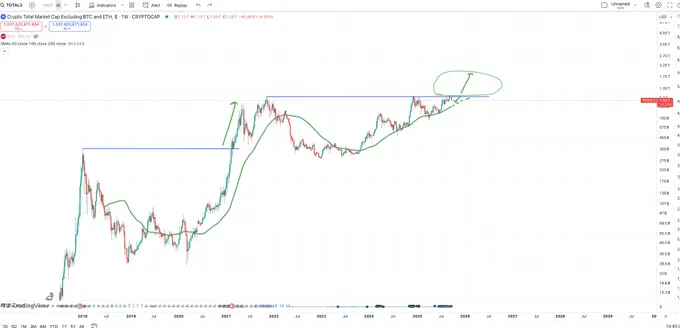
7) Total market capitalization of cryptocurrencies (excluding Bitcoin)
The total market capitalization (altcoins) is once again clearly hindered at the previous historical high, while Ethereum is also undergoing a pullback at a high level. The 50-week moving average is steadily rising, and it seems that this is a retest of that average line, with several months potentially remaining until an upward breakout. This looks more like a bullish pattern rather than a signal of an “end of cycle.”
8) Social Media
The Coinbase app is ranked outside the top 200, while Phantom and Moonshot are ranked quite high. I'm not sure if we really need retail investors to enter in order to reach the top, nor do I think these apps necessarily need to break into the top three (or even need to return to the top spot), but the current ranking is as cold as the dark side of Pluto.
Meanwhile, the viewing metrics of the YouTube channel remain at bear market levels, for reference only.
Disclaimer: The information on this page may come from third parties and does not represent the views or opinions of Gate. The content displayed on this page is for reference only and does not constitute any financial, investment, or legal advice. Gate does not guarantee the accuracy or completeness of the information and shall not be liable for any losses arising from the use of this information. Virtual asset investments carry high risks and are subject to significant price volatility. You may lose all of your invested principal. Please fully understand the relevant risks and make prudent decisions based on your own financial situation and risk tolerance. For details, please refer to
Disclaimer.
