- After a 54% surge, OKB smashed records, hitting an ATH of $194.80.
- Its daily trading volume has skyrocketed by over 293%.
Within the neutral market sentiment, the crypto assets are swinging between green and red waves. The majority of the assets are charted in green, reclaiming the recent gains. The market cap has settled at $3.86 trillion after a 1% uptick. With the green carpet across the altcoins, the OKB value has skyrocketed by over 54.49% in the past 24 hours
The asset has smashed records, set a new ATH at $194.80, and emerged as one of the top gainers. It opens the day trading at the bottom range of $125.40. As the potent bulls stepped in, the OKB price climbed to the towering ATH. Moreover, the asset has tested the imperative resistance range between $125.47 and $194.73
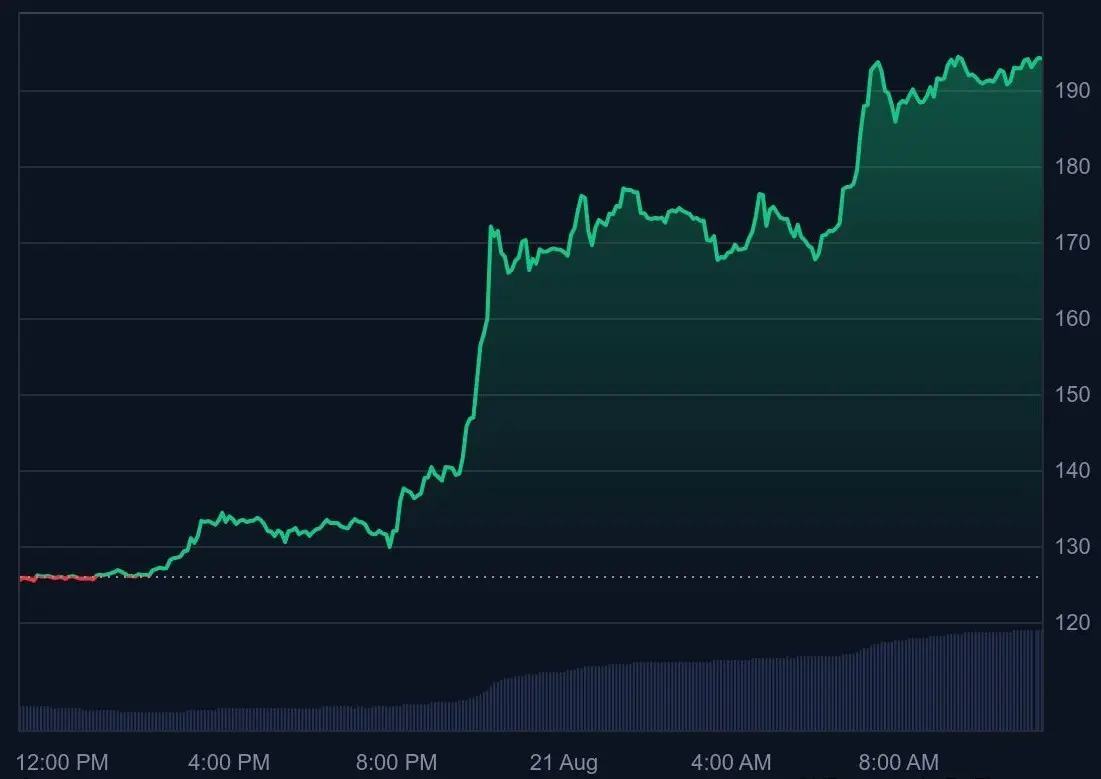 *OKB price chart (Source: CMC)*Will the high-pitched rally endure despite the inconsistent signals in the market? As reported by the CMC data, at press time, OKB trades within the $193.88 range, with a market cap of $4.07 billion. Meanwhile, the daily trading volume of the asset has exploded by over 293%, reaching $1.13 billion
Zooming in on the price graph of the last thirty days, OKB has registered a surge of over 303%. The monthly low price was recorded at the $45 level, and a sudden uptick took the price to the immediate $116. After a series of ups and downs, the price hit new highs, hovering around the current trading level
OKB on Fire, Can the Rally Keep Burning?
The recent price breakout of OKB ignites a rally, finding the next key resistance range at around $193.98. With the golden cross emergence, it could open the gateway for a steady upside correction and test the subsequent resistance above the $194.08 range
Conversely, in the case of the asset losing momentum, the asset could slip to its former low below the $193.78 level. An extended downside correction might likely trigger the formation of the death cross, sending the OKB price toward the $193.68 mark or lower.
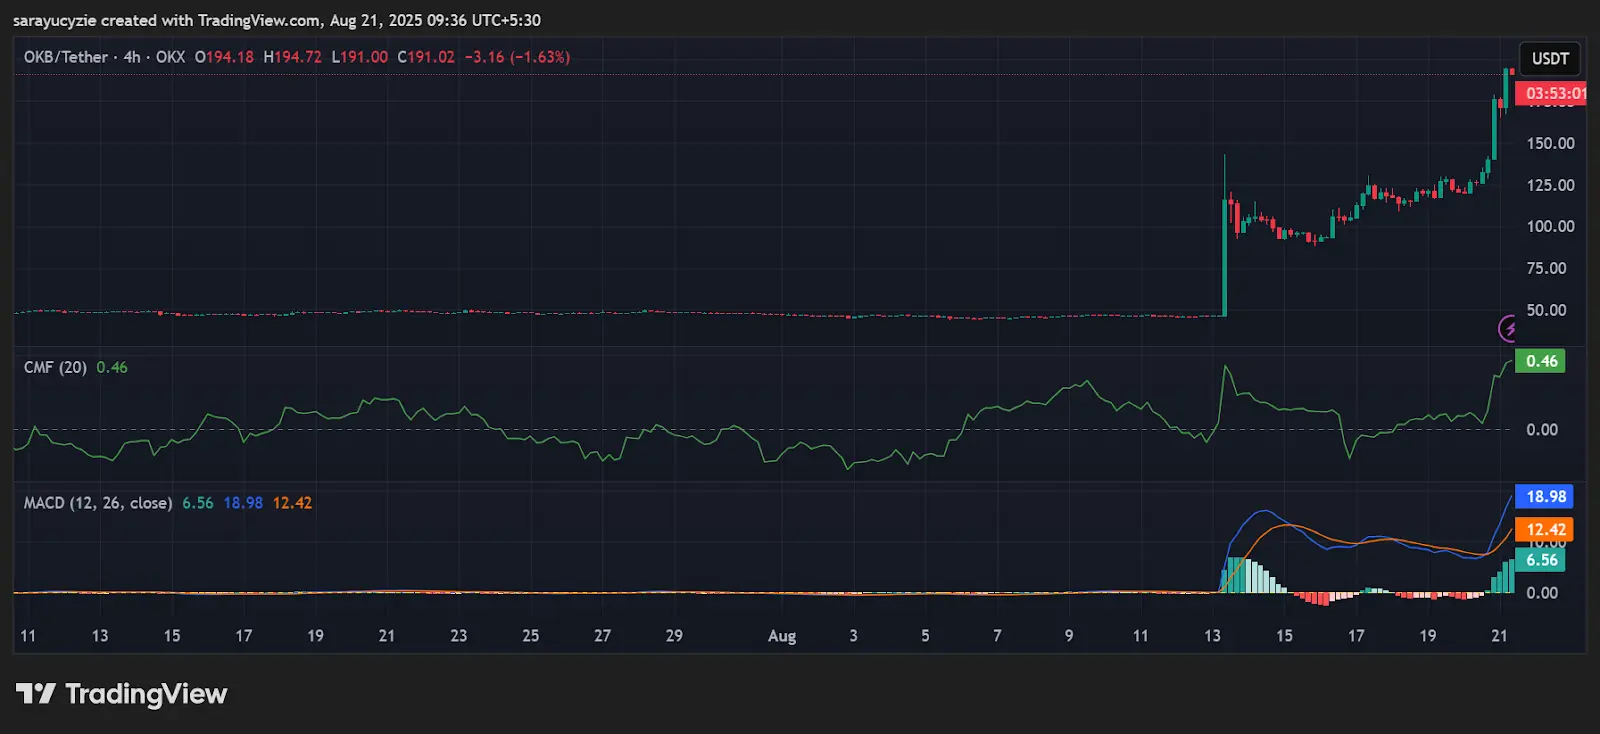 *OKB chart (Source: TradingView)*OKB’s Moving Average Convergence Divergence (MACD) line has crossed over the signal line, which is typically seen as a bullish signal. It implies the potential uptrend and price recovery. In addition, the asset’s Chaikin Money Flow indicator value, noted at 0.46, is pointing to strong buying pressure in the market. Also, the positive CMF shows that capital is flowing into the asset—a robust accumulation trend.
Notably, the daily Relative Strength Index (RSI) is positioned at 82.12, indicating the asset’s sturdy bullish momentum, deep in the overbought territory. It raises the risk of a pullback or correction. OKB’s Bull Bear Power (BBP) reading of 78.28 suggests the resilient bullish dominance in the market. The buyers are pushing the price above, confirming the uptrend.
Highlighted Crypto News
Bitcoin Stress Test: Can BTC Defend the $110K Line or Bow Out in a Slide?
Disclaimer: The information on this page may come from third parties and does not represent the views or opinions of Gate. The content displayed on this page is for reference only and does not constitute any financial, investment, or legal advice. Gate does not guarantee the accuracy or completeness of the information and shall not be liable for any losses arising from the use of this information. Virtual asset investments carry high risks and are subject to significant price volatility. You may lose all of your invested principal. Please fully understand the relevant risks and make prudent decisions based on your own financial situation and risk tolerance. For details, please refer to
Disclaimer.
