As Bitcoin (BTC) falls below $118,000, Ethereum Name Service (ENS), Curve DAO (CRV), and Sei (SEI) continue their upward momentum in the Asian early trading session today (16th). From a technical perspective, as the upward trend strengthens and indicators suggest a potential trend reversal, the altcoin market remains bullish.
ENS Price Analysis
FXStreet analyst Vishal Dixit stated that as of the time of writing, ENS has risen nearly 9%, marking the fourth consecutive bullish candle on the daily chart. The altcoin has reached a five-month high, surpassing the $24.88 level tested on June 11.
If the closing price is above that level, it could extend the trend reversal rebound to the level of $28.29, with the last test on February 23.
The 50-day Exponential Moving Average (EMA) is gradually approaching the 100-day EMA. Typically, cautious investors may view this as a buying signal.
The Moving Average Convergence Divergence (MACD) indicator shows that as the histogram bars break through the zero line, bullish momentum is strengthening.
If ENS fails to maintain its dominance above $24.88, it may continue to fall and test the 200-day EMA at $21.33.
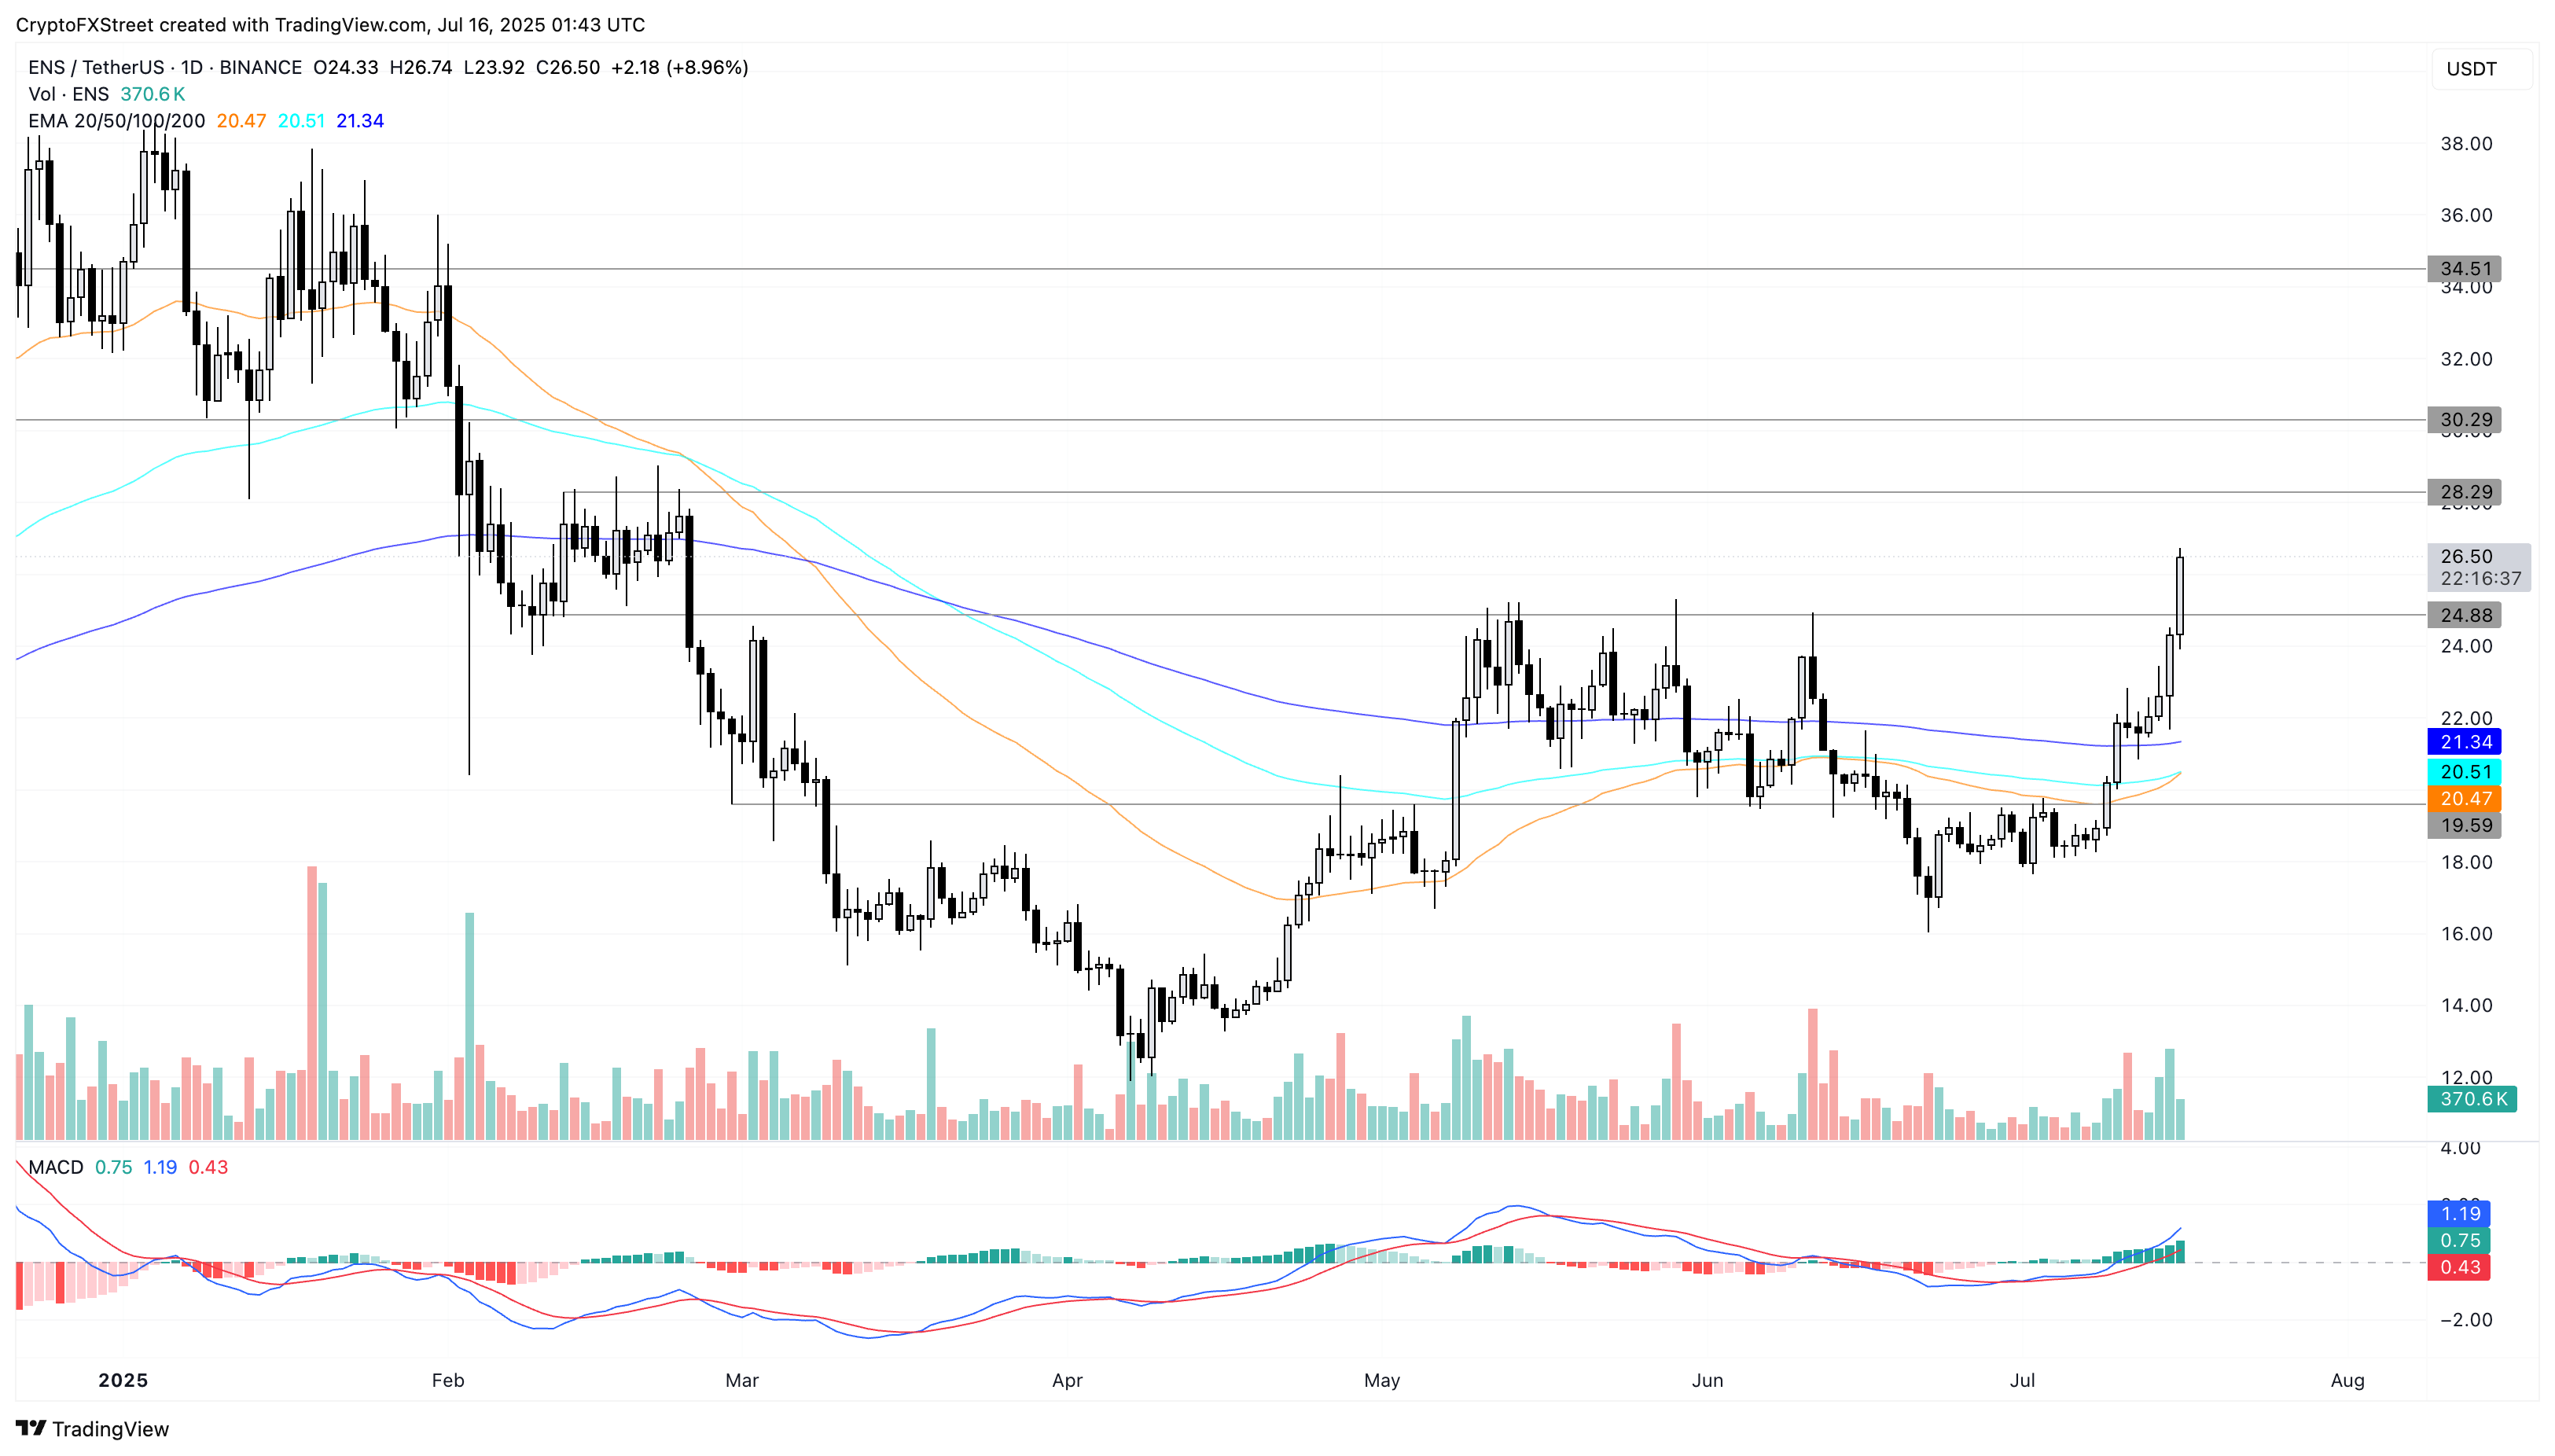
(Source: Trading View)
CRV Price Analysis
As of Wednesday, CRV’s stock price has risen slightly by 4%, maintaining an upward trend for the fourth consecutive day. The target of the upward trend is the 50% Fibonacci retracement level of $0.80, which is the retracement from the closing price of $1.24 on December 6 to the closing price of $0.36 on March 10.
If the daily closing price is above that level, the upward trend may extend to the 61.8% Fibonacci level, which is 0.91 USD.
The 50-day and 200-day EMA show a golden cross, indicating that the short-term trend surpasses the long-term trend, signaling a trend reversal.
The MACD and its signal line cross above the signal line, and the green histogram bars rise from the same line, indicating a surge in bullish momentum.
The downside is that CRV reversed from the 50% Fibonacci level of $0.80, which could lead to a pullback to the closing price level of $0.73 on June 10.
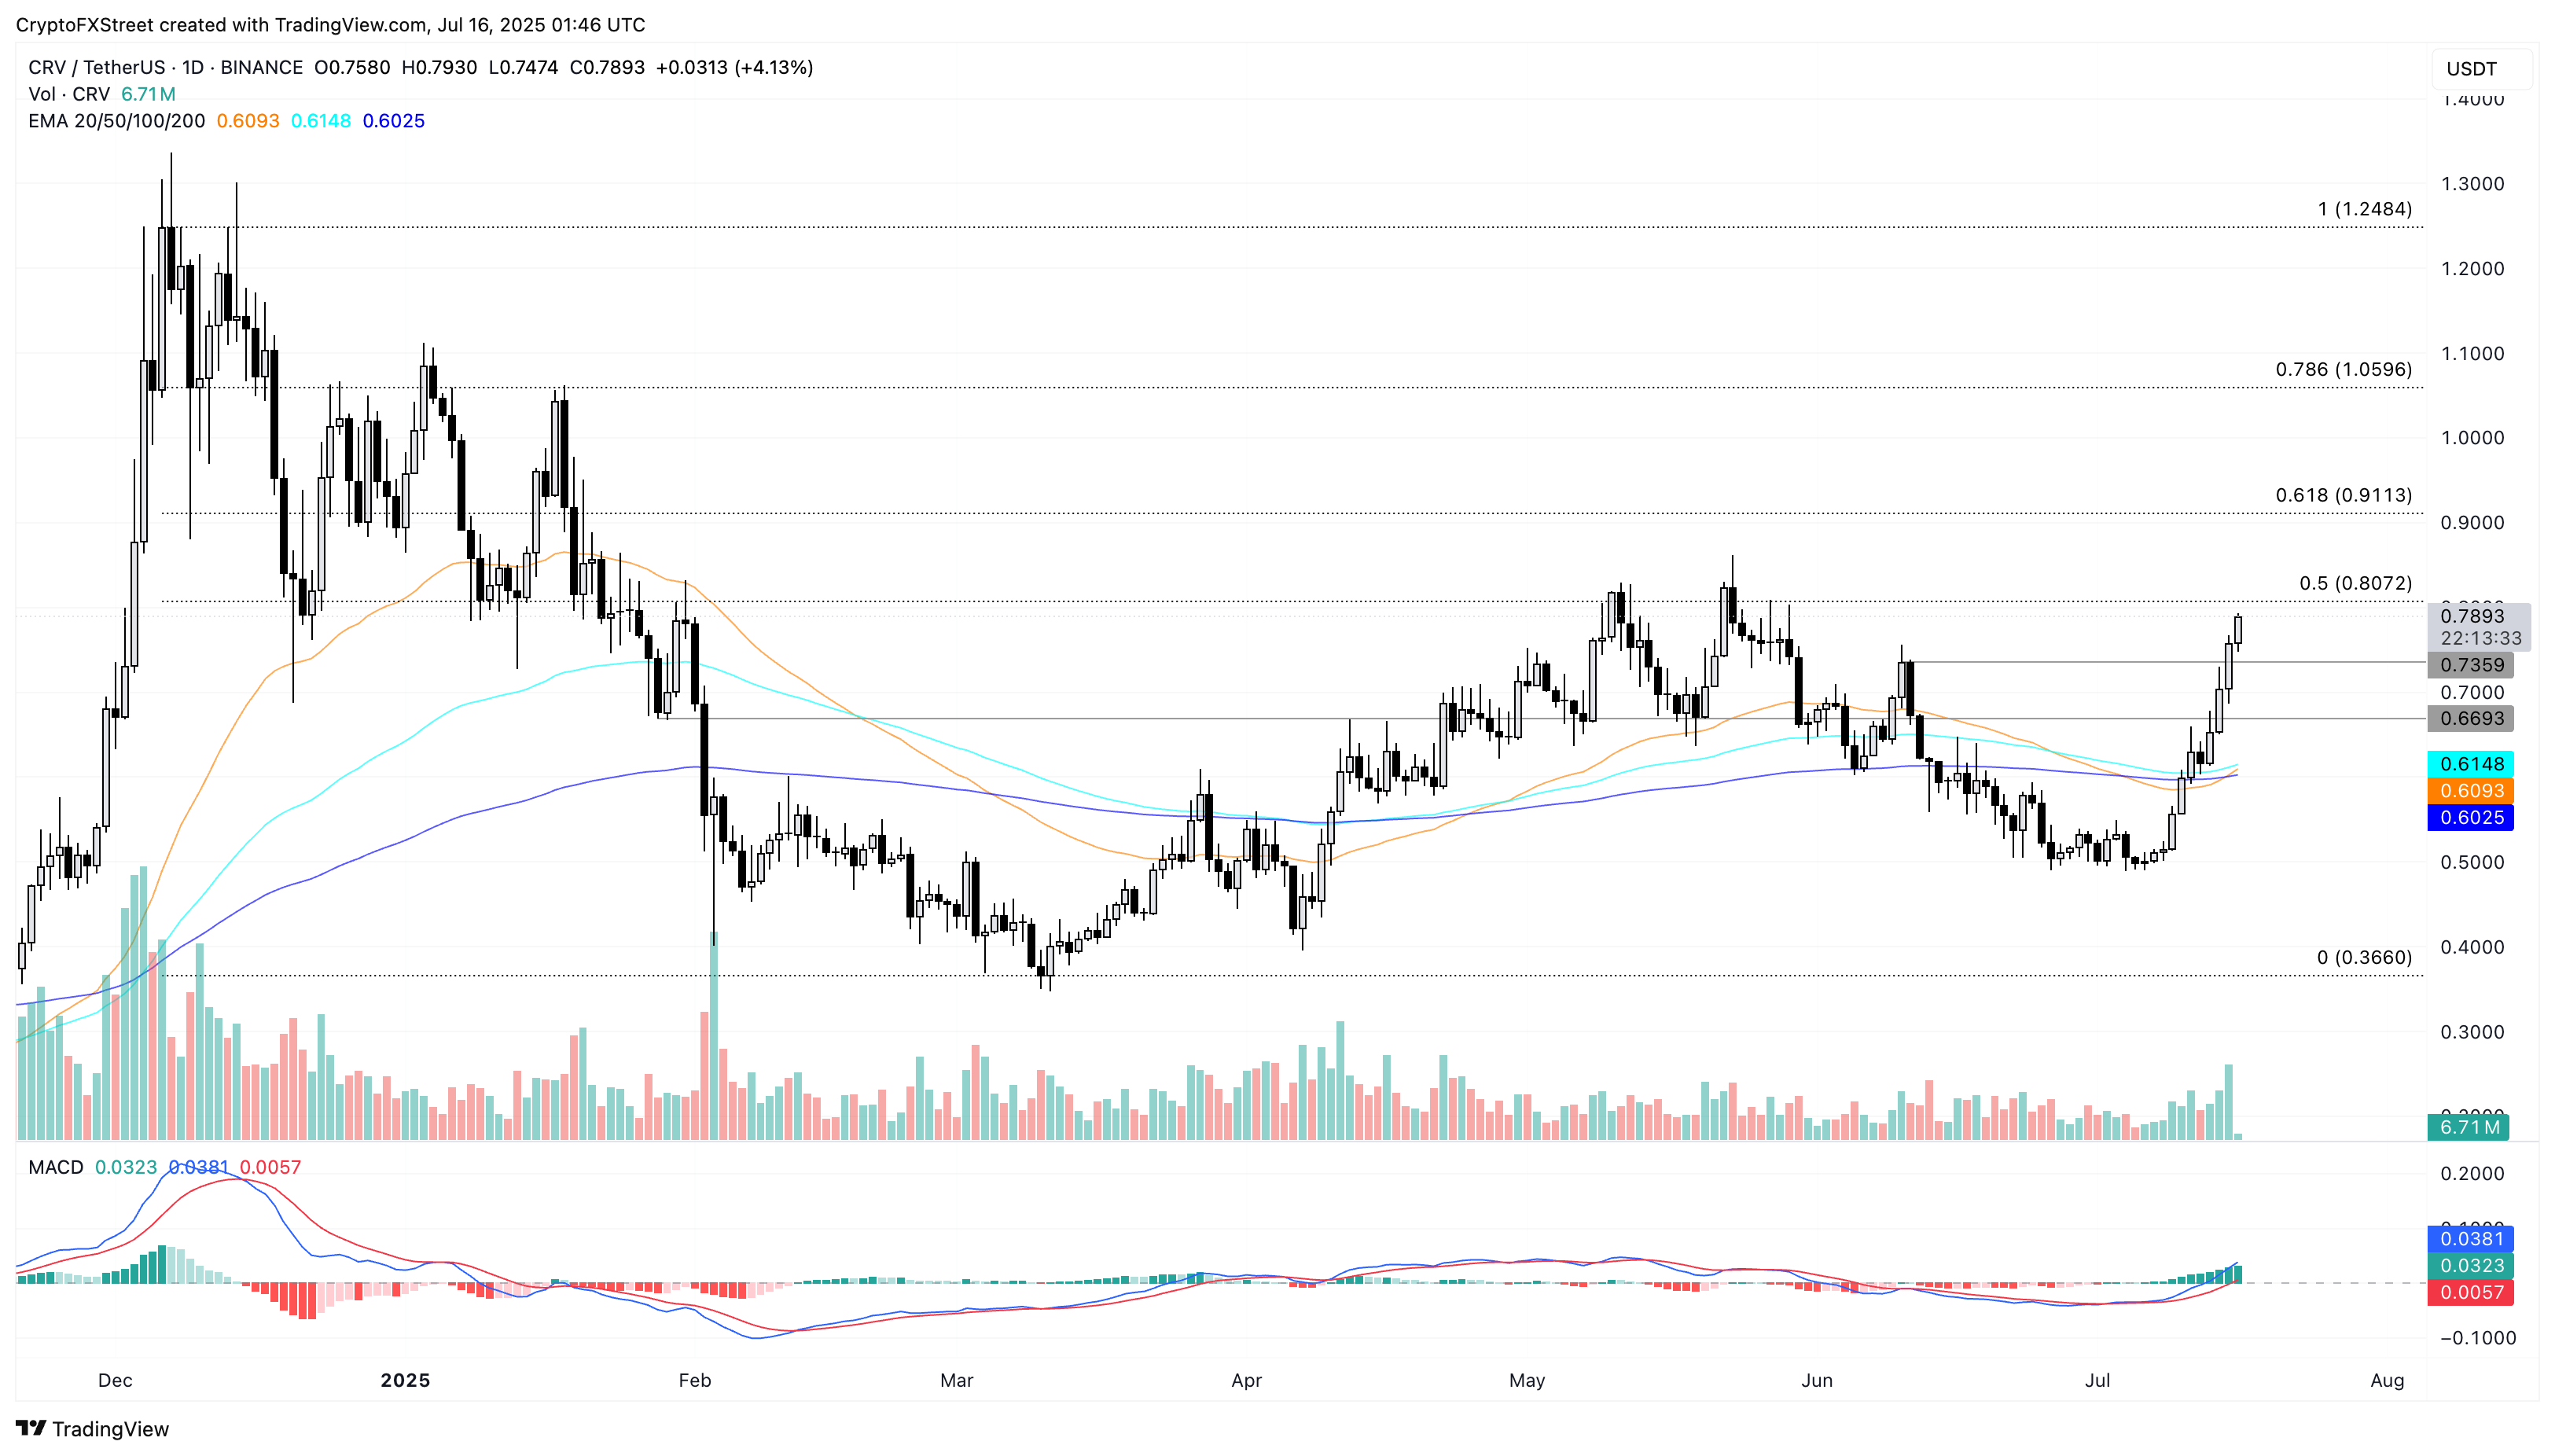
(Source: Trading View)
SEI Price Analysis
As of Wednesday’s publication, SEI has risen 1%, maintaining Tuesday’s 10% increase. The altcoin broke through the resistance level of $0.3642 (the last test was on January 21), setting a six-month high.
A decisive bullish candle above that level may extend the uptrend to the level of $0.4804, which is the highest point so far this year.
The 50-day moving average is rising, gradually approaching the 200-day moving average, indicating a golden cross. The MACD indicator has crossed above the signal line, and the green histogram bars are continuously increasing, breaking above the zero line, suggesting a strengthening bullish momentum.
Conversely, if the closing price of SEI is below 0.3642 USD, it may retest the level of the high point of June 24 at 0.3066 USD.
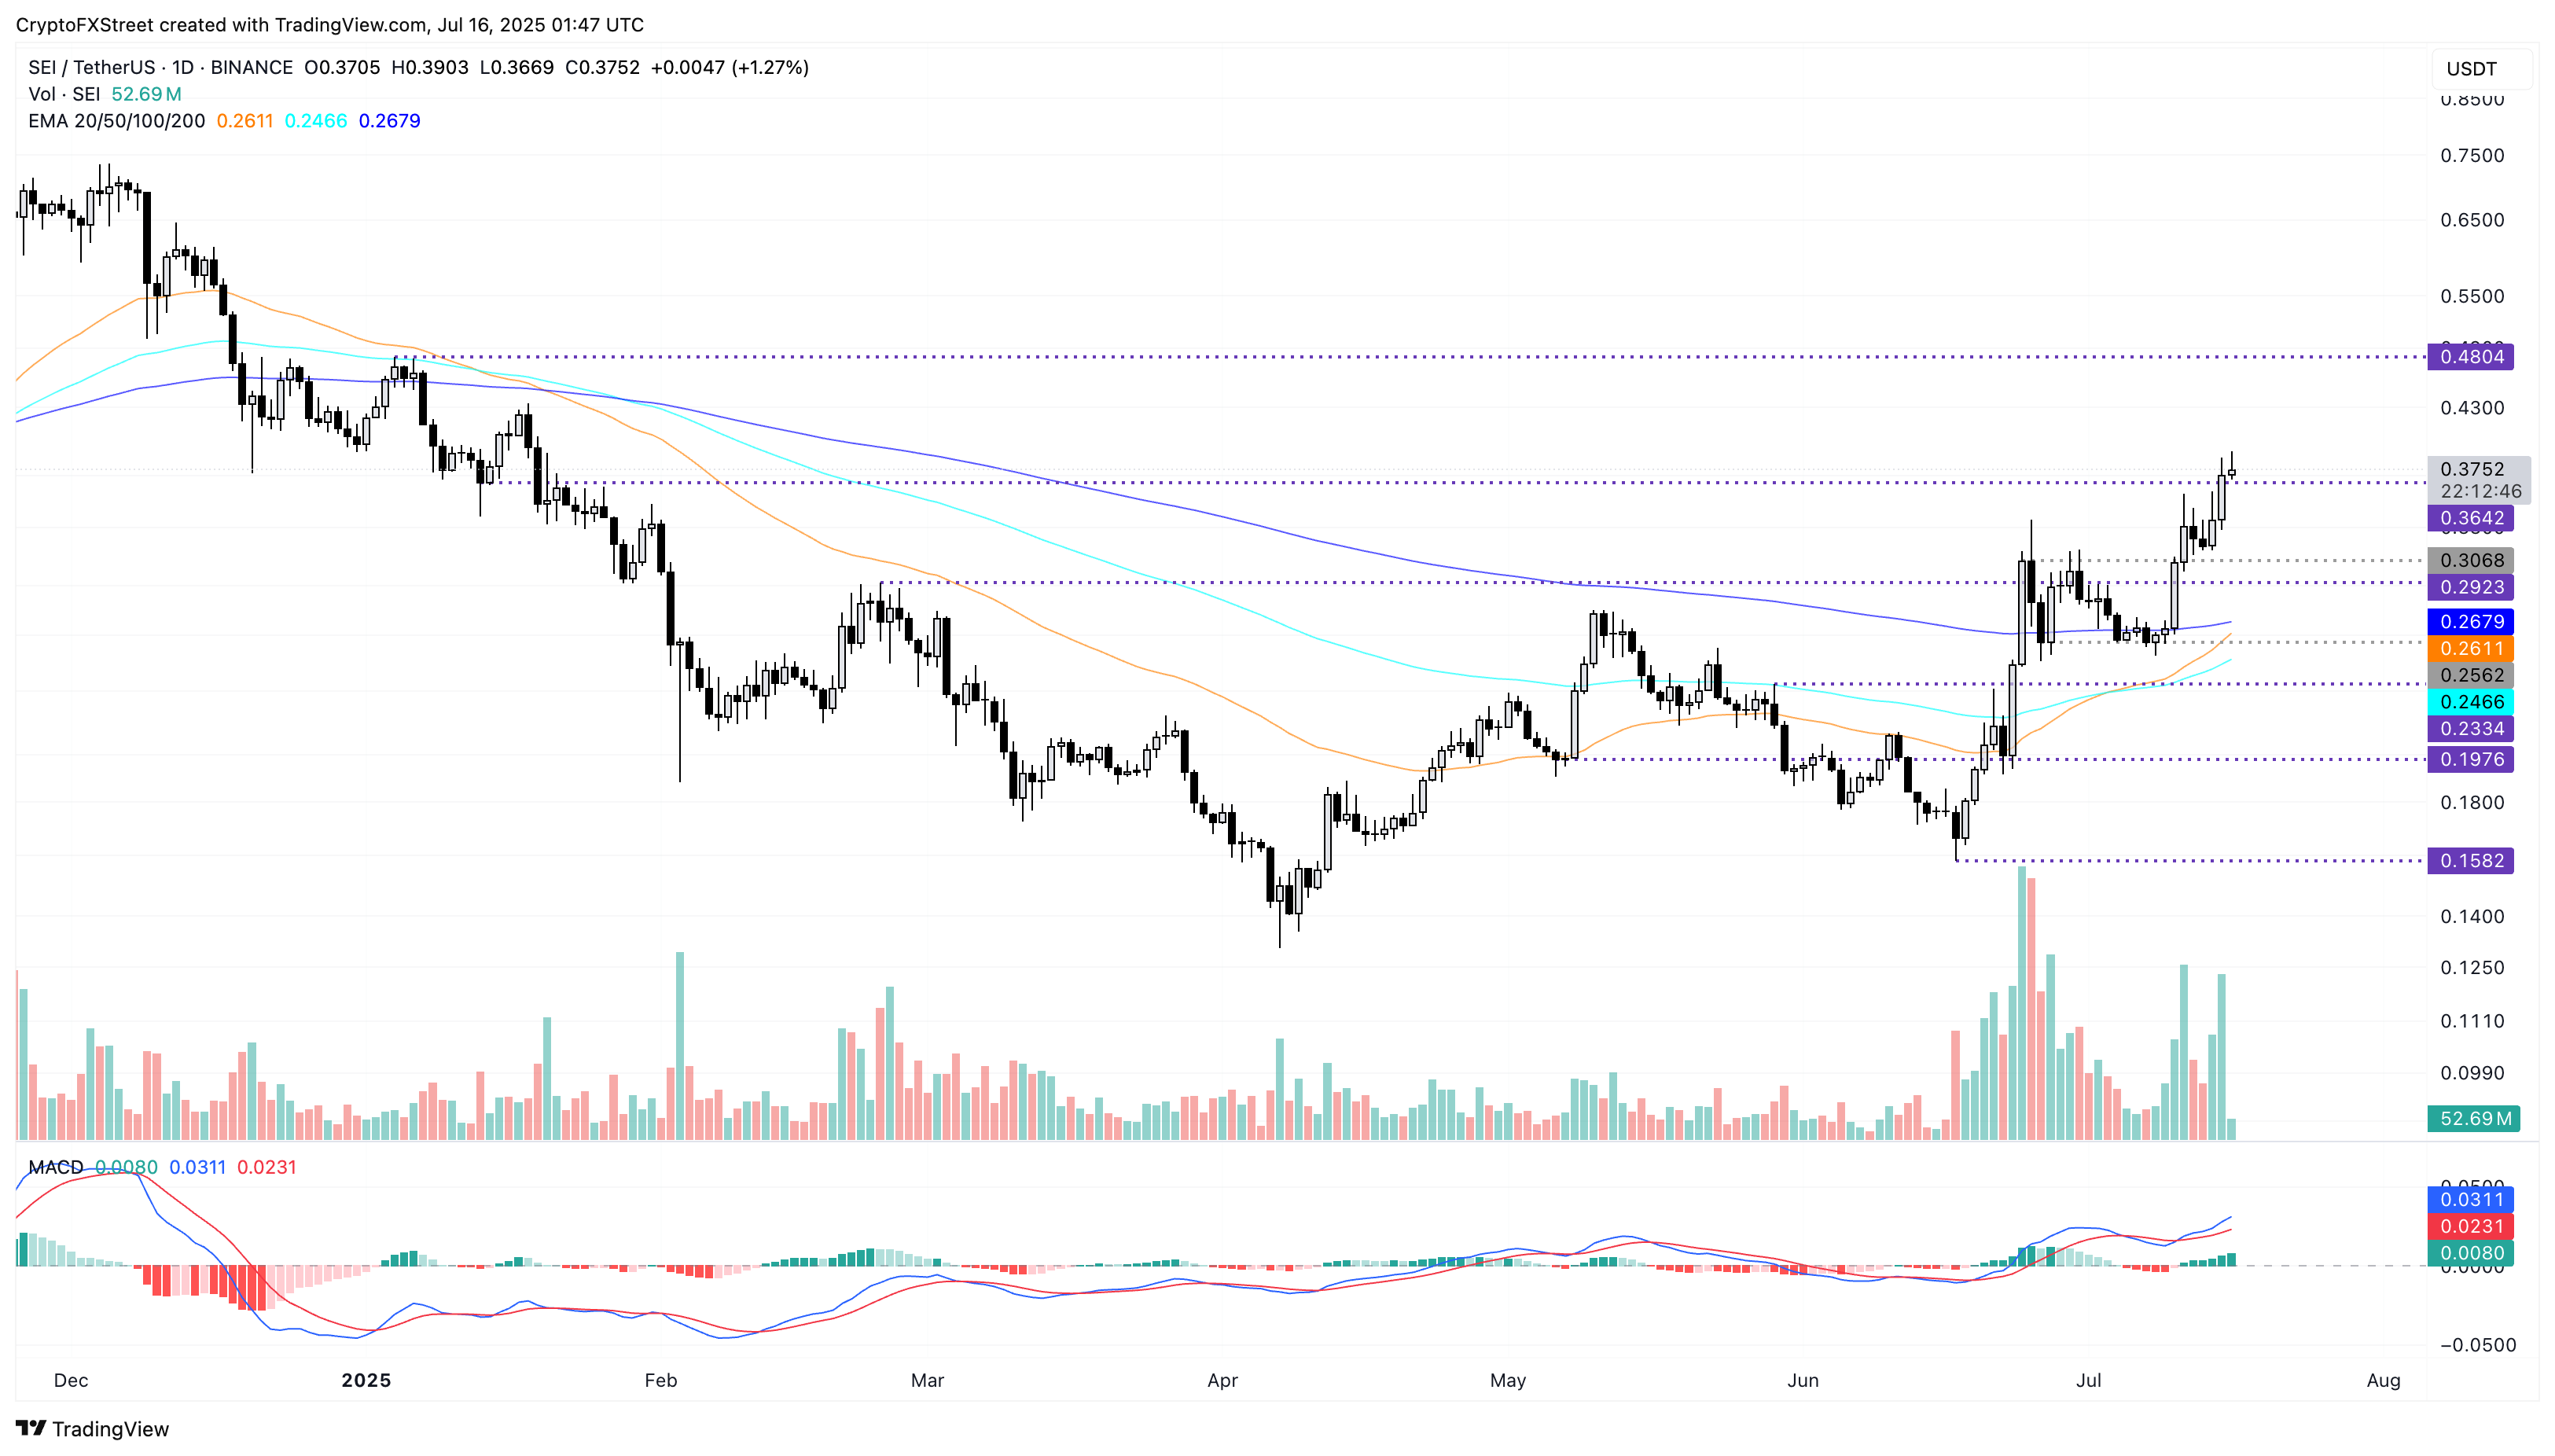
(Source: Trading View)
Disclaimer: The information on this page may come from third parties and does not represent the views or opinions of Gate. The content displayed on this page is for reference only and does not constitute any financial, investment, or legal advice. Gate does not guarantee the accuracy or completeness of the information and shall not be liable for any losses arising from the use of this information. Virtual asset investments carry high risks and are subject to significant price volatility. You may lose all of your invested principal. Please fully understand the relevant risks and make prudent decisions based on your own financial situation and risk tolerance. For details, please refer to
Disclaimer.