
Key Highlights
-
Bitcoin trades near $96,400 after a strong breakout from an ascending triangle pattern.
-
Retail social sentiment has turned increasingly bearish, historically a contrarian bullish signal.
-
Santiment data shows fear dominating social commentary, despite price strength.
-
BTC has reclaimed key structure above $95K, keeping bullish momentum intact.
-
Technical projection from the breakout points toward a $108K upside target.
Bitcoin (BTC) is showing renewed strength as the market moves deeper into mid-January 2026. On January 15, BTC is trading near $96,400, after rallying to a local high of around $97,900 a day earlier. The move followed softer-than-expected U.S. inflation data and renewed confidence across risk assets, helping crypto regain momentum after weeks of consolidation.
While price action has turned constructive, what’s happening beneath the surface is even more interesting. Retail sentiment around Bitcoin has shifted sharply bearish, even as BTC continues to push higher — a combination that has historically favored further upside.
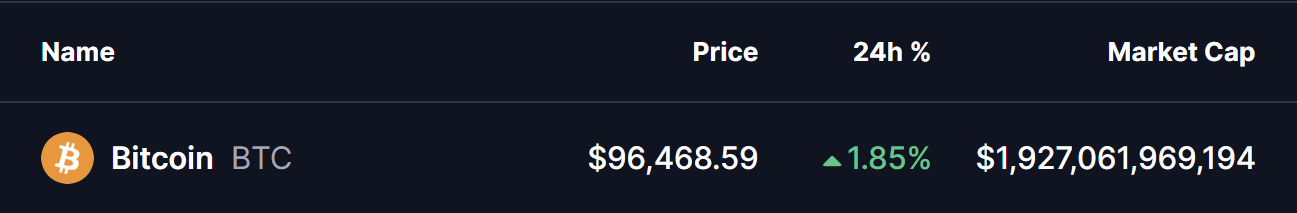
Source: Coinmarketcap
Bearish Crowd Santiment
According to social data from Santiment, commentary surrounding Bitcoin across social platforms has become increasingly negative over the past several days. Despite BTC rebounding strongly this week, fear and skepticism are dominating online discussions.
This divergence between price and sentiment is notable. In past market cycles, Bitcoin has often moved against retail expectations, with major rallies forming when confidence is low and doubt is widespread. Santiment data shows the current level of bearish commentary is among the highest seen in the last 10 days — a period that previously coincided with upside continuation.
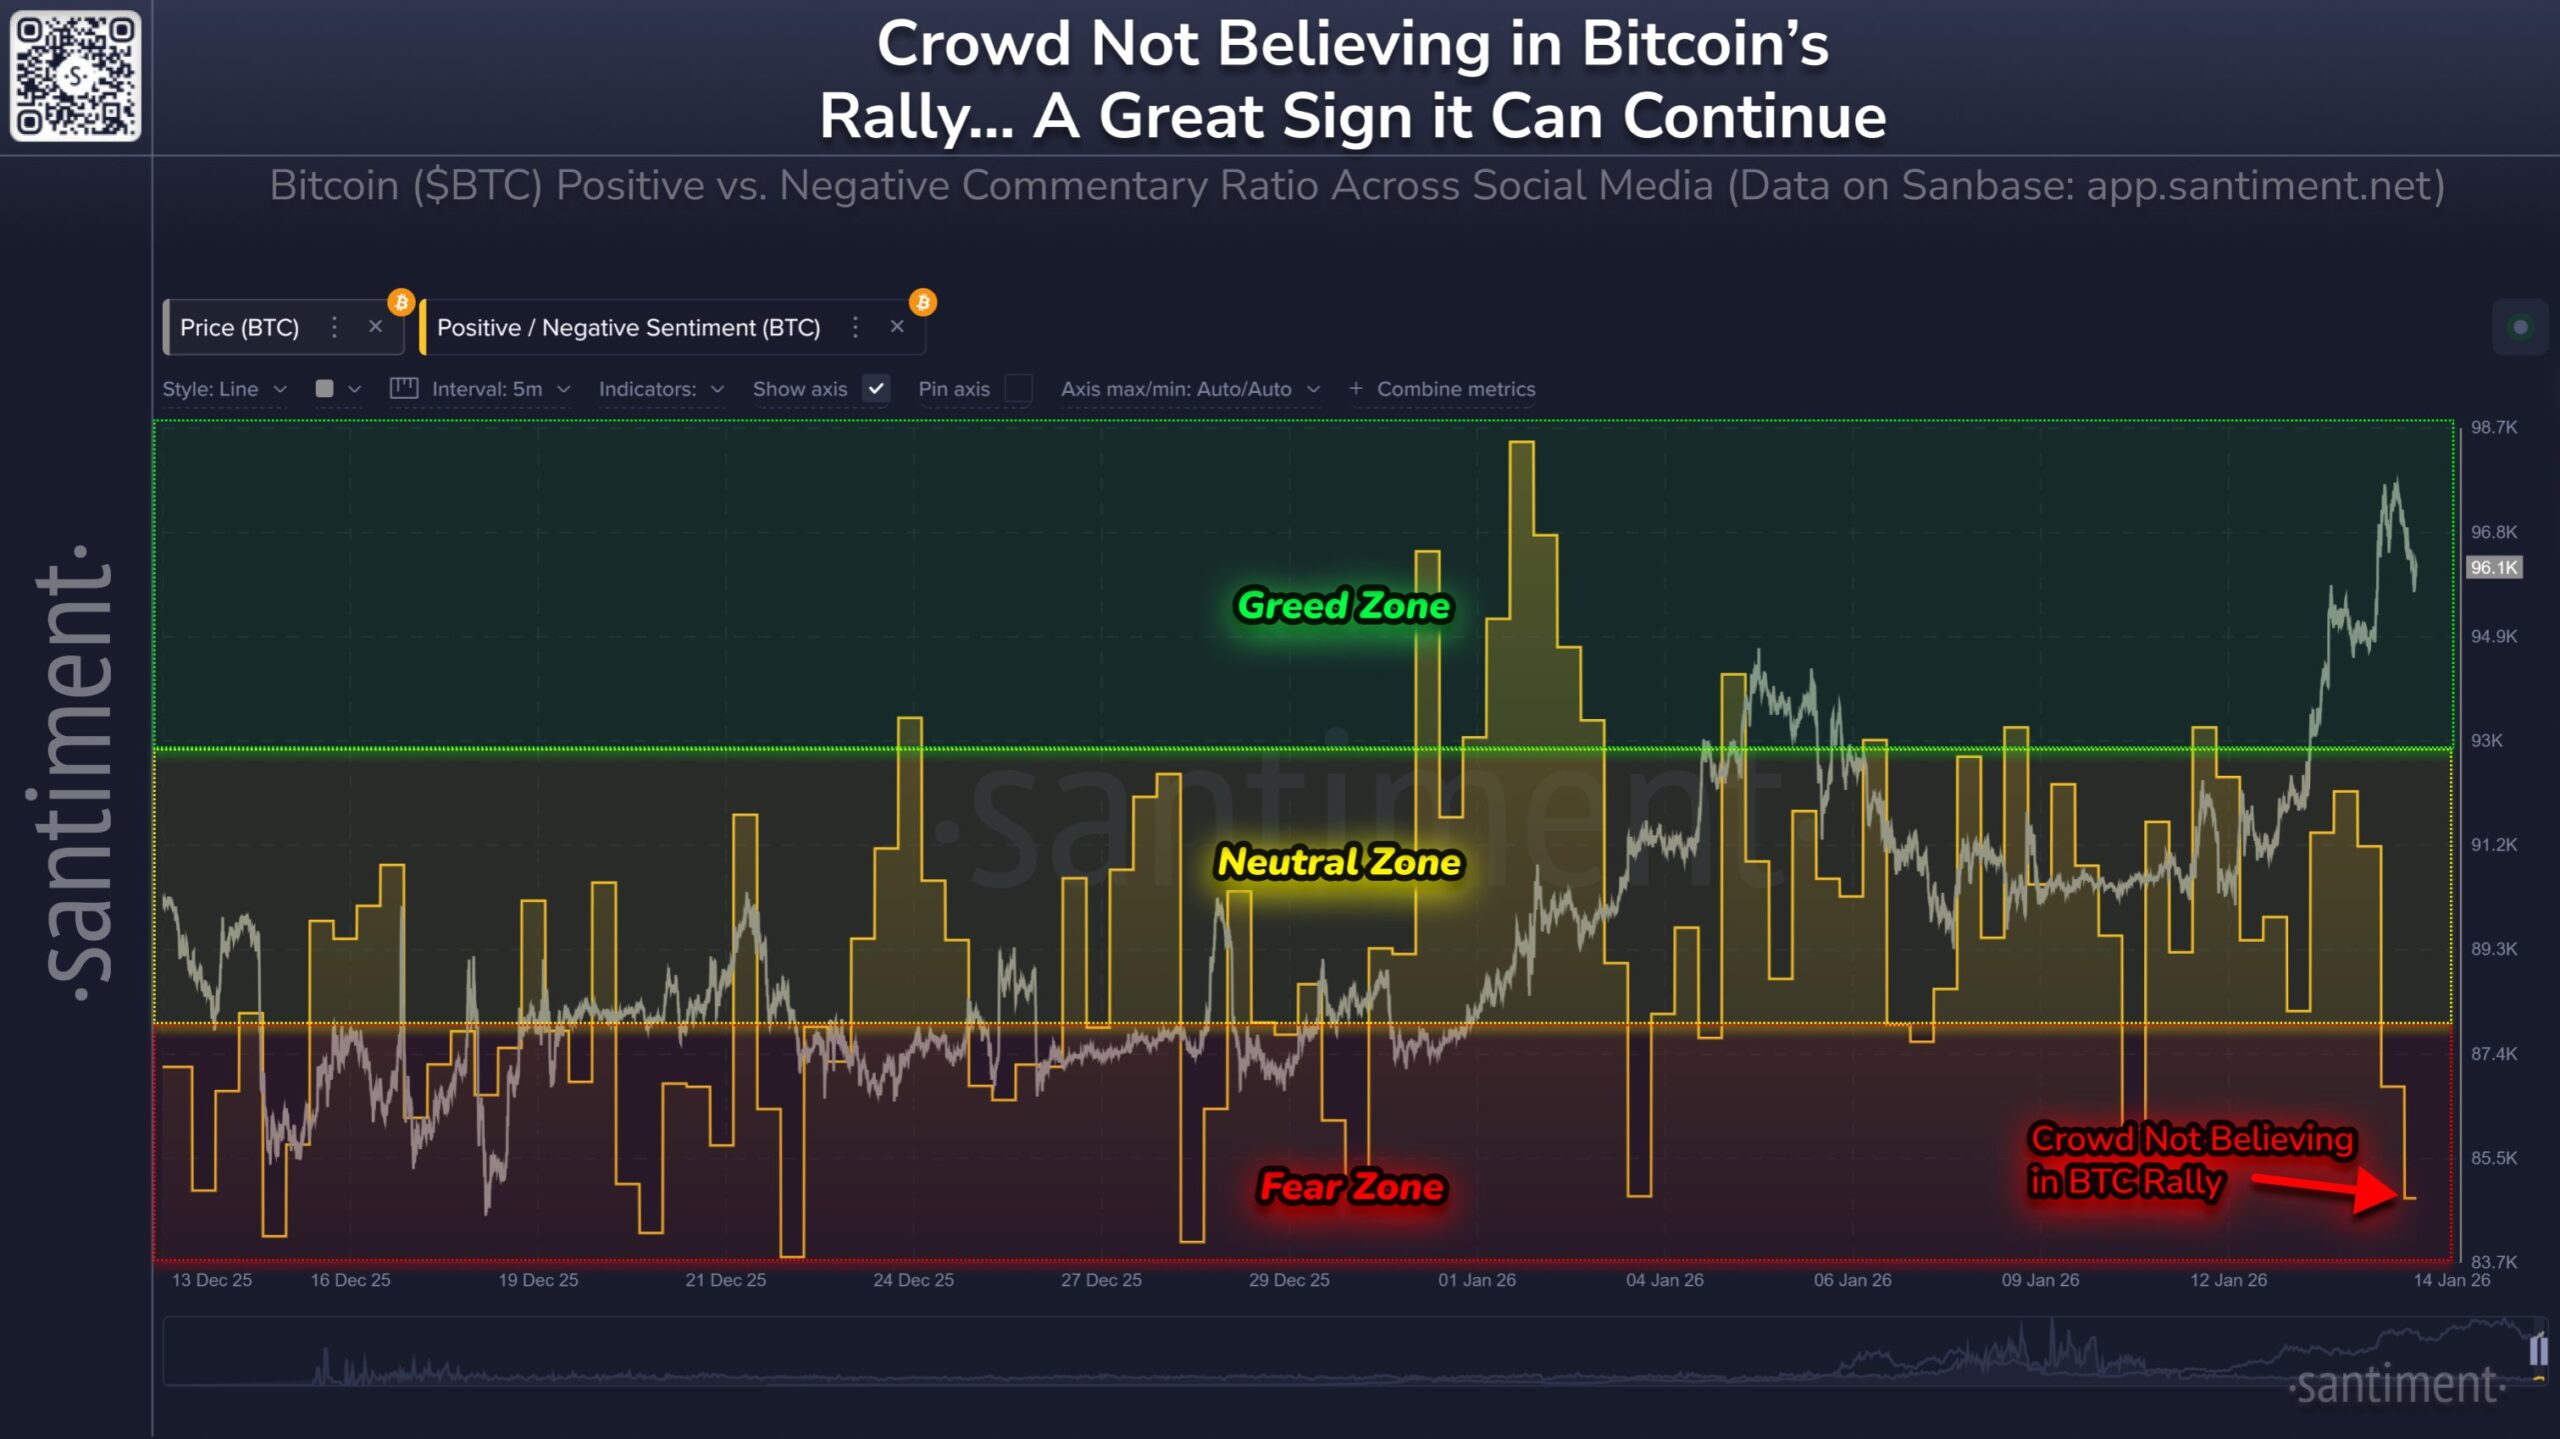
BTC Social Sentiment Data/Source: @santimentfeed (X)
In simple terms, while price is climbing, the crowd is still hesitant to believe in the rally. From a contrarian perspective, that skepticism may act as fuel rather than resistance.
Bitcoin Breaks Out on the Daily Chart
From a technical standpoint, Bitcoin’s structure has improved meaningfully. The daily chart shows BTC breaking out of an ascending triangle, a bullish continuation pattern defined by higher lows pressing against a horizontal resistance zone.
The breakout occurred around $94,700, followed by a strong push toward the $97,900 region. This move confirmed buyer control and shifted market structure firmly back in favor of bulls. Price is now hovering just below the 100-day moving average, a level that often acts as a short-term decision point during trend transitions.
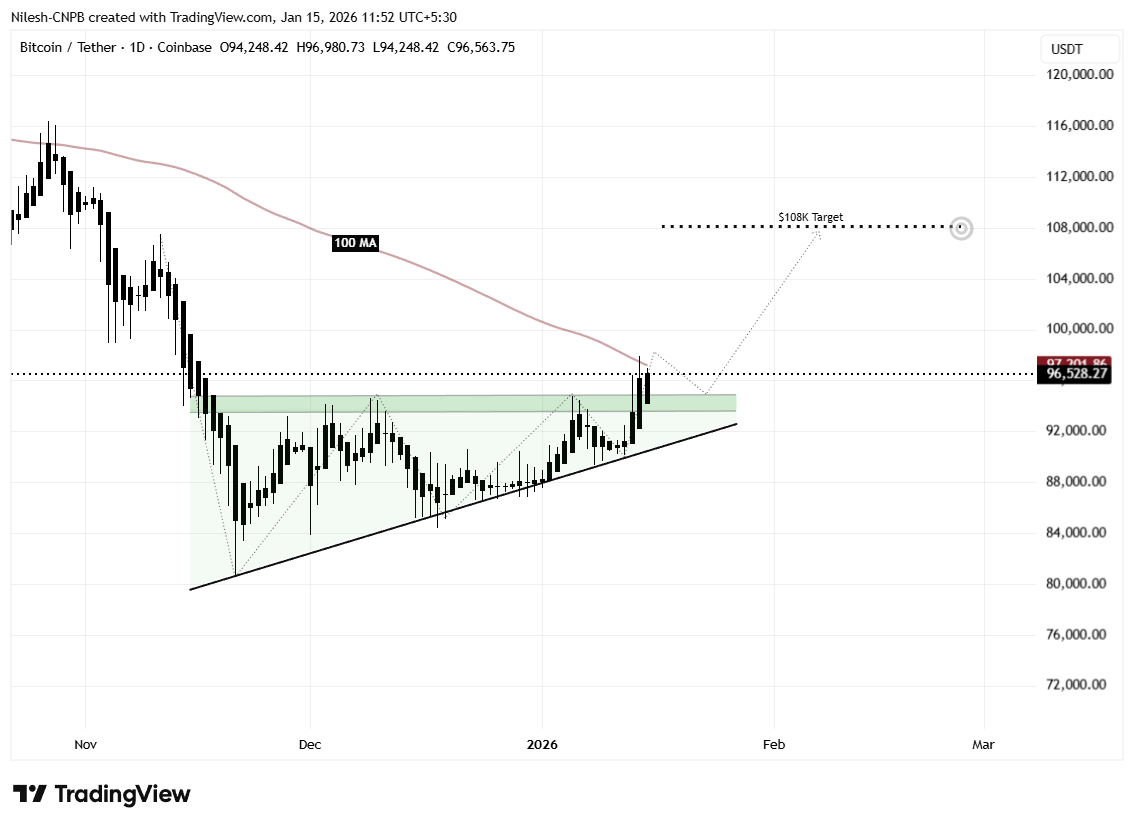
Bitcoin (BTC) Daily Chart/Coinsprobe (Source: Tradingview)
A brief pause or retest near the breakout zone would be considered healthy and would not weaken the broader bullish setup, as long as BTC holds above the prior consolidation range.
Sentiment and Structure Are Aligning
What makes the current setup compelling is the alignment between technical strength and negative retail sentiment. While price action suggests accumulation and trend continuation, social data shows hesitation and disbelief — a classic backdrop for further upside.
Historically, major Bitcoin rallies rarely begin when the crowd is confident. Instead, they tend to accelerate when skepticism lingers, forcing sidelined participants to chase price higher as resistance levels break.
If momentum continues, the measured move from the ascending triangle points toward the $108,000 region, with the $100,000 psychological level likely to act as the next major magnet along the way.
What This Means Going Forward
Bitcoin is currently at a critical juncture. As long as BTC maintains strength above the mid-$95K area, the bullish breakout remains valid. The combination of improving macro sentiment, strong technical structure, and growing retail fear creates a setup that favors continuation rather than reversal.
While volatility is always expected in crypto markets, the broader picture suggests Bitcoin’s rally may still have room to run — especially if skepticism continues to dominate social sentiment as price climbs.
Frequently Asked Questions (FAQ)
Why is bearish sentiment considered bullish for Bitcoin?
Historically, Bitcoin tends to move opposite to retail sentiment. When fear and pessimism dominate social media, it often signals that selling pressure is exhausted, creating room for upside moves.
What pattern is Bitcoin forming on the daily chart?
Bitcoin has broken out of an ascending triangle, a bullish continuation pattern defined by higher lows and horizontal resistance.
What price level is critical for BTC right now?
Holding above the $95,000–$97,000 zone is important to maintain bullish structure and momentum.
What is Bitcoin’s upside target based on the chart?
The measured move from the ascending triangle points toward the $108,000 region if momentum continues.
Can Bitcoin revisit $100K soon?
If current sentiment divergence and technical strength persist, a move back above $100,000 is increasingly likely.
Disclaimer: The views and analysis presented in this article are for informational purposes only and reflect the author’s perspective, not financial advice. Technical patterns and indicators discussed are subject to market volatility and may or may not yield the anticipated results. Investors are advised to exercise caution, conduct independent research, and make decisions aligned with their individual risk tolerance.
About Author: Nilesh Hembade is the Founder and Lead Author of Coinsprobe, with over 5 years of experience in the cryptocurrency and blockchain industry. Since launching Coinsprobe in 2023, he has been providing daily, research-driven insights through in-depth market analysis, on-chain data, and technical research.
Disclaimer: The information on this page may come from third parties and does not represent the views or opinions of Gate. The content displayed on this page is for reference only and does not constitute any financial, investment, or legal advice. Gate does not guarantee the accuracy or completeness of the information and shall not be liable for any losses arising from the use of this information. Virtual asset investments carry high risks and are subject to significant price volatility. You may lose all of your invested principal. Please fully understand the relevant risks and make prudent decisions based on your own financial situation and risk tolerance. For details, please refer to
Disclaimer.
Related Articles
XRP ETF Performance Praised as 'Really Impressive' by Bloomberg - U.Today
XRP ETFs have shown resilience amid a 45% price drop, attracting significant capital despite typical market behavior. Bloomberg's Eric Balchunas highlights strong investor support. Despite recent outflows, the funds retain substantial assets, indicating community dedication.
UToday16m ago
Crypto Shines Amid Middle East Oil Shock and Market Selloff
Bitcoin remains stable amid market turmoil fueled by rising oil prices and inflation, outperforming traditional assets. Its reduced leverage limits forced selling, attracting long-term investors eyeing potential gains in a volatile landscape.
CryptoFrontNews22m ago
XRP Holds $1.34 Support While Leverage Heatmap Highlights $1.30 Risk Zone
XRP is trading at $1.36 in a tight range of support at $1.34 and resistance at $1.37.
The heatmap data indicates that there is a huge amount of long positions in the range of $1.30.
Should prices fall to around $1.30, long positions with high leverage in this region might
CryptoNewsLand56m ago
ETH drops 1.07% in 15 minutes: whale fund concentration triggers short-term pullback
March 10, 2026, 18:00 to 18:15 (UTC), ETH's return within the 15-minute candlestick was -1.07%, with price fluctuations ranging from 2049.1 to 2073.15 USDT, an amplitude of 1.16%. During the same period, market trading volume significantly increased by over 32%, large on-chain fund flows occurred frequently, triggering short-term market sentiment fluctuations, rapidly increasing attention, and intensifying volatility risks.
The main driver of this abnormal movement is the concentrated sell-off by whale funds. On-chain data shows that within this time window, there were four large transfers exceeding 5000 ETH, all flowing to a major...
GateNews1h ago
BTC 15-minute decline of 0.70%: On-chain large transfers and macro bearish signals resonate, triggering short-term selling pressure
From 18:00 to 18:15 (UTC) on March 10, 2026, BTC experienced a significant price fluctuation, with a 15-minute return of -0.70%. The price range was 70366.3-70915.0 USDT, with an amplitude of 0.77%. During the same period, trading volume increased by 18% compared to the previous hour's average, and the order book depth temporarily narrowed, indicating increased market volatility and heightened attention.
The main drivers of this fluctuation were multiple large on-chain fund transfers and macro news resonance. Between 18:03 and 18:12, there were several on-chain transactions exceeding 500
GateNews1h ago
XRP Slides to $1.42 After Losing $1.80–$2 Neckline as $1.39 Support Faces Immediate Test
XRP dropped to less than the $1.80-2 neckline and a key support area became an overhead and the overall trend was altered.
The current short-term trading corridor is between the support and resistance of the asset which is between $1.39 and $1.47 respectively.
A price above $1.39 will
CryptoNewsLand1h ago