Crypto ETF outflows December capped a challenging end to 2025, with heavy redemptions reflecting selective de-risking amid broader risk aversion.
(Sources: SoSoValue)
However, early January data reveals Bitcoin ETF bottoming out patterns and clear Ethereum ETF stabilization, suggesting the intense selling phase has largely run its course. This analyst insight analyzes the shift in ETF flow indicators crypto, institutional positioning signals, the role of MSCI’s retention decision, and whether “are crypto ETF outflows over” leans toward recovery as of January 9, 2026.
December Outflows in Context: Selective Crypto De-Risking
Crypto ETF outflows December stood out against record $235 billion global equity ETF inflows, highlighting digital assets’ unique pressures. JPMorgan analysts attribute much of the selling to position unwinds following October’s MSCI review concerns rather than systemic liquidity breakdowns.
Bitcoin and Ethereum products absorbed the bulk, with outflows contrasting resilient equity and fixed-income demand.
- Scale Contrast: Crypto redemptions vs. equity record inflows.
- Primary Driver: Anticipatory de-risking ahead of index decisions.
- Market Breadth: No broad liquidity deterioration observed.
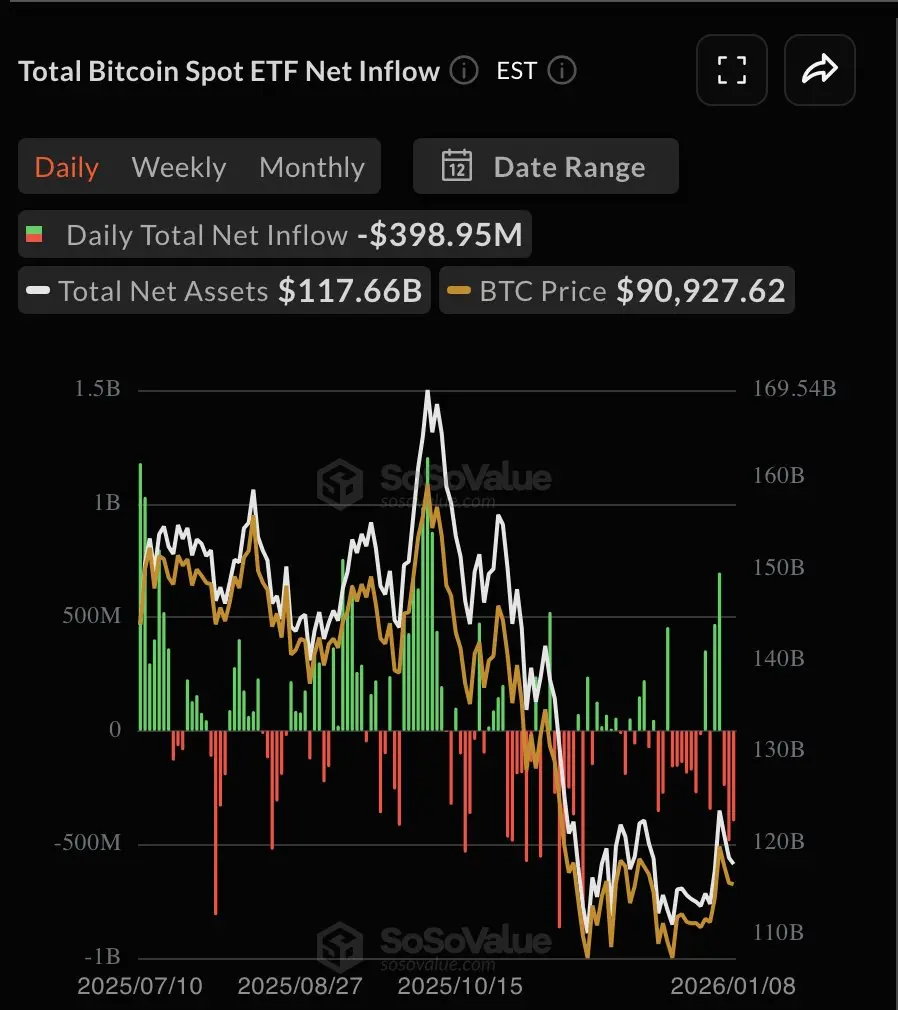
Bitcoin ETF Bottoming Out: Early Reversal Signals
January flows indicate Bitcoin ETF bottoming out, with net redemptions tapering and initial positive prints emerging. CME futures and perpetual positioning show reduced sell-side dominance, supporting the view that institutional unwinds are nearing completion.
- Flow Trend: Shift from heavy outflows to stabilization.
- Futures Metrics: Easing short pressure in CME contracts.
- Volume Impact: No significant liquidity strain during correction.
- Bottoming Evidence: Early inflow days post-December.
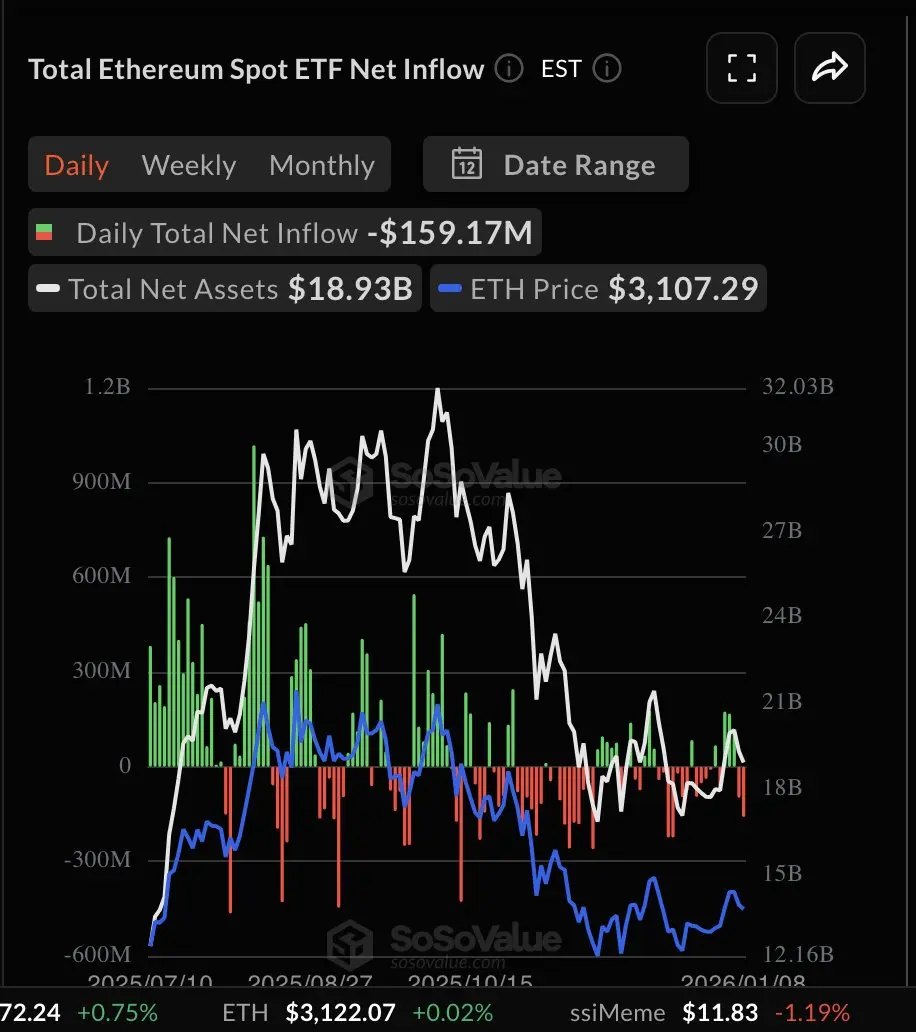
Ethereum ETF Stabilization Alongside Broader Recovery
(Sources: SoSoValue)
Parallel dynamics drive Ethereum ETF stabilization: outflows have moderated, with ETF flow indicators crypto flashing reduced velocity. Combined with Bitcoin patterns, this suggests synchronized institutional repositioning rather than isolated weakness.
- Stabilization Markers: Declining redemption pace.
- Correlation: Aligned with Bitcoin ETF trends.
- Sentiment Support: Improving perpetual funding rates.
ETF Flow Indicators Crypto Point to De-Risking Exhaustion
Multiple ETF flow indicators crypto—including open interest, volume absorption, and futures basis—show no evidence of forced liquidation cascades. Analysts view the correction as orderly position reduction, now potentially exhausted.
MSCI’s February 2026 confirmation retaining treasury firms in benchmarks provided critical relief, eliminating fears of passive forced selling.
- Key Relief: MSCI inclusion retention.
- Indicator Consensus: Position cuts largely complete.
- Institutional ETF Demand: Poised for potential re-entry.
Outlook: Are Crypto ETF Outflows Over?
The convergence of Bitcoin ETF bottoming out, Ethereum ETF stabilization, and supportive ETF flow indicators crypto tilts toward cautious optimism that the worst of crypto ETF outflows December-style pressure is behind us. Absent new macro shocks, renewed institutional ETF demand could emerge as the next driver.
While full reversal requires confirmation through sustained positive flows, current evidence suggests a constructive inflection point rather than ongoing deterioration.
In summary, early 2026 signals of Bitcoin ETF bottoming out and Ethereum ETF stabilization indicate the crypto ETF outflows December wave has likely crested, with ETF flow indicators crypto pointing to de-risking exhaustion bolstered by MSCI relief. This positions the sector for potential inflow recovery, marking a pivotal shift in institutional crypto allocation dynamics. Monitor weekly flow reports and futures positioning for validation—always reference primary data sources and regulated platforms when assessing cryptocurrency ETF trends.
Disclaimer: The information on this page may come from third parties and does not represent the views or opinions of Gate. The content displayed on this page is for reference only and does not constitute any financial, investment, or legal advice. Gate does not guarantee the accuracy or completeness of the information and shall not be liable for any losses arising from the use of this information. Virtual asset investments carry high risks and are subject to significant price volatility. You may lose all of your invested principal. Please fully understand the relevant risks and make prudent decisions based on your own financial situation and risk tolerance. For details, please refer to
Disclaimer.
Related Articles
Bitcoin Reaches Historic Milestone: 20 Million BTC Mined
Gate News bot message, Bitcoin has reached a historic milestone with 20,000,000 BTC officially mined. The milestone was achieved at block 939,999, mined by Foundry USA pool. The total circulating supply now exceeds 95.2%. Mining the first 20 million coins took just over 17 years. Due to the halving
GateNews2m ago
In the past hour, the entire network has liquidated $90.08 million, and crude oil futures contracts have liquidated $29.2 million.
Gate News Report, March 9th, Coinglass data shows that in the past hour, the total liquidation across the entire network reached $90,084,300, with long positions liquidated at $43,935,600 and short positions at $46,148,700. By asset type, XYZ:CL (Crude Oil Futures Contract) liquidation was $29.2 million, and BTC liquidation was $22.12 million.
GateNews42m ago
Bitcoin Price Bounces, But Bears Are Still in Control: Analysis
In brief
Bitcoin is up 4.78% today trading at $69,128.
Last week's apparent triangle breakout closed as a massive bullish wick — a classic false breakout signal.
On Myriad, prediction market traders are split among bulls and bears, with no clear consensus on which way the squeeze
Decrypt1h ago
BTC 15-minute increase of 1.42%: On-chain capital inflow and technical breakout points resonate to trigger buying interest
From 19:15 to 19:30 on March 9, 2026 (UTC), the BTC price experienced a 15-minute return of +1.42%, with trading ranges between 68,377.3 and 69,365.3 USDT, and a volatility of 1.44%. This fluctuation far exceeds the regular intraday volatility levels, with market attention significantly heightened, and short-term buying surges intensifying the volatility.
The main driver of this movement was net inflow of on-chain funds, triggered by large transfers from major holder accounts, along with buy orders breaking through key technical resistance levels.
GateNews1h ago