Bitcoin (BTC) frustrated traders on Christmas Eve as rangebound BTC price action contrasted with record highs in gold and silver.
Key points:
-
Bitcoin plays a “waiting game” as bidders stay focused on precious metals.
-
A giant options expiry event should set the scene for BTC price upside, analysis says.
-
Gold coils after hitting $4,500 for the first time in history.
Bitcoin gets $100,000 post-expiry target
Data from TradingView showed BTC/USD clinging to $87,000 with the Christmas holidays around the corner.
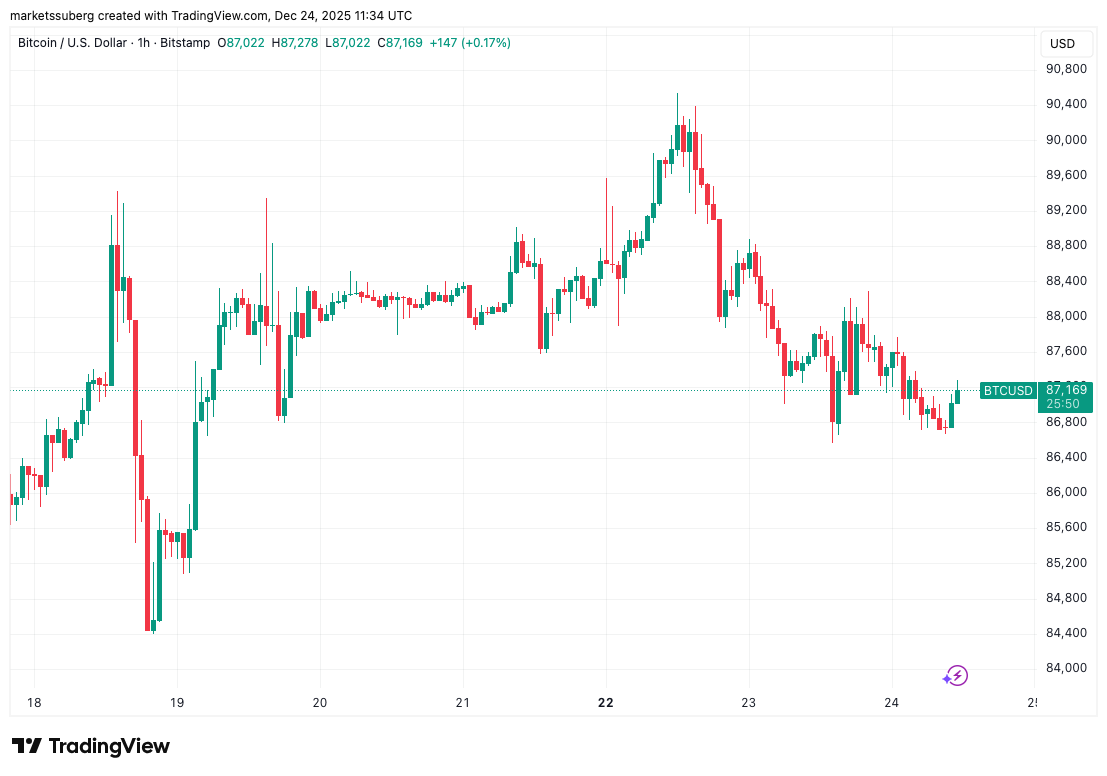
BTC/USD one-hour chart. Source: Cointelegraph/TradingView
These were tipped to provide volatility of their own — especially with a record options expiry event due Friday.
“Historically, BTC has tended to experience 5 to 7% swings during the Christmas period, a pattern often linked to year-end options expiries rather than fresh fundamental catalysts,” trading company QCP Capital commented in its latest “US Color” market update.
“This Friday’s record expiry is no exception. Roughly 300k BTC option contracts, equivalent to $23.7bn, alongside 446k IBIT option contracts, are set to expire.”
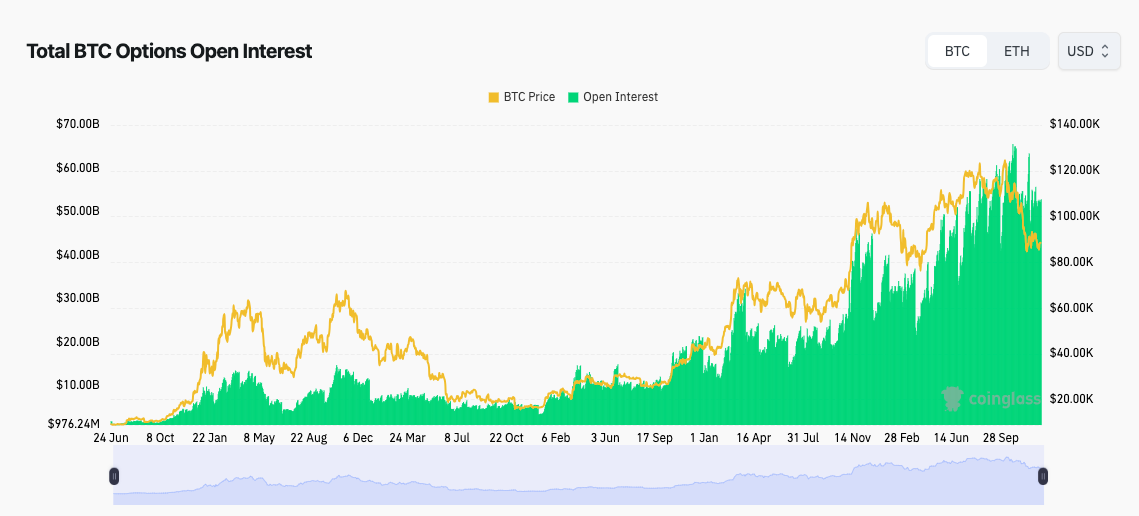
Total BTC options open interest (screenshot). Source: CoinGlass
QCP noted that the expiry constituted over half of open interest on major exchange Deribit, with the “max pain” level at $95,000.
“A clearer picture of downside positioning should emerge after Friday’s options expiry, particularly whether the large December 85k Puts are rolled forward, closed out, or replaced further down the curve,” it added.
The expiry had been of interest to market participants for some time. Earlier in the month, executive David Eng described the event as “acting like a lid” on BTC price upside.
“Before expiry, Bitcoin looks weak and boring. After expiry, structure changes,” he told X followers, giving $100,000 as an initial target.
“This is a textbook setup: volatility suppressed by design, then released by the calendar.”
Bitcoin plays “waiting game” as stocks, gold rise
On shorter timeframes, patience was running thin.
**Related: **__Bitcoin’s lack of ‘crazy’ year-end price means no hard crash in Q1: Pomp
“Bitcoin currently stalls between $85-90K for multiple weeks. It’s a waiting game,” crypto trader, analyst and entrepreneur Michaël van de Poppe summarized Tuesday.
Van de Poppe argued that stocks first needed to find a local high before capital could flow back into crypto — a theory also applied to precious metals.
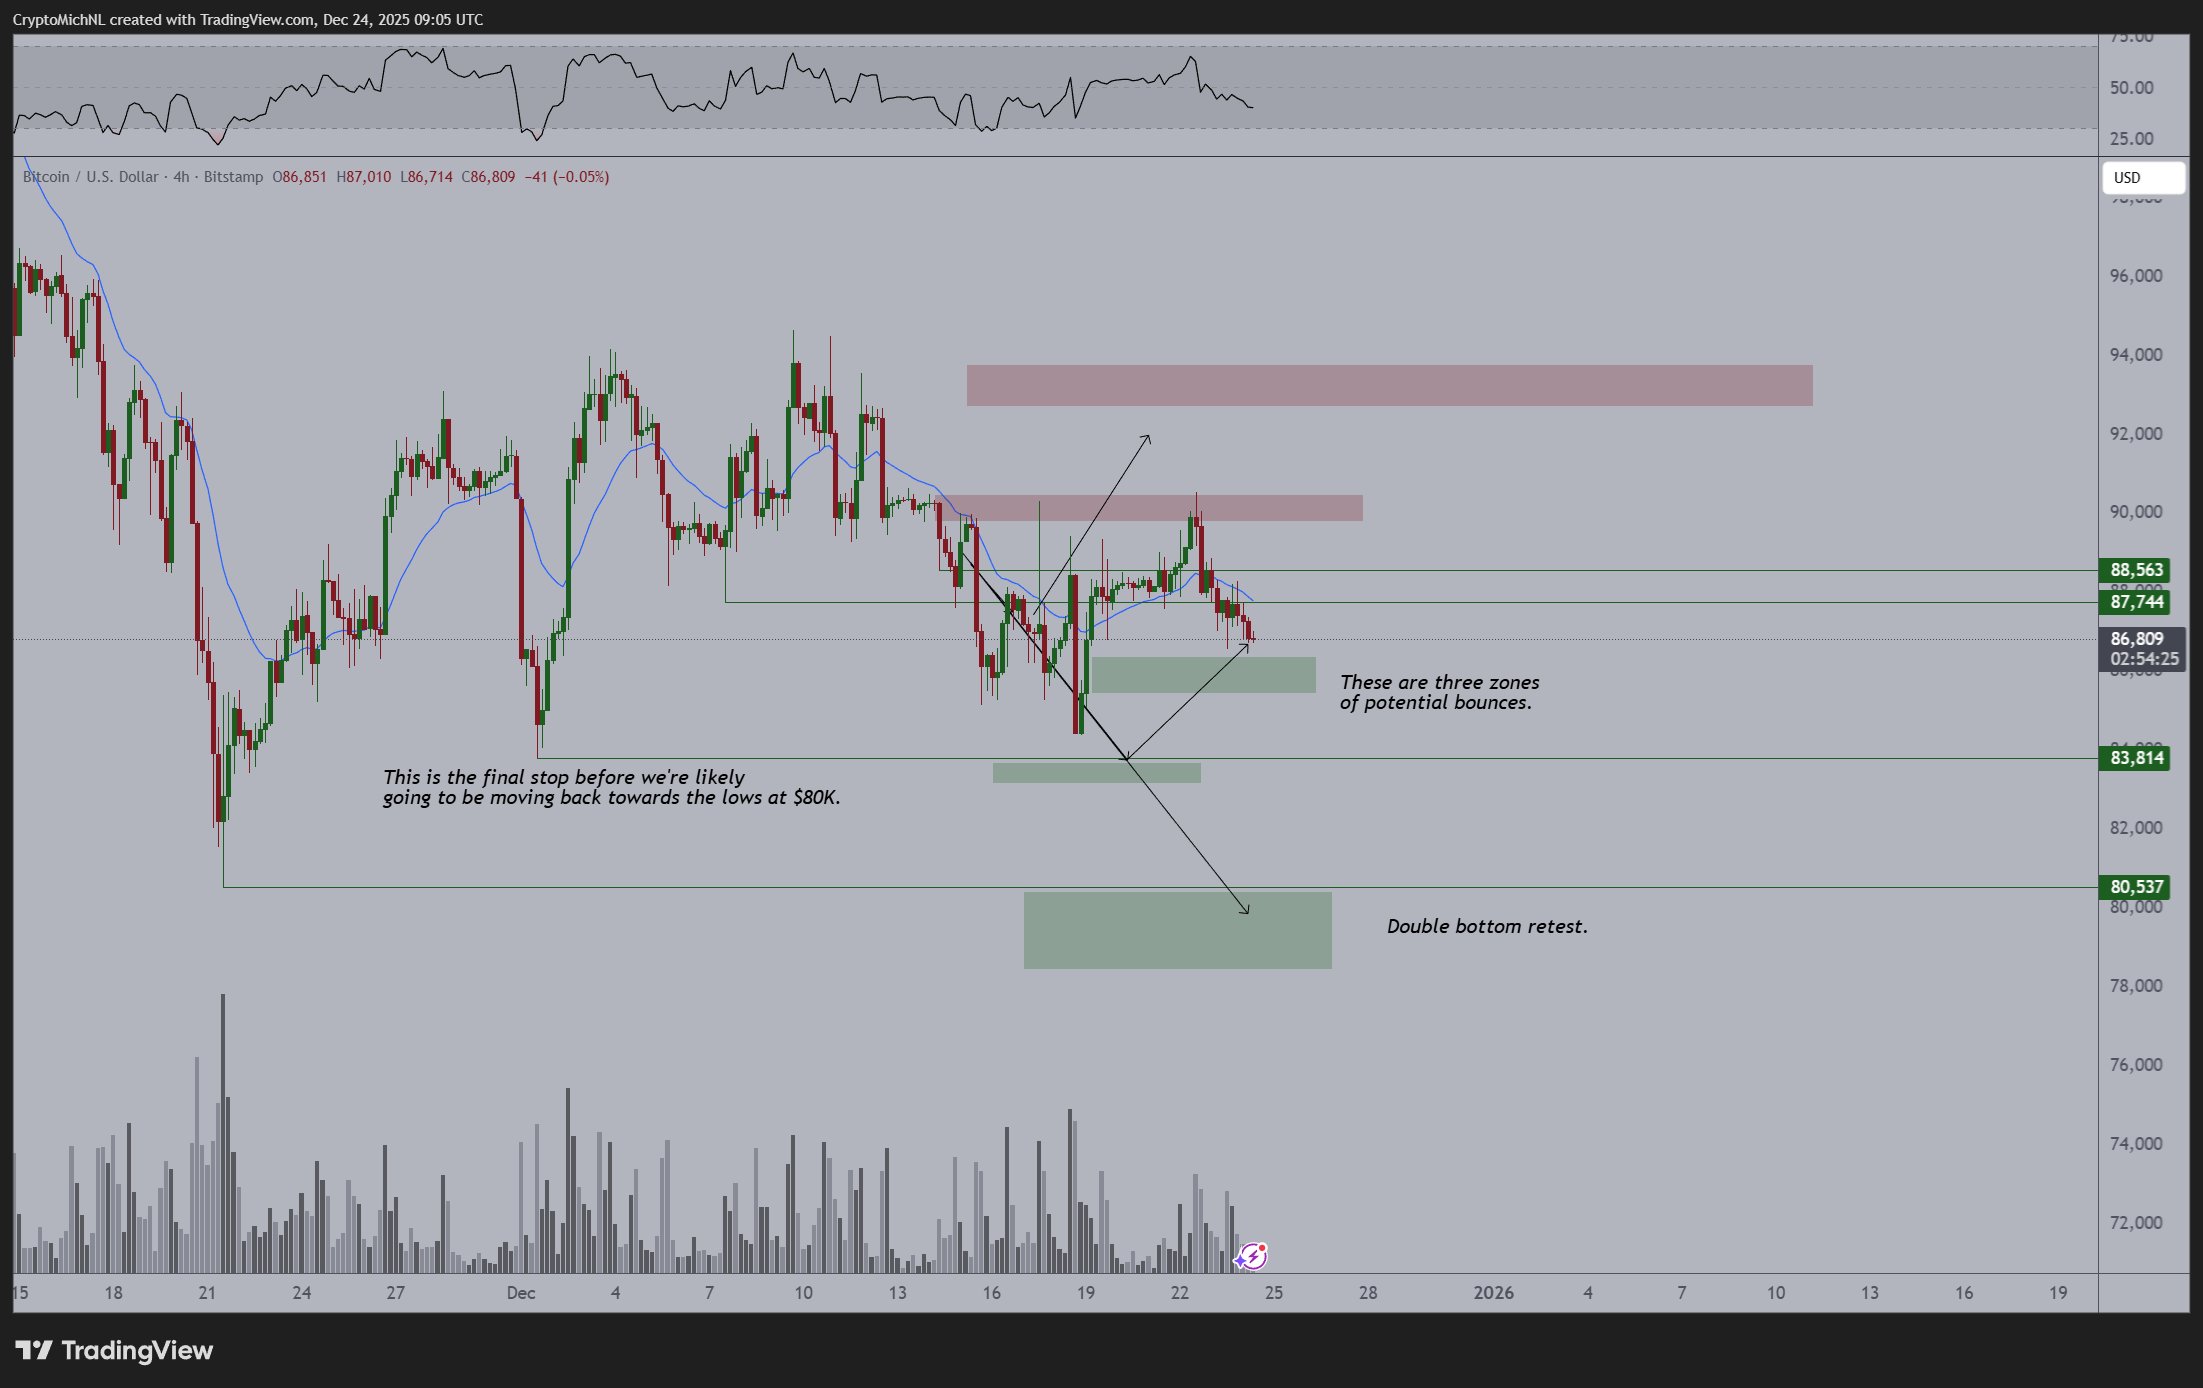
BTC/USD four-hour chart with RSI data. Source: Michaël van de Poppe/X
As Cointelegraph reported, gold and silver continued to enjoy price discovery through the week, with XAU/USD reaching $4,500 per ounce for the first time ever.
“The upside in silver, palladium, and platinum is a short squeeze and unsustainable,” market commentator Garrett responded to Cointelegraph coverage on X.
“Once they start to reverse, they are likely to drag gold lower as well. The capital will rotate out of precious metals and into BTC and ETH.”
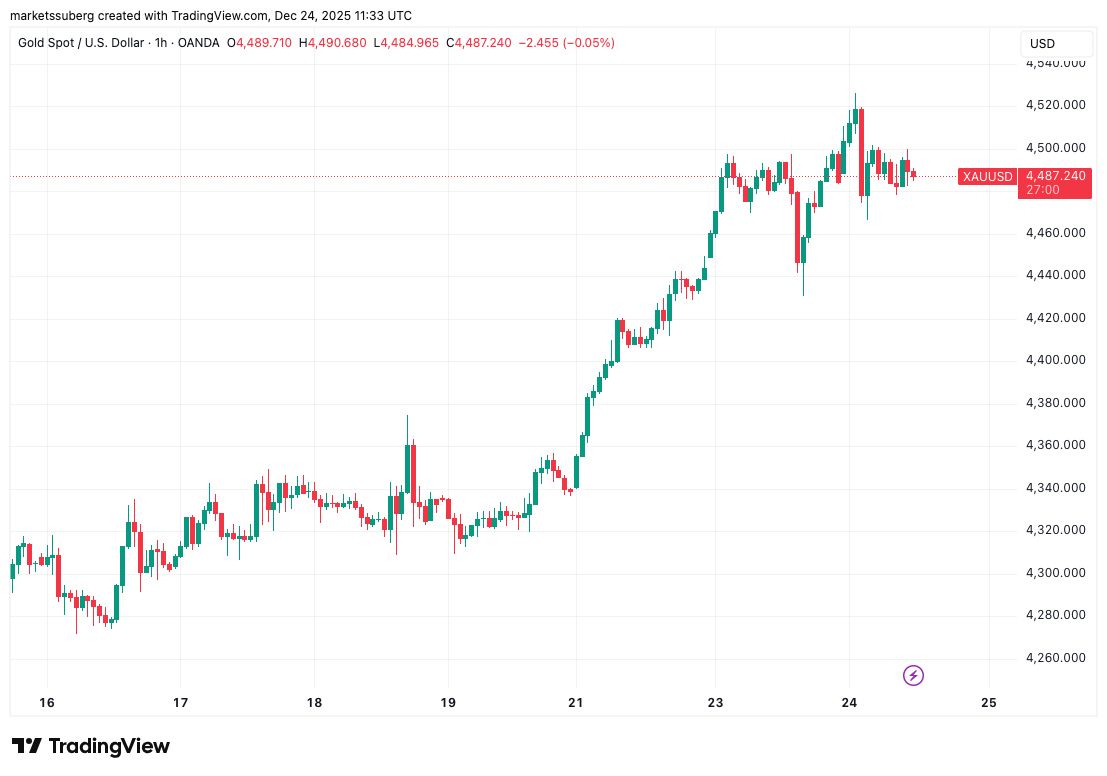
XAU/USD one-hour chart. Source: Cointelegraph/TradingView
This article does not contain investment advice or recommendations. Every investment and trading move involves risk, and readers should conduct their own research when making a decision. While we strive to provide accurate and timely information, Cointelegraph does not guarantee the accuracy, completeness, or reliability of any information in this article. This article may contain forward-looking statements that are subject to risks and uncertainties. Cointelegraph will not be liable for any loss or damage arising from your reliance on this information.
Disclaimer: The information on this page may come from third parties and does not represent the views or opinions of Gate. The content displayed on this page is for reference only and does not constitute any financial, investment, or legal advice. Gate does not guarantee the accuracy or completeness of the information and shall not be liable for any losses arising from the use of this information. Virtual asset investments carry high risks and are subject to significant price volatility. You may lose all of your invested principal. Please fully understand the relevant risks and make prudent decisions based on your own financial situation and risk tolerance. For details, please refer to
Disclaimer.
Related Articles
Bitcoin returns to $70,000: Geopolitical conflict concerns ease, ETF fund inflows continue to drive BTC rebound
On March 10th, Bitcoin broke through $70,000 during the East Asian trading session, completing a recovery after the weekend sell-off. As volatility in the energy markets eased, selling pressure on risk assets diminished. Market data shows that institutional capital inflows continue to support Bitcoin, investor sentiment is improving, and short-term upside potential is increasing.
GateNews2m ago
Yesterday, the US Bitcoin spot ETF experienced a net inflow of $57.73 million.
Gate News Report, March 10 — According to crypto analyst Trader T's monitoring, on March 9, the US Bitcoin spot ETF saw a net inflow of $57.73 million. Among them, FBTC (Fidelity) had a net inflow of $60.09 million; BITB (Bitwise) had a net outflow of $4.49 million; ARKB (Ark) had a net outflow of $274 million.
GateNews20m ago
Peter Brandt releases Bitcoin chart analysis showing a short-term bullish pattern
Gate News Announcement, March 10, renowned trader and chart analyst Peter Brandt released a Bitcoin chart analysis. Peter Brandt successfully predicted the 2018 Bitcoin crash. The chart shows the "Big Banana" chart displaying a large upward curved channel on the long-term weekly chart (2014-2027); the "Small Banana" chart shows a smaller similar curve currently forming near $69,000 on the daily chart. The arrows in the chart clearly point upward, indicating higher targets.
GateNews41m ago
BTC Price Fluctuation Analysis
# BTC Price Movement Deep Attribution Report for March 10, 2026, 02:30-02:45 (UTC)
## 1. Event Overview
Between 02:30 and 02:45 (UTC) on March 10, 2026, Bitcoin (BTC) experienced a significant price movement, with a return of +1.39%. The price fluctuations during this time window exceeded normal ranges, attracting market attention. This report will conduct a comprehensive attribution analysis based on on-chain data, market conditions, macroeconomic environment, trading behaviors, and other dimensions to uncover the true causes of the event and provide insights for investors.
GateNews48m ago