Ethena (ENA) has fallen to a record low of $0.235 on Monday, shortly after Bitcoin (BTC) temporarily slipped below the $84,000 threshold. Although Bitcoin quickly rebounded by 3% in just 12 hours, ENA has been sluggish with a modest increase of 1.28% during the same period.
This development may signal a relatively weak strength of ENA, reflecting a noticeable absence of buyers in the market. Investor sentiment is currently only at an average level, and the risk of short-term losses seems to be greater than the potential for a strong recovery.
Two time frames – Current position of Ethena
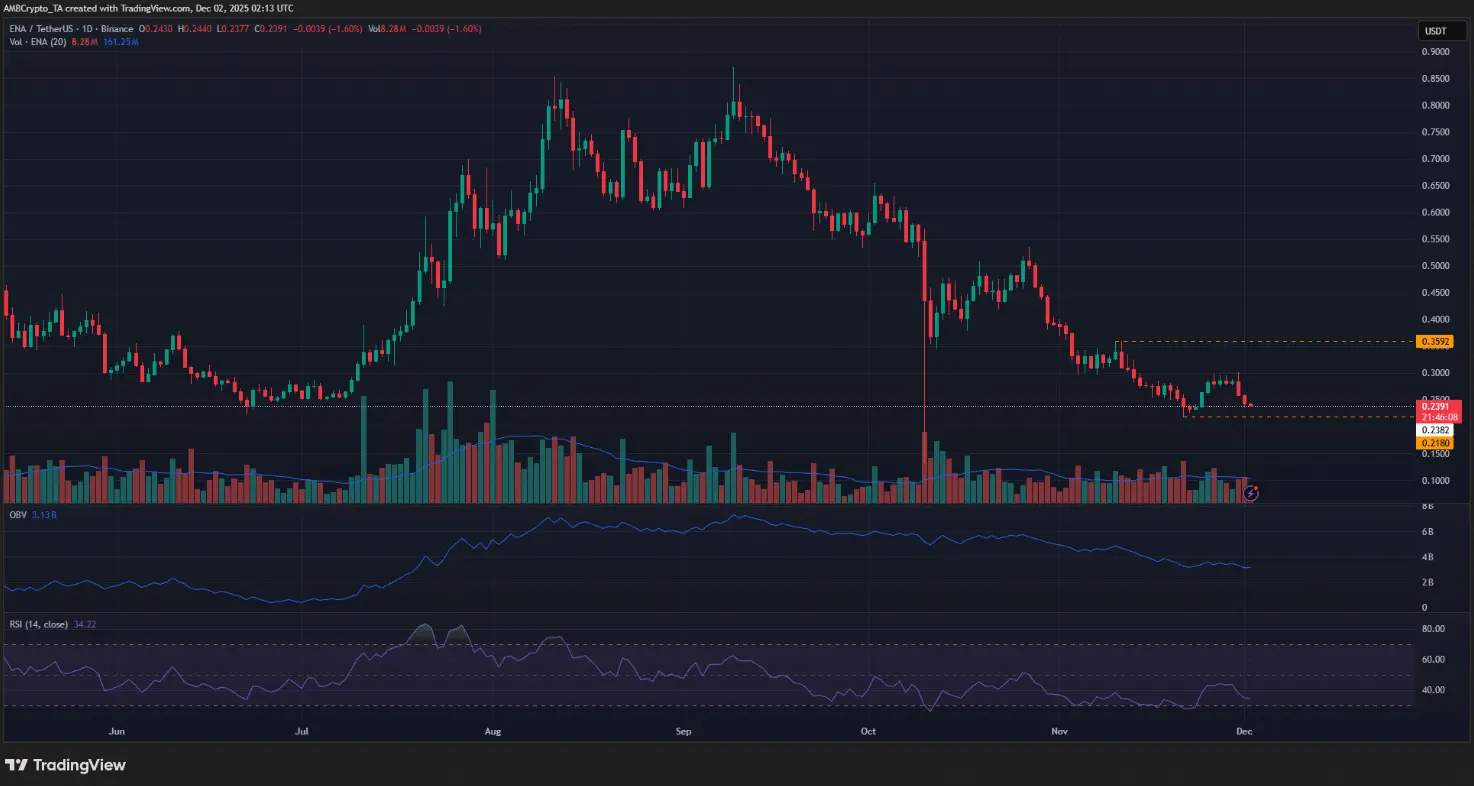 Daily chart ENA/USDT | Source: TradingViewENA has returned to the support level of $0.238, the price range that this coin had previously tested at the end of June. At that time, after about two weeks of accumulation around this level, ENA had a strong breakout, rising above $0.8 in August.
For a similar scenario to occur again, the market sentiment needs to shift towards a bullish trend, with investors accepting higher risks for cryptocurrencies, especially altcoins. However, at the time of writing, this seems unlikely. On the daily timeframe, the bearish structure of ENA still prevails and is likely to continue.
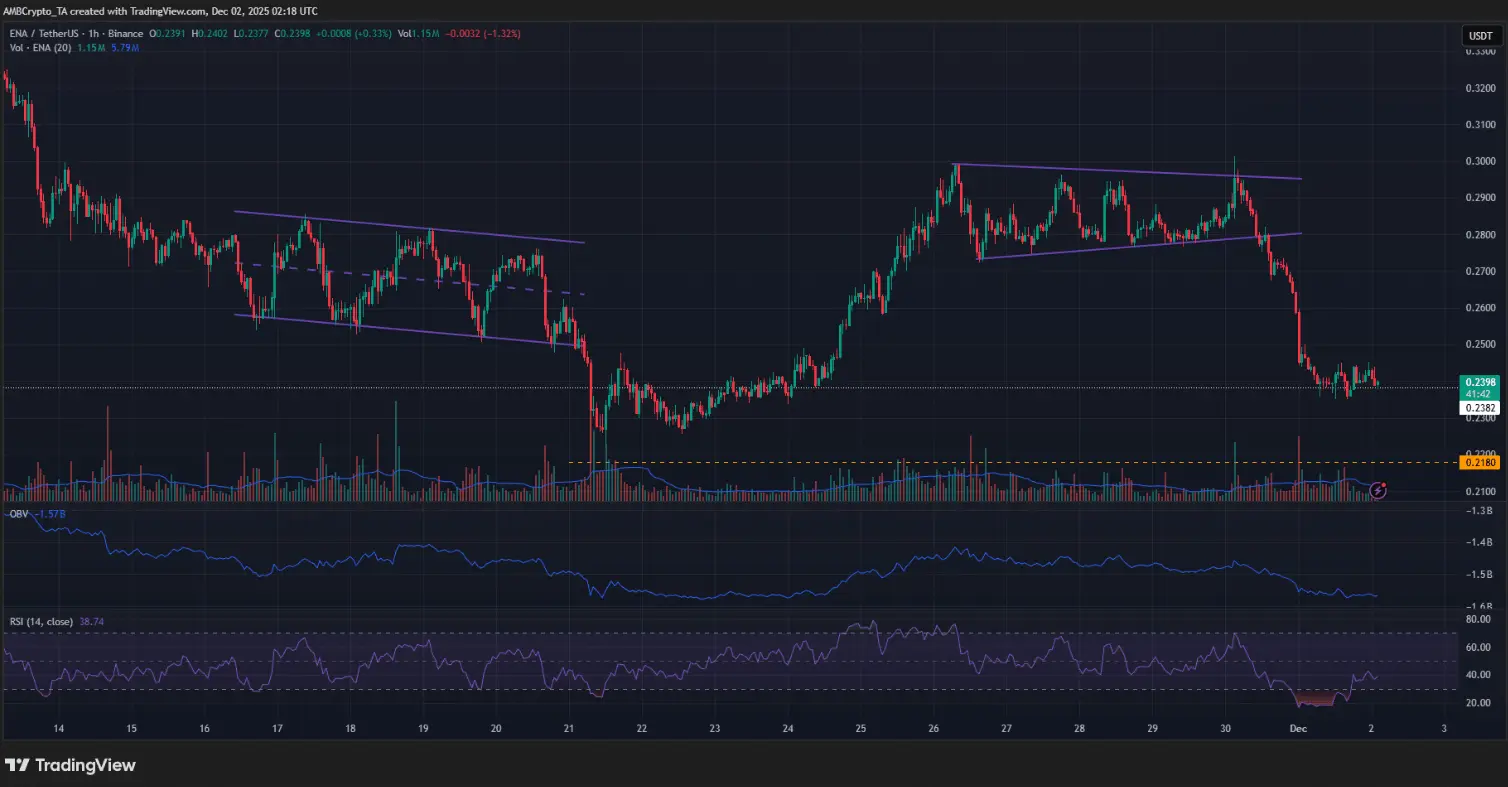 Hourly ENA/USDT Chart | Source: TradingViewThe hourly chart reveals some interesting developments over the past two weeks. Accumulation phases, marked in purple, include a price channel and a triangle, indicating order gathering behavior before major movements. ENA price moves in sync with Bitcoin and the overall market, often creating liquidity around key levels before “hunting” both Long and Short orders, paving the way for a real rally.
If this scenario repeats, ENA could experience a consolidation phase around $0.238 before the next breakout. However, based on the current structure, it is likely that the price will continue to fall in the short term.
Check Technical Strength
On both the daily and 1-hour time frames, OBV is maintaining a downward trend, signaling continuous selling pressure. Therefore, any price increase of ENA should only be seen as a selling opportunity. The RSI indicator also reflects a strong downward trend, which short-term rebounds are unlikely to break.
Support and resistance levels to watch
The key support levels currently lie at $0.238 and $0.218. If the $0.218 level is breached, the likelihood of further decline will be very high, targeting around $0.184–$0.192.
In the next few hours, the possibility of a bounce back to $0.25 is entirely feasible, thanks to the imbalance on the upside. If this recovery surpasses the threshold of $0.258, the next short-term target will aim for $0.295. At the same time, the level of $0.359 could become an important resistance zone, where selling pressure may increase.
SN_Nour
Disclaimer: The information on this page may come from third parties and does not represent the views or opinions of Gate. The content displayed on this page is for reference only and does not constitute any financial, investment, or legal advice. Gate does not guarantee the accuracy or completeness of the information and shall not be liable for any losses arising from the use of this information. Virtual asset investments carry high risks and are subject to significant price volatility. You may lose all of your invested principal. Please fully understand the relevant risks and make prudent decisions based on your own financial situation and risk tolerance. For details, please refer to
Disclaimer.
Related Articles
Will XRP Hold $1.33 or Extend Toward $1.30 Before Rebound?
XRP is currently trading at $1.35, experiencing a 1.3% decline. Key support is at $1.34, while resistance is at $1.40. The price is testing around the Fibonacci levels of $1.33 and $1.30, crucial for potential upward movement or deeper decline.
CryptoNewsLand3h ago
Dogecoin Monthly Breakdown Pattern Reappears as Price Tests $0.0918
Dogecoin is currently trading at $0.09205 at a gain of 2.3, with support of above $0.08878.
As can be seen in the monthly chart, there are recurring breakdown areas that have been followed by significant expansions in price.
The short-term trading range is narrow and the immediate point o
CryptoNewsLand4h ago
Solana Nears $95 Resistance With $17B Volume Surge
Solana approaches a key resistance level near $95, with increased trading volume and open interest signaling active trader interest. The token is currently at $90.20, facing potential upward movement if it surpasses $95, but may test $85 if rejected.
CryptoFrontNews4h ago
Bitcoin Slips to $68,000 as Middle East Conflict and US Jobs Data Trigger Sell-Off
Bitcoin surrendered its $70,000 support level, triggering a broader crypto market retreat that wiped out $329 million in leveraged positions. This downturn was fueled by a perfect storm of geopolitical and macroeconomic pressures.
Wiping out the ‘War Gains’
Bitcoin’s midweek resilience
Coinpedia4h ago
PEPE Hovers at Critical $0.053414 Support as $432M Volume Surge Tightens Breakout Watch
PEPE is trading at $0.053416, just above support at $0.053414, with significant trading volume up 22.14%. Resistance is at $0.053676. Despite a slight decrease in price, there’s increased market activity, suggesting potential volatility.
CryptoNewsLand4h ago
DXY Retest at 99.183: Will 100–101 Break as US Degen Index Stabilizes?
DXY trades at 99.183 while retesting the 100–101 monthly resistance zone.
US Degen Index 6900 sits at $0.0001197 with support at $0.0001175 and resistance at $0.0001214.
A break above 101 on DXY would shift structure higher, while rejection keeps price below key resistance.
The U.
CryptoNewsLand5h ago