Gold (XAU) heads into the new week with fresh energy after a decisive bounce off recent lows. By the end of Friday’s session, the metal had climbed back above $5,170, a move that came after buyers stepped in aggressively around the $5,050–$5,100 support zone.
That reaction has started to change the tone on the charts. What first looked like a routine pullback now resembles the early stages of a broader recovery, and several analysts are beginning to map out higher targets if the current structure continues to hold.
Market structure on shorter timeframes has started to turn upward, and the charts show gold stabilizing above levels that previously acted as strong demand zones.
Two popular market commentators, Uzaif FX and Shirley, both point to the same idea: if gold maintains support above the current demand zone, the next phase of the move could push prices higher in the coming sessions.
- Analysts Point to Strong Support Holding For Gold Price
- Analyst Sees Momentum Building For Gold Price
- Here’s What The Gold Chart Is Showing
- Key Gold Price Levels to Watch
Analysts Point to Strong Support Holding For Gold Price
In a recent post on X, trader Uzaif FX highlighted a bullish technical setup forming on the XAUUSD chart.
The analysis focuses on a Change of Character (ChoCh) signal combined with a reaction from a bullish order block, both commonly used concepts in institutional-style technical analysis. These signals often appear when selling pressure fades and buyers begin to regain control of the structure.
On the XAU chart, the $5,100–$5,125 area stands out as the zone buyers continue to defend. Each time price dips into that pocket, demand shows up quickly, which is why analysts treat it as the foundation of the current move.
As long as the gold price stays above that band, the structure favors another leg higher This view aligns with the idea that gold has shifted into a new short-term bullish structure after a period of consolidation.
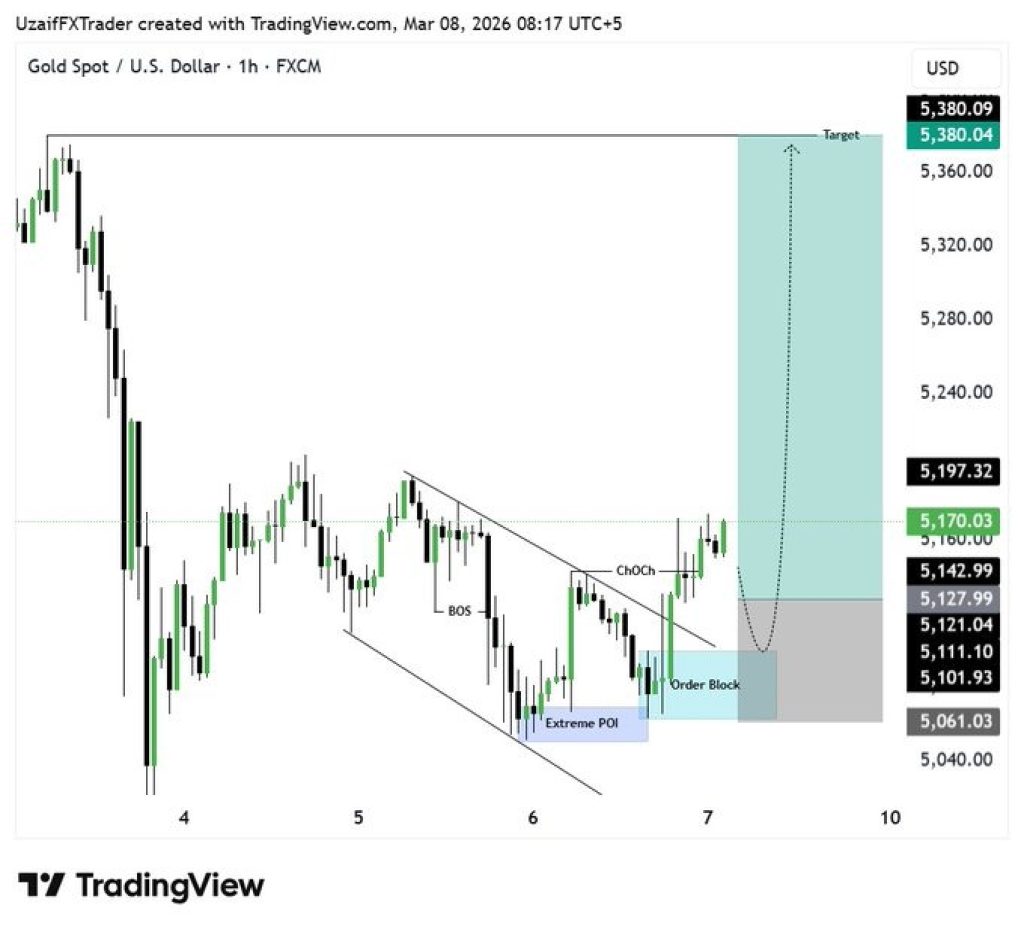
Source: X/Uzaif FX
Analyst Sees Momentum Building For Gold Price
Another analyst, Shirley, also believes that the gold market will see a strengthening trend after the recent price rebound.
According to Shirley’s analysis, the gold price has managed to hold up above the broader support band between $5,050, $5,080, and $5,100. This band has been a key reaction zone for the price in previous corrections.
Following the price’s high above $5,170, Shirley believes that the price will resume its recovery in the early weeks. The price targets for the near term will be between $5,200 and $5,240. These are the first resistance levels that the price will need to overcome.
Here’s What The Gold Chart Is Showing
The larger chart structure supports the bullish outlook.Price action has been trending within a rising channel pattern that started forming earlier this year.
Following a good run, the gold price corrected back towards the lower boundary of the channel before rising again. The recent correction also formed a higher low, sustaining the rising channel pattern.
Price action also projects a move towards the upper boundary of the channel at $5,594, which represents a long-term resistance level for the gold price if the uptrend momentum continues.
Presently, the gold price is trading at $5,170, which represents the middle of the channel.
_****Bitcoin May Be Closer to a Bottom Than Most Think, Chart Signals**
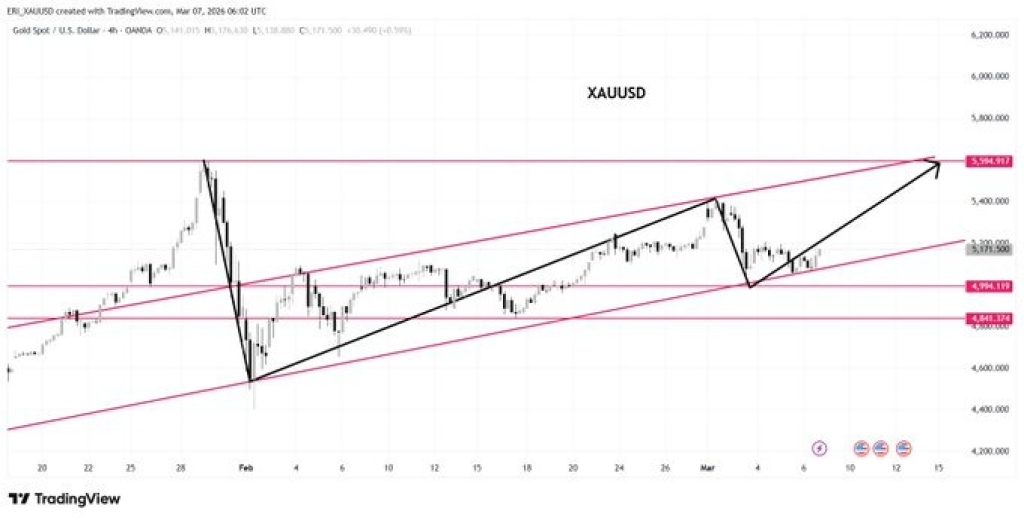
Source: X/Shirley
Key Gold Price Levels to Watch
Several price levels stand out as important for the coming sessions. On the upside, the first resistance cluster sits between $5,200 and $5,240, the area highlighted by Shirley.
A break above that range would likely bring $5,300 into focus, followed by the larger $5,380 target highlighted by Uzaif FX.
However, if this bullish momentum continues, then a channel projection suggests that the next major resistance area could be in the $5,550-$5,590 range.
In terms of downside risks, the $5,100-$5,125 area remains a key area of demand to maintain this current structure. If this area is broken, then a move back towards $5,050 could be seen, with further supports in place around $4,950, where the last major move up began.
For now, though, the charts are indicating that the gold price is holding above key supports and building a structure to potentially move back up and test the $5,380 level, which analysts are focusing on.
Disclaimer: The information on this page may come from third parties and does not represent the views or opinions of Gate. The content displayed on this page is for reference only and does not constitute any financial, investment, or legal advice. Gate does not guarantee the accuracy or completeness of the information and shall not be liable for any losses arising from the use of this information. Virtual asset investments carry high risks and are subject to significant price volatility. You may lose all of your invested principal. Please fully understand the relevant risks and make prudent decisions based on your own financial situation and risk tolerance. For details, please refer to
Disclaimer.