The crypto market opened the week sliding again, and the XRP price moved lower alongside the broader sell-off. Bitcoin spot ETFs recorded $348.83 million in net outflows on March 6, data from SoSoValue shows, adding more weight to the risk-off sentiment.
However, rising tensions in the Middle East pushed traders to reduce exposure across crypto assets. XRP moved almost in step with Bitcoin during the drop. Bitcoin fell about 1.22%, and the total crypto market cap slipped 1.19%, pulling XRP down as part of the broader market retreat.
For now, this chart centers around a tight range. $1.35 is the floor, and the first resistance area is between $1.36 and $1.37. If this $1.35 area continues to be a magnet for buyers, it’s possible XRP could rise back to $1.40. If it falls below this area, it’s likely to revisit the $1.30-$1.32 area where the demand pocket resides.
- Here’s What The XRP Chart Is Showing
- Here’s What The Indicators Are Saying
- XRP Price Targets for the Week
Here’s What The XRP Chart Is Showing
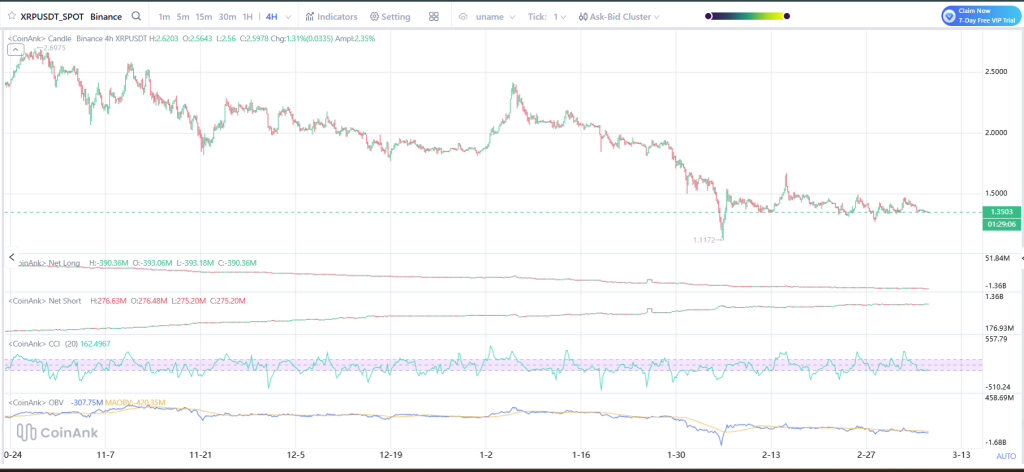
The 4H chart shows that the XRP price has spent the past several months moving inside a clear downward structure. The market printed a series of lower highs after the strong rally that peaked near the $2.60 region, followed by gradual distribution and steady declines.
Selling accelerated toward the end of January and early February, leading to a sharp drop that briefly pushed the XRP price down to around $1.11 before buyers stepped in. That move marked the lowest point of the current structure and created a strong reaction bounce.
Since that rebound, the price action has been contained in a tight consolidation range from $1.33 to $1.45. The market has made a few attempts to stage a small rebound, but the prices have failed to rise above the trend.
This type of sideways compression often appears after large liquidations, when the market pauses before deciding its next direction.
Source: Coinank
Here’s What The Indicators Are Saying
Market indicators on the chart paint a mixed picture. CCI is oscillating in the neutral zone. There are occasional peaks in the momentum spikes, but they tend to disappear immediately, indicating that neither buyers nor sellers are driving the trend.
On-Balance Volume is still trending lower, indicating that the level of accumulation is still low. There has not been a surge in trading activity that would normally accompany an increase in volume during an uptrend.
However, the level of net short positions has gradually increased in the derivatives segment. This indicates that the sentiment is geared towards downside risks in the near term. A large level of short positions can sometimes lay the ground for a squeeze if the price starts to move up.
_****Claude AI Predicts the Price of Bitcoin and Ethereum If the Middle East Conflict Escalates**
XRP Price Targets for the Week
For now, $1.35 remains the price level to which the market continues to return. It’s been a magnet where every dip into this range seems to attract buyers, thus making it a price level traders are keeping a close eye on this week.
Should this floor continue to be in place, the XRP price could easily rise to $1.40. After this, the next resistance levels are found in a range of $1.45 to $1.48, where the price seems to have stalled on multiple occasions in the past. If XRP breaks through this range cleanly, it could rise to $1.55.
In other words, if the $1.35 level is finally broken, the immediate focus would then be the $1.30 to $1.32 price level, where there has been buying interest during the previous price declines.
However, if this level is broken, then the $1.25 price level would be the next level of interest, with the February low at $1.11 being the ultimate level of interest for the cryptocurrency.
The XRP price is still stuck in a tight battle, where the price is being supported by the buying interest at the floor, but the trend is still bearish. However, the next major move will depend on the side that breaks first, based on the sentiment of the broader crypto markets.
Disclaimer: The information on this page may come from third parties and does not represent the views or opinions of Gate. The content displayed on this page is for reference only and does not constitute any financial, investment, or legal advice. Gate does not guarantee the accuracy or completeness of the information and shall not be liable for any losses arising from the use of this information. Virtual asset investments carry high risks and are subject to significant price volatility. You may lose all of your invested principal. Please fully understand the relevant risks and make prudent decisions based on your own financial situation and risk tolerance. For details, please refer to
Disclaimer.