
Daily Market Highlights and Trend Analysis, produced by PANews.
Macroeconomic Market
The US and Israel’s strikes against Iran enter day 19. Trump claims “Iran’s military capabilities have been completely destroyed” without NATO allies’ assistance, while Iran announces the launch of “Operation True Commitment-4” wave 61 to retaliate for the killing of Iran’s Supreme Security Council Secretary Larijani. Analysts believe Larijani’s death will have a far greater impact on Iran’s regime operations than Khamenei.
On Tuesday, US stocks continued their rebound, with the three major indices slightly higher. However, the sell-off triggered by the US-Iran conflict is far from over. Bank of America strategist Michael Hartnett warns that Middle East tensions and private credit concerns have shattered the “bubble-like bull market,” but the current sentiment indicator at 5.6 and the 8.5 bullish/bearish sell signals suggest the market has not yet reached historically extreme pessimism.
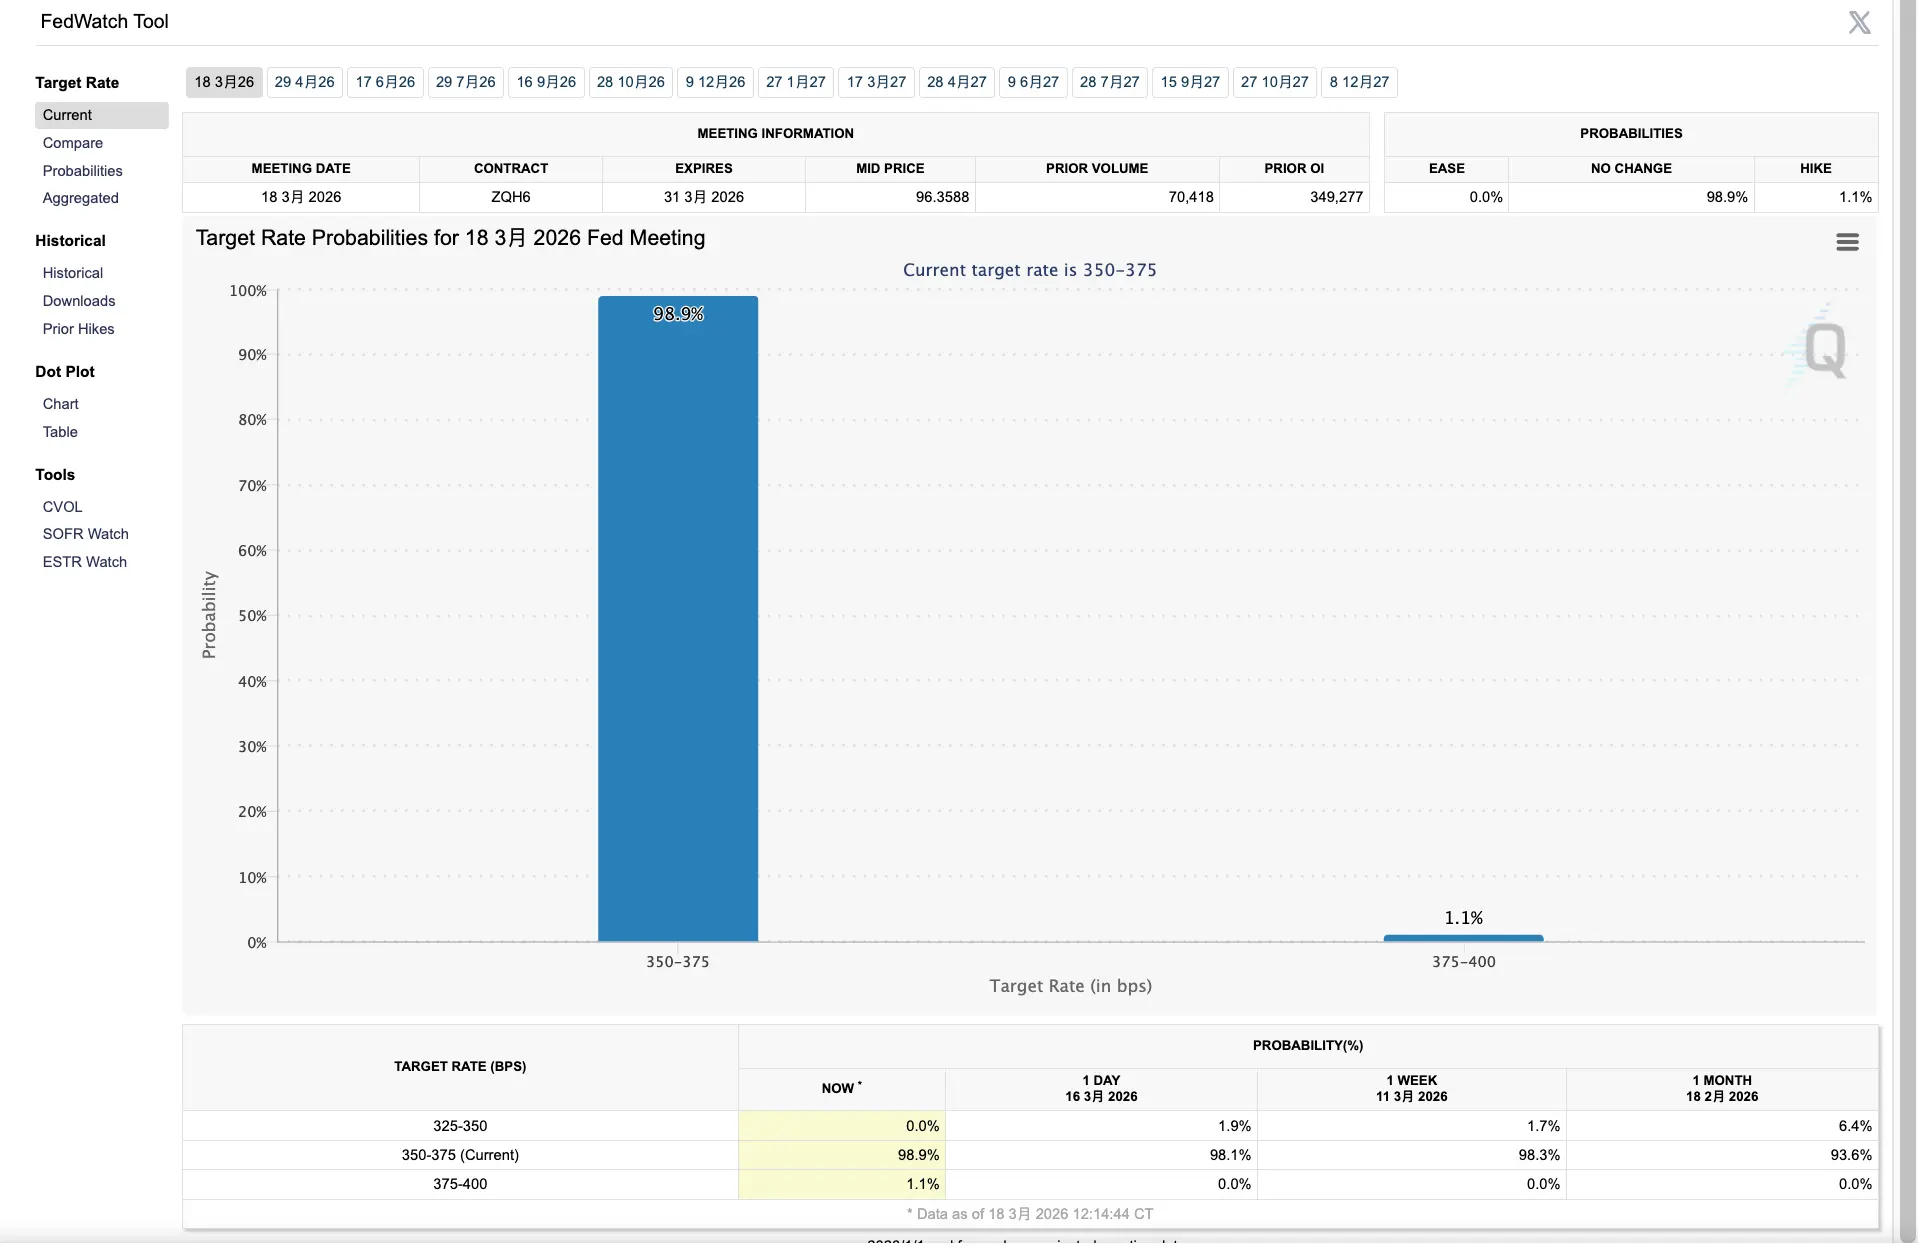
Ahead of the FOMC meeting early Thursday, CME data shows the market expects about a 99% probability of holding rates steady at 3.5%-3.75%, with a 97% chance of no change next month. KPMG Chief Economist Diane Swonk warns that the Fed’s “dual mandate” has become “mutually conflicting,” with increasing risks of entrenched inflation; JPMorgan’s David Kelly believes Powell will emphasize the high uncertainty from Middle East conflicts, but core economic forecasts are unlikely to change much. Former Fed Vice Chair Roger Ferguson states that the Fed has been deviating from its 2% inflation target for too long, and uncontrolled prices pose the greatest threat.
Additionally, US national debt has surged to a record $38.86 trillion, with interest payments consuming 17% of government revenue. Larry McDonald, founder of the “Safe Haven Trap Report,” bluntly states that high energy costs and weak employment are forcing the Fed into a “nightmare dilemma,” and gold’s struggle around the $5,000 level reflects the exhaustion of paper credit systems. RJO Futures analyst Daniel Pavilonis further warns that if the 10-year Treasury yield continues to rise, gold and silver could face deep corrections, with gold potentially falling to $4,200.
Bitcoin Market
Bitcoin is currently highly volatile between $74,000 and $76,000, with options market pricing indicating rising short-term volatility expectations. Although it briefly hit a six-week high of $76,000, heavy selling pressure above caused a retreat. This rebound is heavily driven by leverage in derivatives markets, with some veteran traders taking profits. On-chain data shows spot ETF inflows have turned positive, with over 26,636 BTC added in the past month, with an average cost basis approaching $79,900.
Market participants remain cautious ahead of Thursday’s FOMC meeting. While rate hold is widely expected, historically, 7 out of 8 FOMC meetings in 2025 have triggered declines in BTC, fueling bearish sentiment. Notably, although the short-term outlook is negative, BTC usually stabilizes within 48-72 hours after the meeting. Analysts generally believe that if Bitcoin buying momentum cannot sustain, BTC could retest support at $68,000 or even lower, with the $70,000–$71,000 zone seen as the last line of defense for bulls. As long as prices hold above this range, the rebound could continue, with most analysts expecting at least an $80,000 target.
Bearish Views
The core logic of this camp is that macro liquidity tightening expectations, lack of spot buying, and structural fragility in derivatives markets are turning the recent rebound into a dangerous “bull trap.”
- Mayne: The recent rebound will ultimately lead to lower lows; if prices fall back into the consolidation zone, reduce long exposure decisively.
- LP: Persistent sell pressure exists in the $74K–$75K range; if buying does not follow, prices could drop to $72K or even fill the CME gap at $71.3K.
- Ardi: $70K–$71K is the last line of defense for bulls; breaking below this would mean both the medium-term trendline and horizontal support are lost, ending the upward trend.
- Killa: Since May 2025, BTC has declined after every FOMC meeting (6 out of 6), and with only 112 days of bear market so far, blindly bottom-fishing violates cycle patterns.
- Ted: Liquidity above has been cleared out, and the next move will hunt for longs below $70,000, but before that, fake breakouts above $76,000 may be used to trap traders.
- Technical Crypto Analyst: Price faces resistance in the rising channel at $74K–$79K, which could trigger a deep correction toward support at $68K.
- Roman: No signs of a bear market bottom on higher timeframes; no bullish divergence or volume at lows.
- Jelle: The real bear market bottom is well below the 0.618 Fibonacci retracement; the market still needs a long, boring consolidation phase.
- CryptoQuant analyst: The market is shifting from spot-driven to overheated derivatives-driven, with veteran players distributing holdings; contract position divergence suggests this could be a bull trap.
Bullish Views
The core logic here is that technical breakouts of key resistance levels, continuous ETF inflows, and halving supply effects will fuel Bitcoin to challenge new all-time highs.
- Adam: As long as Powell signals “manageable inflation” dovishly, liquidity expectations will improve, directly boosting BTC toward $80,000.
- Mayne: As long as prices stabilize above the range high, the rebound can continue, with targets at $80K and even $86K–$90K.
- Altcoin Sherpa: If the price breaks through and holds above the range high, the next rally could target $85K–$95K, with $85K near the 200-day EMA.
- that1618guy: The model shows a 35.8% chance of reaching $80K in the next 14 days, versus a 21.7% chance of dropping to $67.5K, indicating positive skew.
- Crypto Tony: Bears failed to extend their attack during the decline; bulls still control the game, and breaking previous highs makes $80,000 within reach.
- IncomeSharks: If the pullback is shallow, reaching $80K before month-end is very possible; RJALPHA model shows a rare quadruple buy signal at $66K, targeting $92K.
- Man of Bitcoin: Weekly stochastic RSI crossing above 20 signals bullishness; breaking the downtrend line would retest the 50-week moving average; staying above $70,260 is key.
- Ali Charts: Bitcoin is breaking upward; if the daily close can hold above $73,344, it opens room toward $79,234 and $85,555.
Market Dynamics
The regulatory fog in crypto markets is rapidly clearing. The latest guidance from SEC and CFTC classifies digital assets into five categories. This not only liberates Bitcoin and Ethereum but also labels assets like SOL, XRP, DOGE as “digital commodities,” while clarifying compliance boundaries for NFTs, airdrops, and cross-chain assets.
Solana stands at a critical breakout point. On the weekly chart, SOL has again shown the “long lower shadow” bottom signal that previously predicted 1604% and 142% surges. Analysts WebTrend and Bluntz note that SOL has completed accumulation and broken out of an ascending triangle. As long as it holds support at $93.50, the next target could be $120 or even $145.
Key Data (as of 13:00 HKT March 18)
(Source: CoinAnk, Upbit, SoSoValue, CryptoBubbles)
-
Bitcoin ETF: +$199 million, 7 days of continuous net inflow
-
Ethereum ETF: +$138 million, 6 days of net inflow
-
XRP ETF: +$4.6369 million
-
SOL ETF: +$17.8107 million
-
Fear & Greed Index: 26 (Fear)
-
Upbit 24-hour trading volume top: XRP, BTC, POLYX, ETH, BTT
-
Market sectors: Overall crypto market retraced, only SocialFi sector remains relatively strong
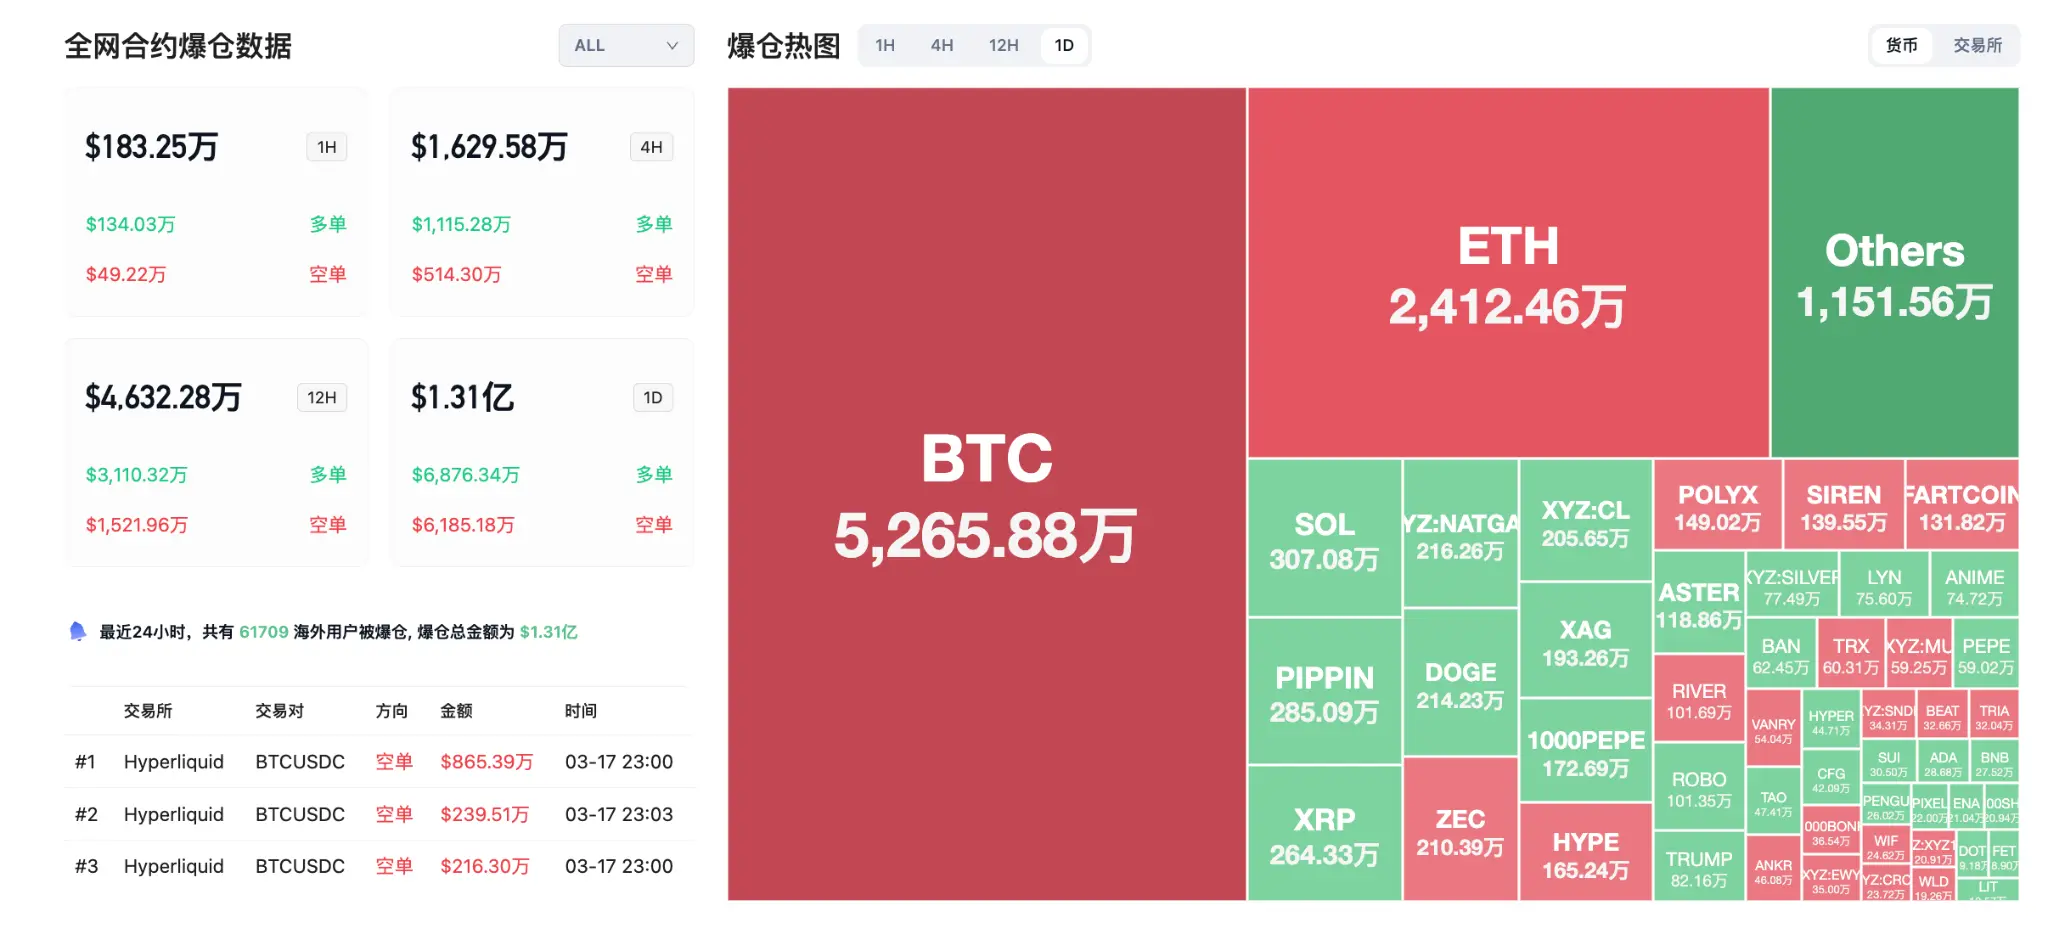
24-hour liquidation data: A total of 61,709 traders were liquidated globally, with total liquidation of $131 million, including $52.65 million in BTC, $24.12 million in ETH, and $3.07 million in SOL.
Today’s Preview
- Binance HODLer Airdrop Phase 62: Fabric Protocol (ROBO)
- Binance: Katana (KAT) token to launch on March 18 at 19:00
- Noble to migrate from Cosmos chain to independent EVM L1, mainnet scheduled for March 18
- Lombard (BARD) to unlock about 30 million tokens on March 18, worth approximately $32.3 million
- US Federal Reserve FOMC rate decision (lower bound): previous 3.5%, forecast 3.5% (March 19, 2:00)
- US Federal Reserve FOMC rate decision (upper bound): previous 3.75%, forecast 3.75% (March 19, 2:00)
- Fed Chair Powell to hold press conference on monetary policy (March 19, 2:30)
- Bank of Japan interest rate decision (March 19)
- Bank of England policy rate (March 19)
Top 100 cryptocurrencies by market cap today: Siren up 12%, MemeCore up 7.9%, Kaspa up 5.7%, LayerZero up 5.2%, Jupiter up 3.3%.

Hot News
- Analysis: Strategy last week primarily used preferred stocks as the main financing tool to increase Bitcoin holdings
- Suspected Cumberland wallet transferred 543.5 BTC from CEX 6 hours ago, worth about $40.58 million
- Five new addresses withdrew 29,598 ETH from Coinbase 8 hours ago, valued at $68.94 million
- Hyperliquid HIP-3 market open interest reached $1.43 billion in a single day, a new record high
- SEC and CFTC released new crypto guidelines clarifying that most digital assets are not securities
- Iran has designated multiple substitutes for key national positions after the death of the former security chief
- DAO governance platform Tally will shut down, citing relaxed regulation weakening decentralization needs
- Sharplink: Last week, staked 493 ETH, with total staking rewards reaching 15,464 ETH
Disclaimer: The information on this page may come from third parties and does not represent the views or opinions of Gate. The content displayed on this page is for reference only and does not constitute any financial, investment, or legal advice. Gate does not guarantee the accuracy or completeness of the information and shall not be liable for any losses arising from the use of this information. Virtual asset investments carry high risks and are subject to significant price volatility. You may lose all of your invested principal. Please fully understand the relevant risks and make prudent decisions based on your own financial situation and risk tolerance. For details, please refer to
Disclaimer.
