Litecoin (LTC) experienced a slight correction on Wednesday, returning to test the key support zone around $57 after breaking out of the accumulation phase. Although technical signals still lean toward an upward scenario, on-chain data and derivatives market indicators reflect cautious trader sentiment, suggesting that the rally has not yet gained strong consensus.
On-chain and derivatives data show mixed signals, indicating hesitation
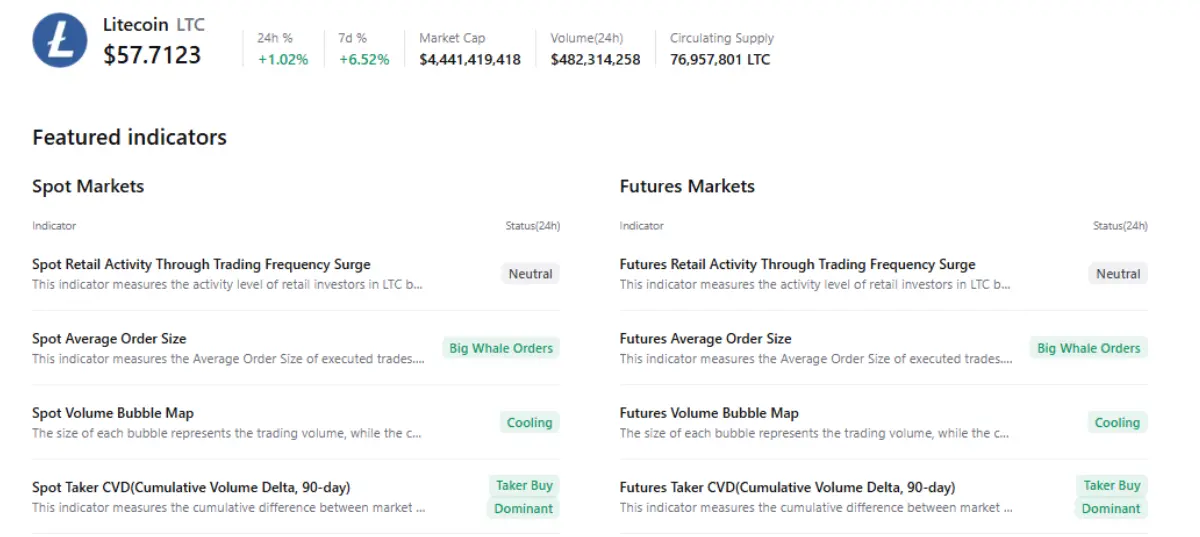
Data from CryptoQuant reinforce a positive outlook for Litecoin, as both spot and futures markets show large orders from whales. In a cooling market environment with increasing buying pressure, these are typically bullish signals.
However, data from Santiment reveal a noteworthy development: dormant wallets are becoming active again, potentially increasing selling pressure. The Age Consumed index signals less optimism when it shows sharp increases, indicating long-held tokens are being moved — a common short-term top/bottom indicator.
Historically, for Litecoin, each spike in Age Consumed has preceded price declines as investors transfer assets to exchanges to take profits. The recent surge on Saturday could therefore be a warning sign of an upcoming correction.
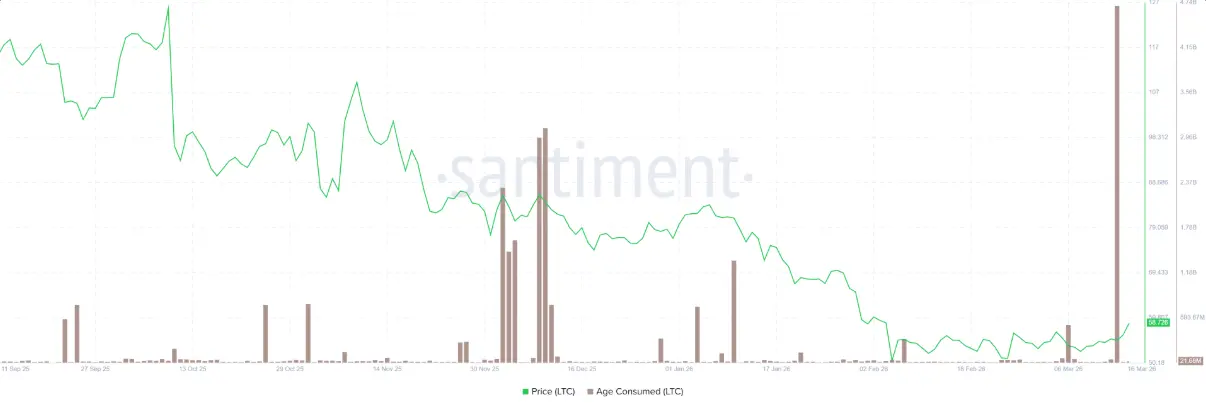 Litecoin Age Consumed chart | Source: Santiment
In the derivatives market, signals are also mixed. The LTC long/short ratio on CoinGlass stood at 0.89 on Wednesday — below 1 — indicating most traders are leaning toward a bearish outlook.
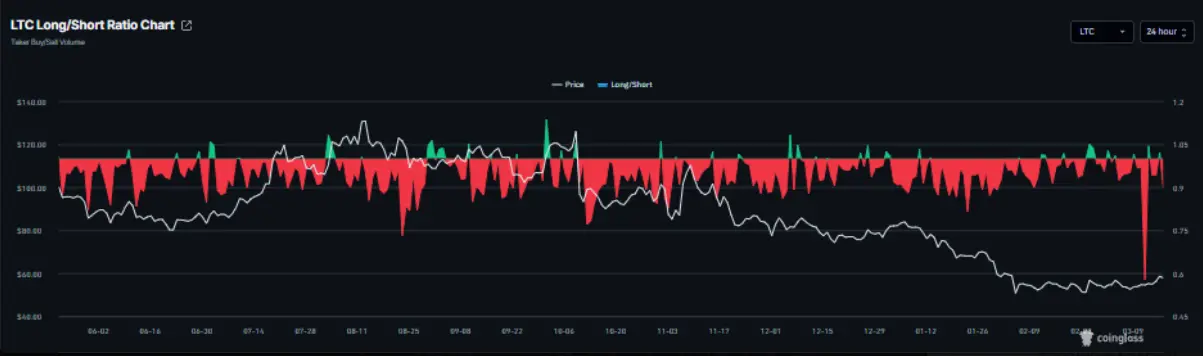 Litecoin long/short ratio chart | Source: Coinglass
Meanwhile, the funding rate shows a different perspective. Data from CoinGlass’s OI-Weighted Funding Rate indicates that traders expecting higher prices still outnumber those expecting declines, with the rate remaining positive since Sunday and reaching 0.0013% on Tuesday — meaning longs are paying shorts.
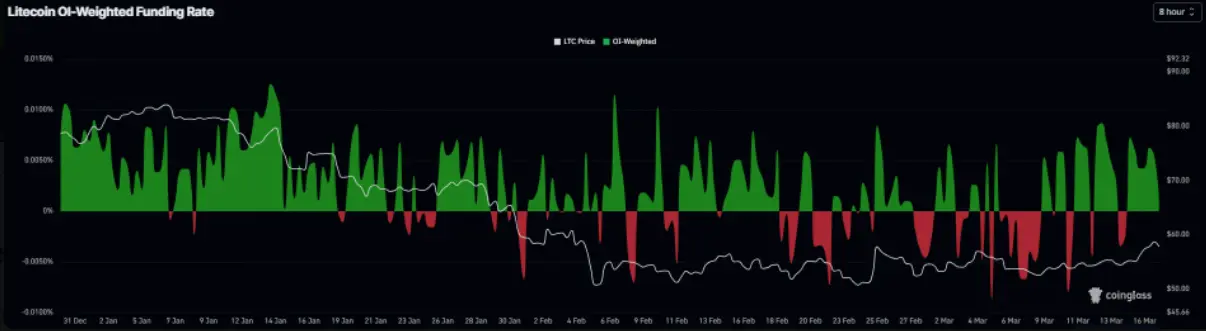 Litecoin funding rate chart | Source: Coinglass
Overall, these signals suggest market sentiment toward Litecoin is indecisive, making a strong and sustained upward trend less likely in the short term.
Litecoin price forecast: testing key support again
At press time, Litecoin trades around $57, with a slight short-term bullish bias. The price has recovered from the mid-$50s and is approaching the upper boundary of the short-term channel, currently near $57.10. Closing above the 50-day EMA at approximately $58.30 somewhat weakens the previous downward momentum, although the 100-day EMA at around $65.90 remains a significant resistance level.
Market momentum appears to be improving as the daily RSI reaches 57, crossing above the neutral threshold. Additionally, the MACD remains above its signal line and in positive territory, supporting a potential recovery scenario.
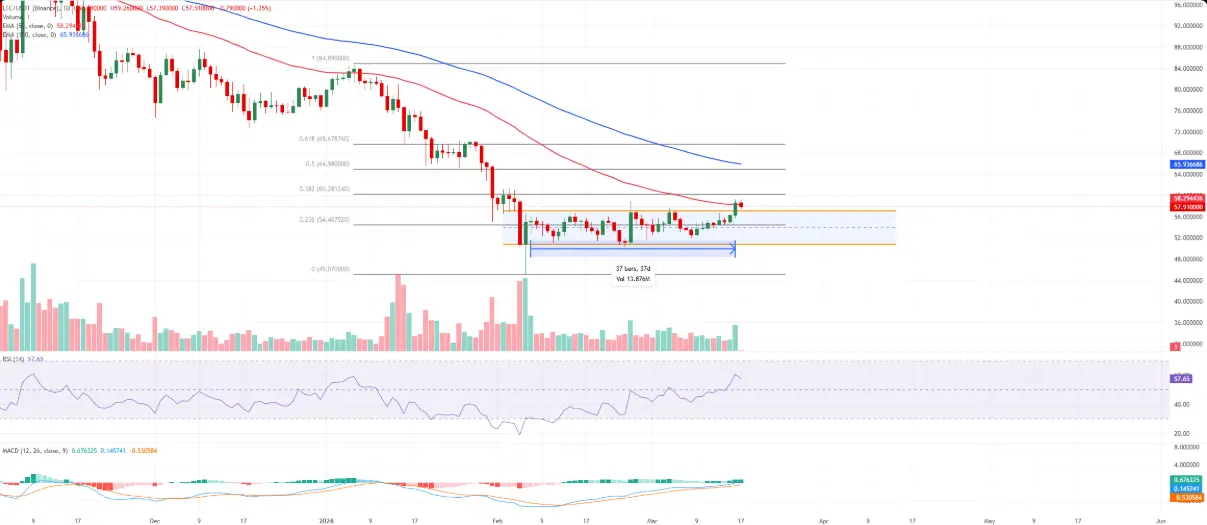 Daily LTC/USDT chart | Source: TradingView
Key levels include the nearest resistance at the 38.2% Fibonacci retracement at $60.28 (measured from the January 6 high of $84.89 to the February 6 low of $45.07). If the rally continues, the next target could be the 50% Fibonacci level at $64.98.
On the downside, support is near $57.10, followed by the 23.6% Fibonacci level at $54.47, and further down, the recent low around $53.00 — an area that previously saw significant buying.
A bullish scenario would be confirmed if the price closes above $60.28, opening room for a move toward $64.98. Conversely, losing the $54.47 level could weaken the short-term uptrend, increasing the risk of a retest of the sub-$50 zone.
SN_Nour
Disclaimer: The information on this page may come from third parties and does not represent the views or opinions of Gate. The content displayed on this page is for reference only and does not constitute any financial, investment, or legal advice. Gate does not guarantee the accuracy or completeness of the information and shall not be liable for any losses arising from the use of this information. Virtual asset investments carry high risks and are subject to significant price volatility. You may lose all of your invested principal. Please fully understand the relevant risks and make prudent decisions based on your own financial situation and risk tolerance. For details, please refer to
Disclaimer.
