Gate Research: Application and backtesting of momentum indicators in the crypto market
Summary
- Momentum investing is based on the assumption that price trends tend to persist over time and has been widely applied in both traditional financial markets and the cryptocurrency market. This report focuses on Bitcoin (BTC), systematically reviewing the theoretical foundations, behavioral drivers, and potential risks of momentum strategies, and establishing a framework for subsequent empirical analysis.
- Momentum can be understood as the “inertia” of price movements and is commonly quantified as the difference between the current price and a historical price. In the BTC market, short-term momentum measures (e.g., 10-day momentum) effectively capture short-term trend direction.
- The momentum effect is closely related to behavioral finance. Herding behavior, investor conformity, and underreaction can reinforce trend continuation, while sudden events and sentiment reversals may quickly invalidate momentum signals and lead to significant drawdowns.
- This report adopts MACD, Bollinger Bands, ADX/DMI, and RSI as core momentum indicators, which characterize price dynamics from complementary perspectives, including trend direction, volatility structure, trend strength, and market sentiment.
- Backtesting results indicate that the performance of momentum strategies is highly dependent on market structure. In range-bound or weak markets, MACD and RSI are prone to false signals; ADX/DMI exhibits relatively controlled risk but limited returns; Bollinger Band breakout strategies perform best during periods of volatility expansion, suggesting that volatility-driven momentum is more effective in the BTC market.
- To enhance the robustness of momentum strategies in the BTC market, combining multiple indicators can help mitigate the risk of single-indicator failure.
Introduction
Momentum investing is a type of quantitative strategy based on the persistence of price trends, and it has gained widespread attention in both traditional financial markets and crypto asset markets. This study aims to systematically explore the effectiveness of momentum strategies in the BTC market, analyzing their theoretical foundations, market behavior logic, and potential risks, and laying the theoretical groundwork for subsequent empirical research.
Momentum Concepts and Measurement Methods
2.1 Definition of Momentum
In financial markets, “momentum” refers to the tendency of an asset’s price to continue moving in the same direction (upward or downward) over a certain period. This concept is analogous to Newton’s laws of motion in physics: an object tends to maintain its direction and speed unless acted upon by an external force. Similarly, in financial markets, price movements tend to exhibit inertia and continue their existing trend, forming sustained upward or downward trajectories.
2.2 Quantitative Formula for Momentum
To analyze the persistence of price trends quantitatively, investors commonly use a simple yet effective momentum formula:
Momentum = Latest asset price − Asset price at a specified point in the past
The difference between the two values represents the momentum over that period.
- If momentum is positive, it indicates an upward trend.
- If momentum is negative, it suggests a downward trend.
For example, if a stock was priced at USD 100 one month ago and is now priced at USD 120, its momentum is:
120 − 100 = 20
This value shows that the stock experienced a sustained positive trend over the past month, indicating some degree of upward momentum. Investors often interpret this as a potential signal for continued short-term gains, though market sentiment and macroeconomic conditions must also be considered.
2.3 BTC-Based Momentum Indicators
In crypto asset research, BTC is frequently used as the benchmark asset for momentum indicator analysis. Similar to traditional stocks or indices, BTC momentum can be measured by price differences across various time windows, with short-term periods such as the 10-day momentum being the most common.
The calculation of the 10-day BTC momentum is:
BTC 10-Day Momentum = Today’s closing price − Closing price 10 days earlier
This indicator clearly reflects BTC’s price movement over the last 10 days.
For example, on November 24, BTC’s price was USD 87,288, and 10 days earlier it was USD 94,584.Thus, its 10-day momentum is:
87,288 − 94,584 = −7,296
This negative momentum shows that BTC declined over the past 10 days, indicating that selling pressure dominated. Conversely, a positive momentum value would suggest an upward trend driven by stronger buy-side activity.
2.4 Market Interpretation and Dynamic Influencing Factors
Momentum indicators not only reveal the persistence of price movements but can also be used together with historical events and economic cycle changes to explain the underlying drivers of market trends. For example:
- The accumulation of positive momentum often occurs during periods of optimistic investor sentiment, improving economic outlook, or rising corporate earnings.
- The continuation of negative momentum is commonly associated with heightened risk aversion, increasing macroeconomic pressures, or elevated systemic risk.
However, momentum is not a flawless indicator. Sudden economic shocks, policy changes, industry-specific disruptions, and other external factors may quickly reverse price trends and invalidate momentum signals. Therefore, in practical investment decision-making, momentum indicators should be combined with other technical indicators or fundamental analysis to improve accuracy and stability.
Introduction to Momentum Investing
The core idea of momentum strategies is that assets exhibiting clear upward or downward trends tend to continue moving in the same direction in the short to medium term. Investors attempt to capture excess returns by identifying trend signals, analyzing price momentum, and taking long or short positions accordingly. Unlike value investing, which emphasizes intrinsic value, or growth investing, which focuses on future potential, momentum strategies treat price behavior itself as the primary source of information.
In traditional stock markets, momentum strategies typically evaluate an asset’s past performance over a certain period to determine future positioning. In the cryptocurrency market—where price volatility is high and market sentiment shifts rapidly—momentum characteristics tend to be more pronounced, making it a particularly worthwhile subject of study.
The theoretical foundation of momentum investing is partly rooted in behavioral finance. Market participants frequently exhibit irrational behaviors such as herd effects, conformity, overreaction, or underreaction. These behaviors can cause asset prices to move in the same direction for an extended period. Once a trend is formed, investors’ follow-the-crowd behavior may further reinforce it, generating a momentum effect.
However, momentum strategies also carry significant risks. Trends may reverse suddenly due to changes in market conditions, shifts in sentiment, or unexpected events, resulting in high volatility and potential drawdowns. Additionally, the strategy requires timely trend identification and frequent portfolio adjustments, meaning investors must maintain continuous attention to market dynamics.
Overall, momentum investing differs from value investing, which seeks undervalued assets, and from growth investing, which focuses on future development potential. Instead, it emphasizes the persistence of price trends and the behavioral mechanisms underlying them. In the highly volatile BTC market, the existence and stability of momentum effects are especially worthy of in-depth examination. This research report will explore the performance and feasibility of momentum strategies in the BTC market through theoretical analysis and empirical study.
Common Momentum Indicators
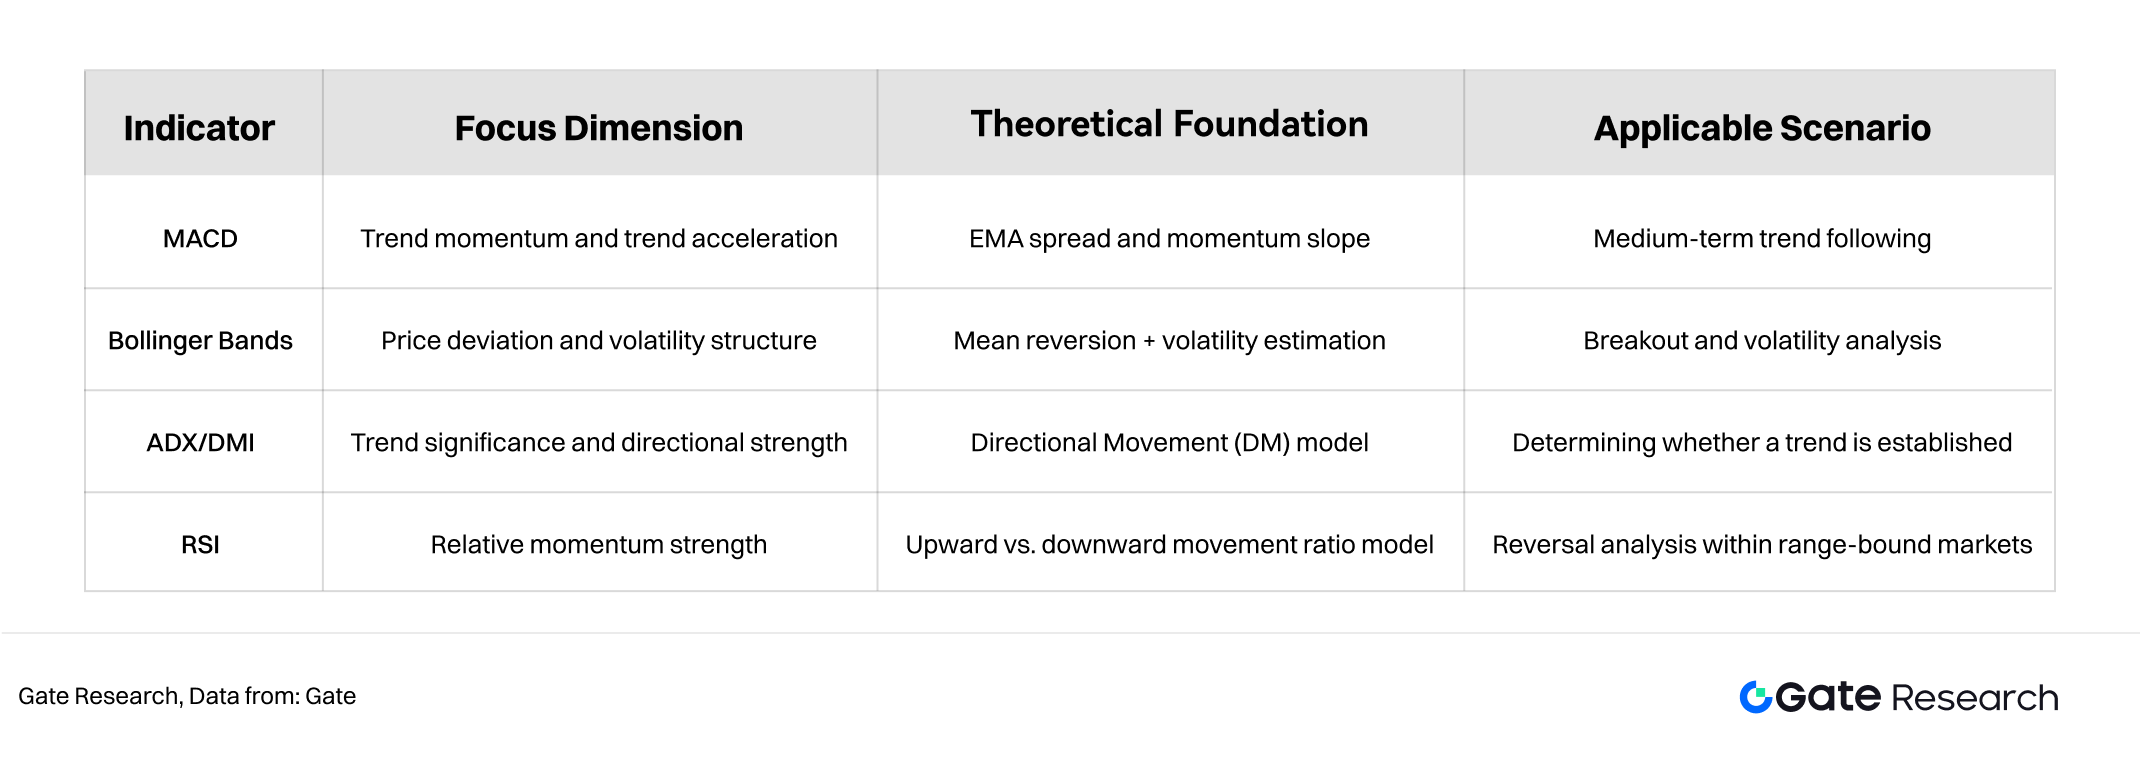
This chapter aims to systematically explain the most representative technical indicators used in momentum research, including the Moving Average Convergence Divergence (MACD), Bollinger Bands, the Average Directional Index and Directional Movement System (ADX/DMI), and the Relative Strength Index (RSI). These indicators describe market trend direction, volatility structure, momentum strength, and potential reversal signals from different perspectives, forming an essential foundation for constructing quantitative momentum strategies.
4.1 Moving Average Convergence Divergence (MACD)
4.1.1 Theoretical Foundation
The MACD, proposed by Appel (1979), is based on the idea of measuring the speed and direction of trend development by examining the difference between exponential moving averages (EMAs) of different periods. The short-period EMA is more sensitive to new information and can quickly capture changes in market momentum, while the long-period EMA reflects the overall trend direction.
MACD captures momentum by tracking the rate of change in the difference between EMAs, making it essentially a second-order momentum indicator (i.e., measuring the change in the trend’s rate of change).
Its advantages include:
- Simultaneous capture of trend direction (DIF) and trend strength (histogram)
- Lower sensitivity to noise, making it suitable for mid-term trend assessment
4.1.2 Indicator Interpretation
Using Gate’s default parameters as an example, the MACD consists of three key components:
- MACD Line — the difference between the 12-day and 26-day EMAs, reacting relatively quickly.
- Signal Line — the 9-day EMA of the MACD line, which smooths fluctuations and provides crossover signals.
- Histogram — the difference between the MACD line and the signal line, visually representing the expansion or contraction of momentum.
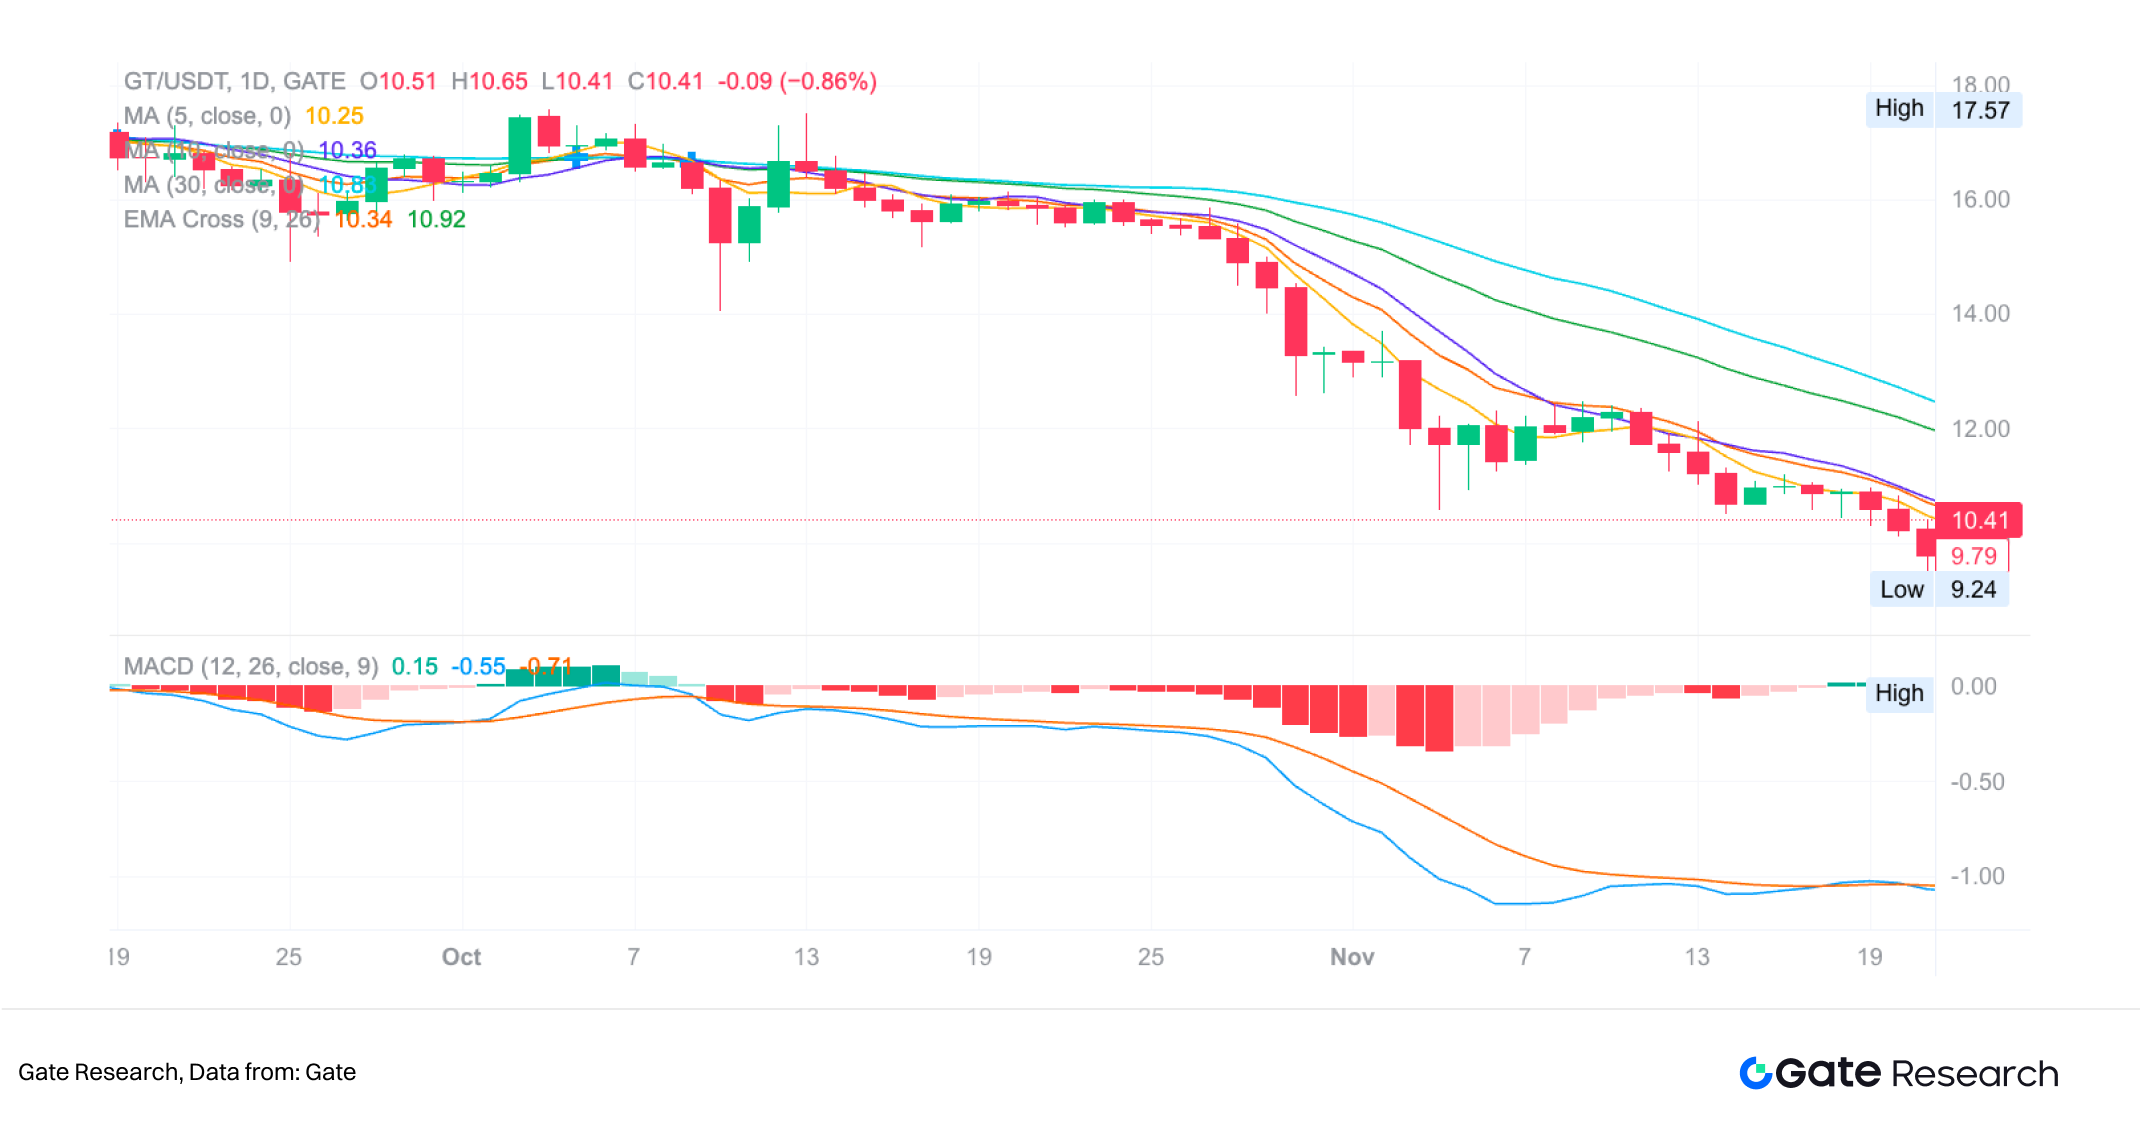
From the chart, one can observe clear phase shifts in MACD corresponding to the underlying price structure. After the price rose to approximately USD 126,193 in mid-October and then declined rapidly, the MACD line crossed below the signal line, and the histogram turned from positive to negative—indicating the fading of bullish momentum. As the broader market weakened, the MACD remained below the zero line, suggesting a bearish trend dominating the market.
When the price dropped to around USD 80,646 in late November and rebounded, the negative momentum in MACD began to shrink, implying a weakening of selling pressure. However, the MACD still remained below the zero line, indicating that a complete trend reversal had not occurred. This structure alerts traders that additional confirmation is required for a true reversal, as temporary momentum convergence is insufficient as a standalone signal.
The MACD zero line is critical for trend identification.
- When the MACD line is above the zero line, the short-term EMA exceeds the long-term EMA, indicating a bullish market structure.
- When the MACD line is below the zero line, bearish momentum dominates.
In the chart, MACD stayed below the zero line for an extended period from November onward, corresponding to a continuous downward trend.
4.1.3 Practical Techniques for Using MACD
The MACD zero line plays a crucial role in trend identification. When the MACD line is above the zero line, the short-term EMA is higher than the long-term EMA, indicating a bullish market structure; when it is below the zero line, bearish momentum dominates. In the chart, the MACD remained below the zero line for an extended period since November, corresponding to a continuous decline—typical of a bearish trend environment.
Investors often combine MACD with other indicators to enhance signal reliability. For example:
- RSI can determine overbought or oversold conditions; when RSI and MACD point in the same direction, they reinforce judgments about trend continuation or reversal.
- Trading volume that expands during MACD crossovers can further confirm the validity of price movements.
- Moving average systems can filter short-term noise, making trend assessments clearer.
Divergence is an especially important structural signal within MACD.
- When price reaches a new low but MACD fails to make a corresponding new low, a bullish divergence forms, indicating weakening downward momentum and a possible rebound or reversal.
- Conversely, when price hits a new high but the MACD peak moves lower, a bearish divergence appears, signaling fading bullish momentum and increased risk.
4.2 Bollinger Bands
4.2.1 Theoretical Foundation
Bollinger Bands, developed by John Bollinger in the 1980s, measure market volatility using price standard deviation and construct a dynamic price range. Unlike traditional channels with fixed width, Bollinger Bands expand or contract in real time with market volatility, making them better suited to reflect evolving market conditions.
Bollinger Bands typically consist of three lines:
- Middle Band (MID): Usually the 20-day simple moving average (SMA)
- Upper Band (UP): Middle Band + 2 standard deviations
- Lower Band (DN): Middle Band – 2 standard deviations
The theoretical foundation lies in the statistical characteristics of price distribution: under a normal distribution assumption, prices stay within ±2 standard deviations roughly 95% of the time. As a result, Bollinger Bands provide both trend direction (via the middle band) and volatility intensity (via the band width).
The advantage of Bollinger Bands is their ability to reflect both trend and volatility simultaneously. When market volatility increases, the distance between the upper and lower bands widens, indicating entry into a high-volatility regime. When the bands narrow, volatility declines, suggesting that the market may be preparing for a new trend. The middle band itself also serves as a trend reference, allowing Bollinger Bands to provide effective analytical support in both trending and ranging market conditions.
4.2.2 Indicator Interpretation
Using Gate’s default settings (20, 2) and referring to the daily chart, one can observe how Bollinger Bands reflect market structure during different phases. When the price surged rapidly to around USD 126,193 in early October, the upper band expanded sharply and the bandwidth widened, indicating that the uptrend was accompanied by increasing volatility and strong momentum. Price candles frequently moved along the upper band, forming a textbook trend-extension structure.
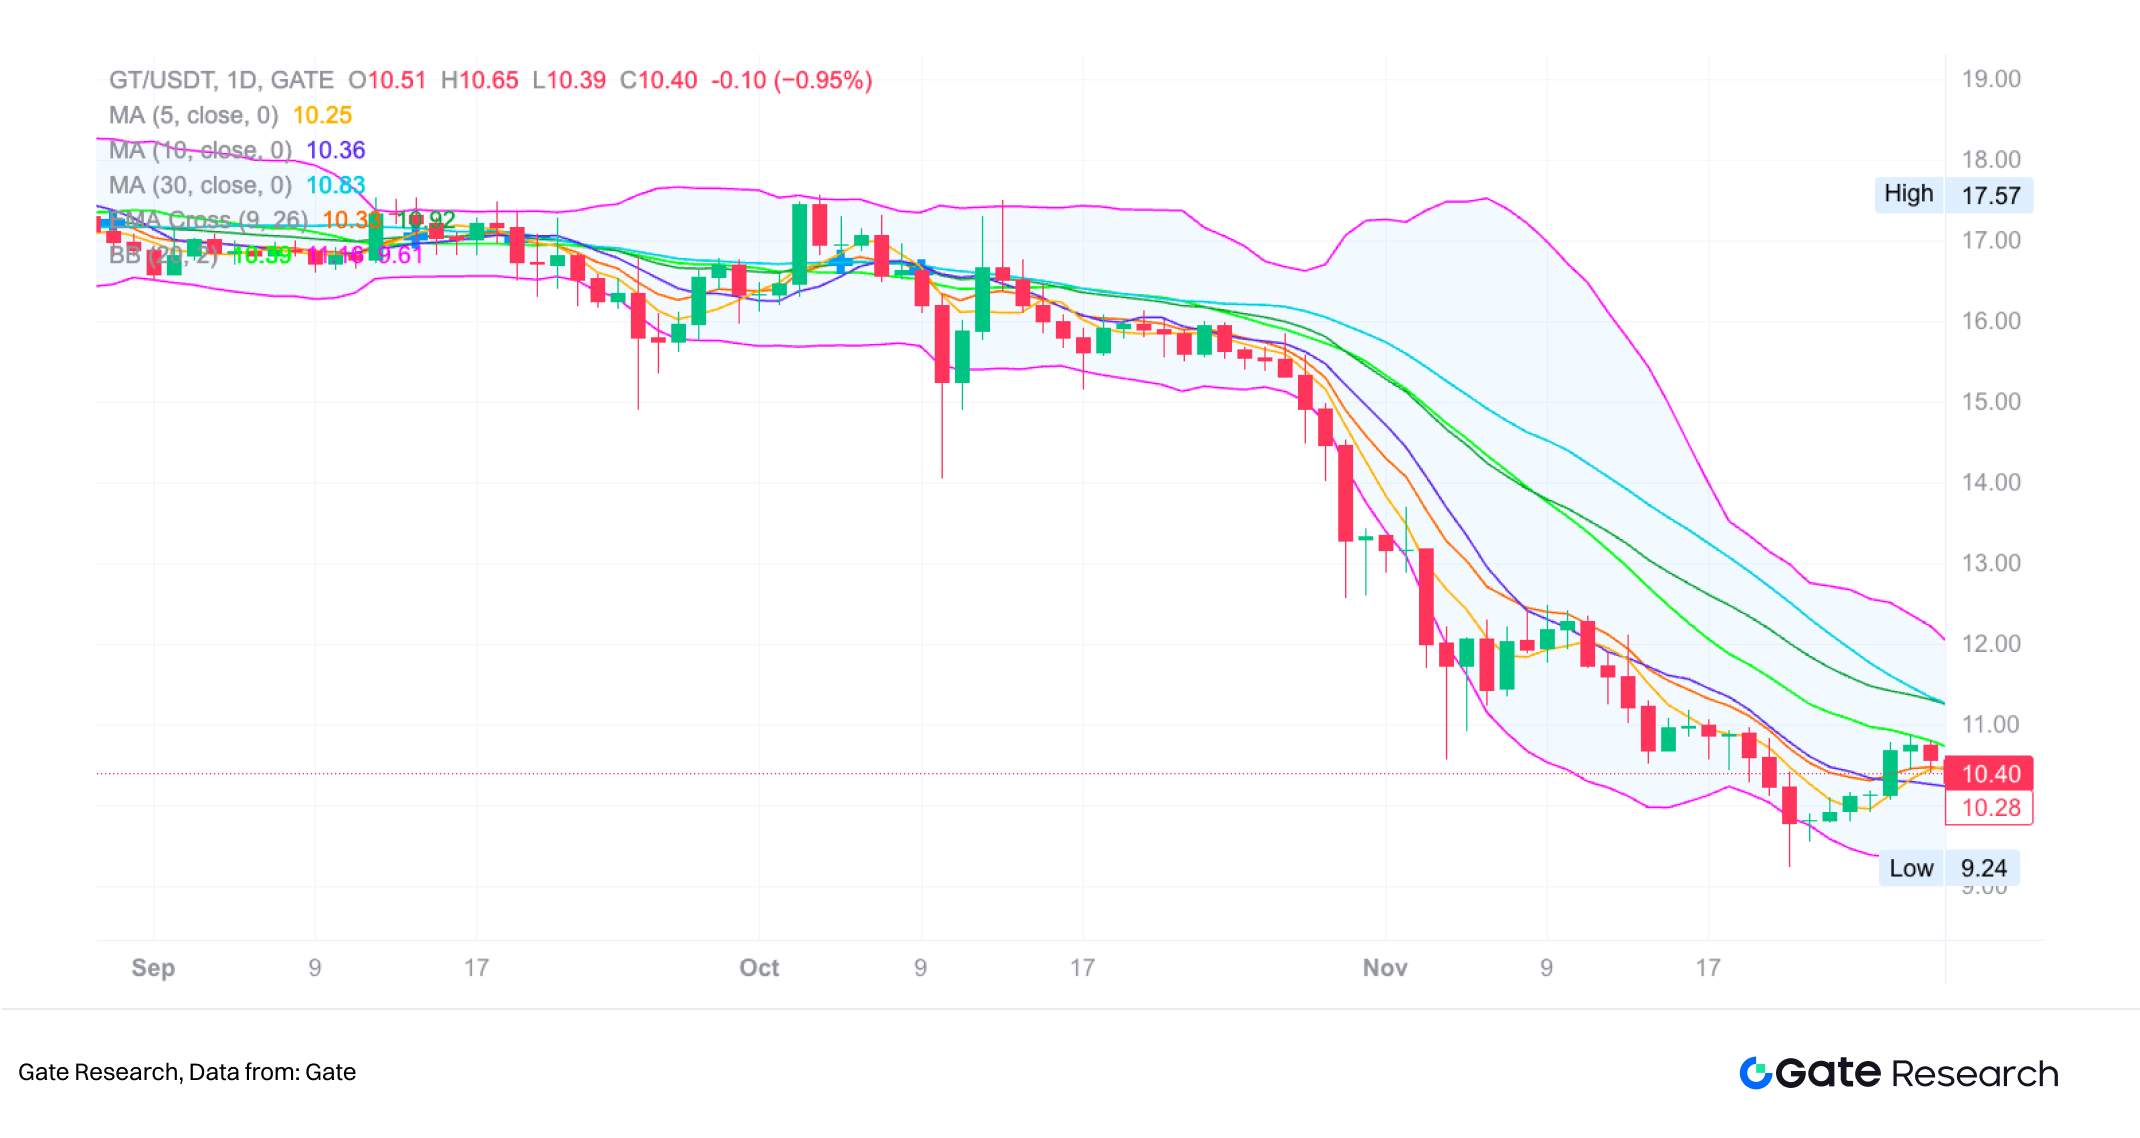
As the price retreated from its high, the Bollinger Bands gradually narrowed, reflecting reduced market volatility and the transition into a brief consolidation phase. During the subsequent decline, the bands began to slope downward as a whole, with the price moving along the lower band—indicating that bearish momentum had fully taken control. After the price fell to around USD 80,646 in mid-November and rebounded, the bandwidth started to contract and the candles were no longer hugging the lower band, suggesting that downward momentum was weakening. However, the price remained below the middle band, implying that a true trend reversal had not yet occurred.
Overall, the Bollinger Bands clearly depicted the structural evolution of the price movement: from an expansion phase during the uptrend, into a consolidation period, and then transitioning into a pronounced downtrend, with signs of volatility contraction and stabilization near the bottom. Bollinger Bands offer a structured perspective on these phase transitions, helping traders assess momentum and trend strength.
4.2.3 Practical Techniques
The application of Bollinger Bands is not limited to trend observation; they are also widely used for volatility analysis and price-position assessment. The middle band is often treated as an important trend boundary. When price consistently stays above the middle band, the market is considered relatively strong; when price breaks below and remains under it, the trend is viewed as weakening. In the chart, once price fell below the middle band in mid-October and failed to reclaim it, this became a key signal confirming the formation of a downtrend.
Changes in bandwidth effectively capture volatility cycles. When the bands widen, the market enters a high-volatility environment where trends often accelerate. When the bands narrow, volatility declines, potentially signaling the brewing of a new trend. In the chart, the notable narrowing from September to early October was followed by a rapid price rally—an archetypal “contraction → breakout” pattern.
The upper and lower bands also serve as dynamic resistance and support references. Price touching the upper band does not necessarily indicate overbought conditions; it may instead signal strong trend continuation. Similarly, price riding the lower band often reflects a well-established bearish trend rather than simple oversold conditions. The repeated lower-band touches during the downtrend in the chart exemplify strong bearish momentum.
To increase reliability, Bollinger Bands are often used in combination with other indicators. For example, MACD can confirm whether the trend direction aligns; RSI can identify extreme overbought or oversold conditions; moving-average systems can more comprehensively describe trend structure. Through cross-validation with multiple indicators, interpretations derived from Bollinger Bands become more robust.
4.3 Average Directional Index and Directional Movement System (ADX/DMI)
4.3.1 Theoretical Foundation
The Average Directional Index (ADX) and Directional Movement System (DMI), developed by J. Welles Wilder Jr., belong to the family of trend-following indicators. Their core principle is to measure the strength of a trend rather than its direction. The DMI consists of the Positive Directional Indicator (DMI+) and the Negative Directional Indicator (DMI-), which evaluate the strength of upward and downward price movements respectively. ADX is computed by smoothing the difference between DMI+ and DMI-, reflecting the overall trend intensity.
Theoretically, DMI+ represents the extent to which the current high exceeds the previous high, while DMI- represents the extent to which the previous low exceeds the current low. Both are calculated as positive values and measure the relative strength of bullish versus bearish momentum. When DMI+ is above DMI-, upward strength dominates; when DMI- exceeds DMI+, bearish momentum is stronger.
ADX does not indicate whether the market is rising or falling; it strictly measures trend strength. High ADX values indicate a strong trend, whereas low ADX values imply a weak trend or a ranging market. Thus, the ADX/DMI system simultaneously provides information on trend direction shifts (from DMI) and trend strength (from ADX), forming a comprehensive framework for trend assessment.
4.3.2 Indicator Interpretation
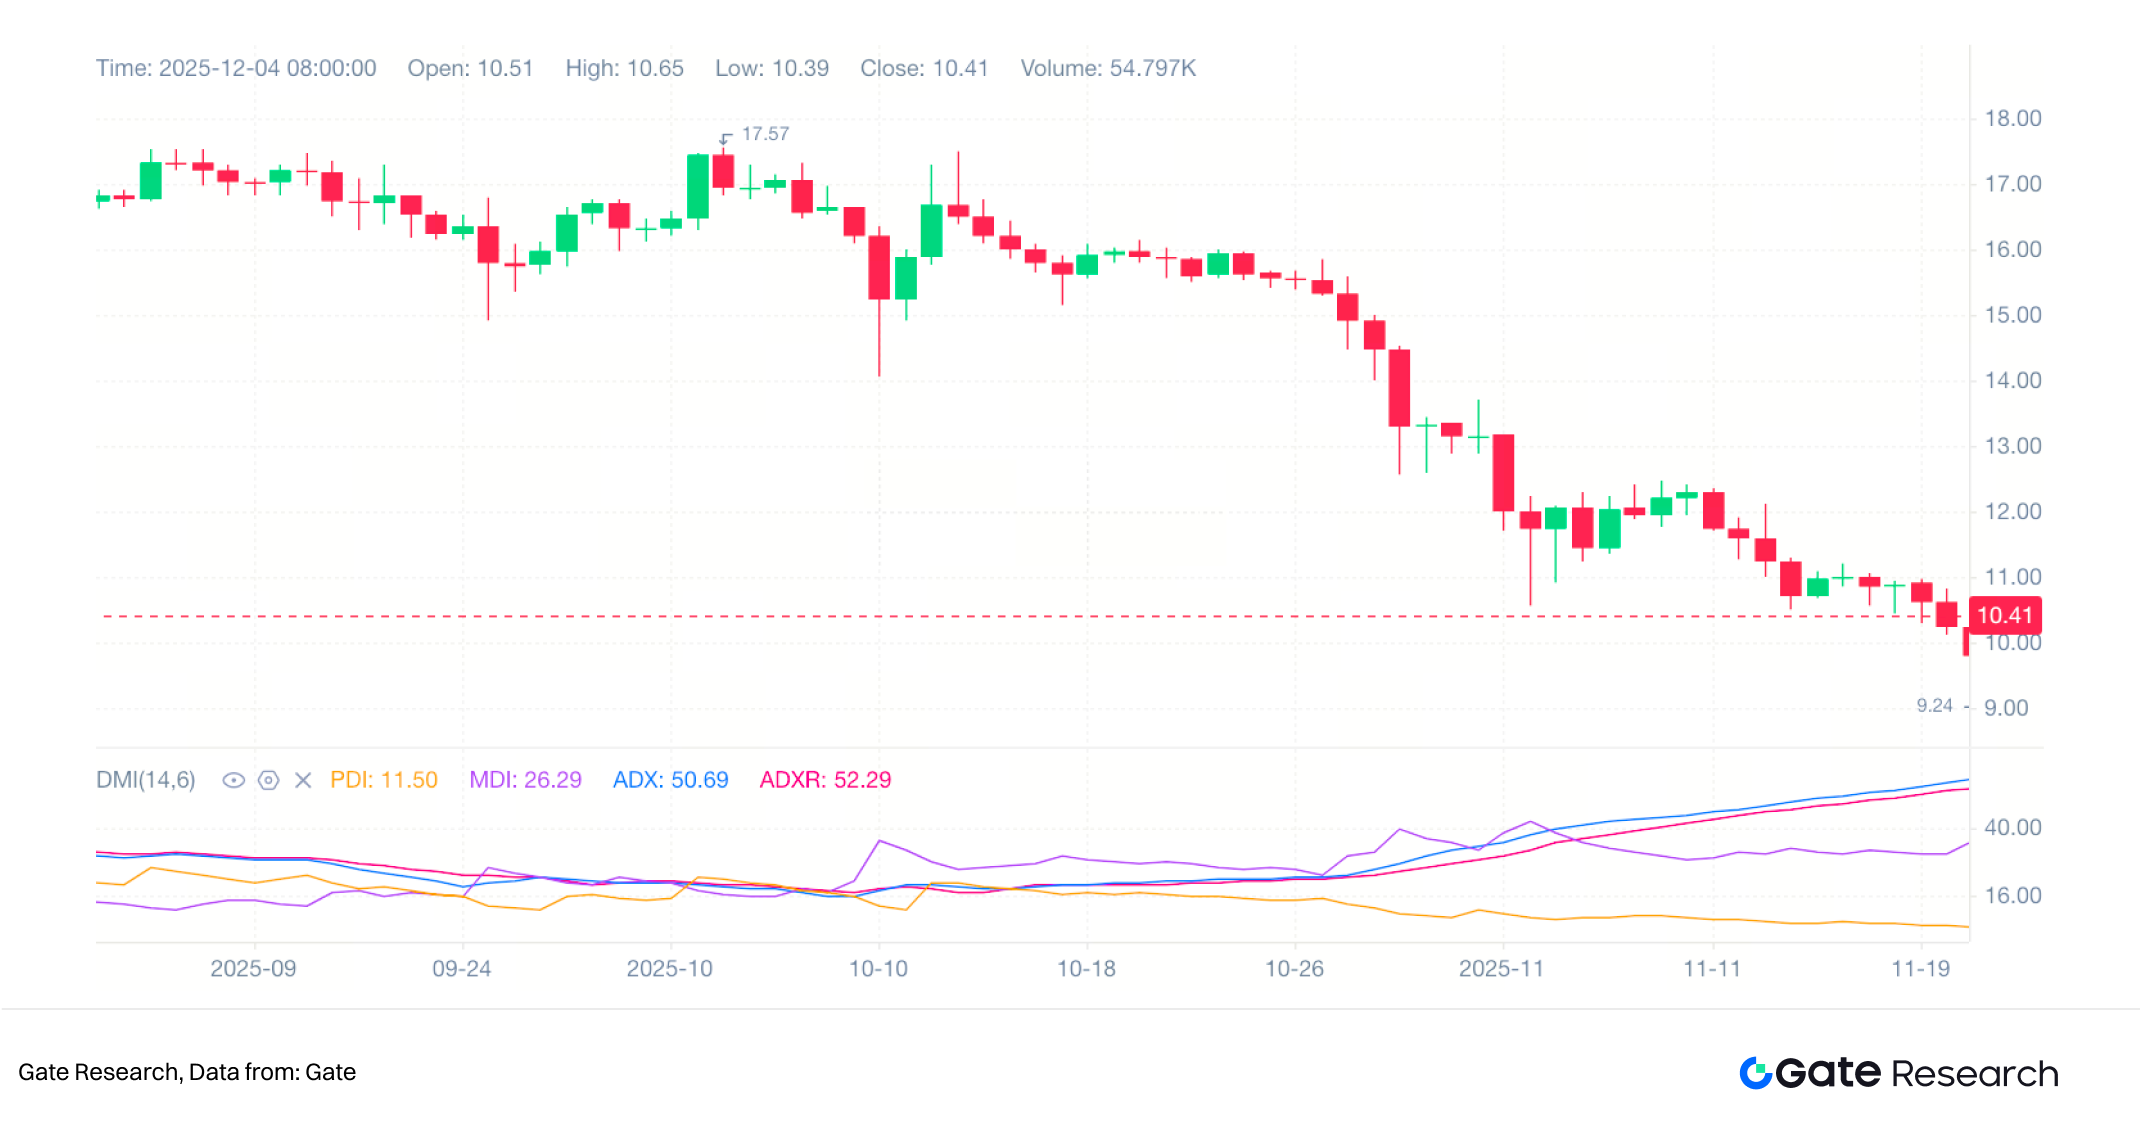
Using Gate’s default parameters (DMI14, ADX14) and referencing the daily chart, when price surged to the mid-October high of USD 126,193, DMI+ rose significantly relative to DMI-, reflecting strengthening bullish momentum. However, ADX did not immediately rise, indicating that the establishment of a trend requires time to accumulate. As price retreated from the high, DMI- surpassed DMI+, continuing to climb in the early stages of the decline, signaling the growing dominance of bearish momentum.
From the chart, one can observe that as the market transitioned into a clearer downtrend starting late October, ADX gradually rose from low levels, stabilizing above 25—indicating strengthening trend intensity. During this period, DMI- remained above DMI+ for an extended time, consistent with the price sliding downward along a descending channel. The further the trend progressed, the more ADX reflected the stability of the bearish trend.
In mid-November, price rebounded from around USD 80,646. Although DMI- remained above DMI+, the gap between them narrowed, indicating weakening bearish momentum. Meanwhile, ADX remained at elevated levels but began to flatten, implying that trend strength was no longer increasing. Overall, the ADX/DMI system clearly illustrated the full cycle from weakening bullish momentum, trend reversal, strong bearish continuation, to declining momentum.
4.3.3 Practical Techniques
The primary value of ADX/DMI lies in providing dual insights into both trend strength and trend direction. In practice, ADX is commonly used to determine whether the market is entering a trending environment. Generally, an ADX above 25 suggests the market may be in a trend phase, whereas an ADX below 20 usually indicates a ranging market. In the chart, the consistent rise of ADX from late October to November—accompanied by falling prices—confirmed a clear bearish trend.
DMI crossovers can be used to judge trend direction.
- When DMI+ crosses above DMI-, bullish momentum strengthens.
- When DMI- crosses above DMI+, bearish momentum prevails.
However, such crossovers can become unreliable in low-trend or sideways markets, making ADX confirmation essential. In the chart, DMI- stayed above DMI+ for extended periods, and ADX trended upward—strongly validating the bearish trend.
ADX/DMI is also commonly used in combination with other indicators to filter noise and increase signal reliability. For example:
- If price breaks below the middle band or a moving-average system and DMI- exceeds DMI+ and ADX is rising, the trend-reversal signal becomes more convincing.
- Conversely, if RSI enters oversold territory while ADX flattens and the gap between DMI+ and DMI- narrows, this may indicate weakening trend momentum and potential stabilization.
The rebound seen in mid-November reflects exactly such a scenario—bearish momentum weakened, though the broader trend had not fully reversed.
Overall, ADX/DMI provides continuous insight throughout the formation and deterioration of trends, especially in identifying changes in trend strength. However, since it is a trend-following indicator with inherent lag, ADX/DMI is better suited as a trend-confirmation tool rather than a standalone signal generator.
4.4 Relative Strength Index (RSI)
4.4.1 Theoretical Foundation
The Relative Strength Index (RSI), developed by J. Welles Wilder in 1978, is a momentum oscillator that measures the speed of price gains and losses. Its primary function is to assess the relative strength of price movements and determine whether the market is in an overbought or oversold condition. The fundamental idea behind RSI is to compare the magnitude of recent gains to recent losses over a specified period and normalize the resulting momentum value to a range between 0 and 100, allowing for a clear visualization of market sentiment deviations.
The traditional RSI uses a 14-period calculation, though multi-period RSI sets are also common in practice to capture short-, medium-, and longer-term momentum shifts. Because RSI is inherently oscillatory, it performs particularly well in ranging markets. However, in strong trending environments, RSI may remain elevated or depressed for extended periods, requiring confirmation from trend-following indicators.
4.4.2 Indicator Interpretation
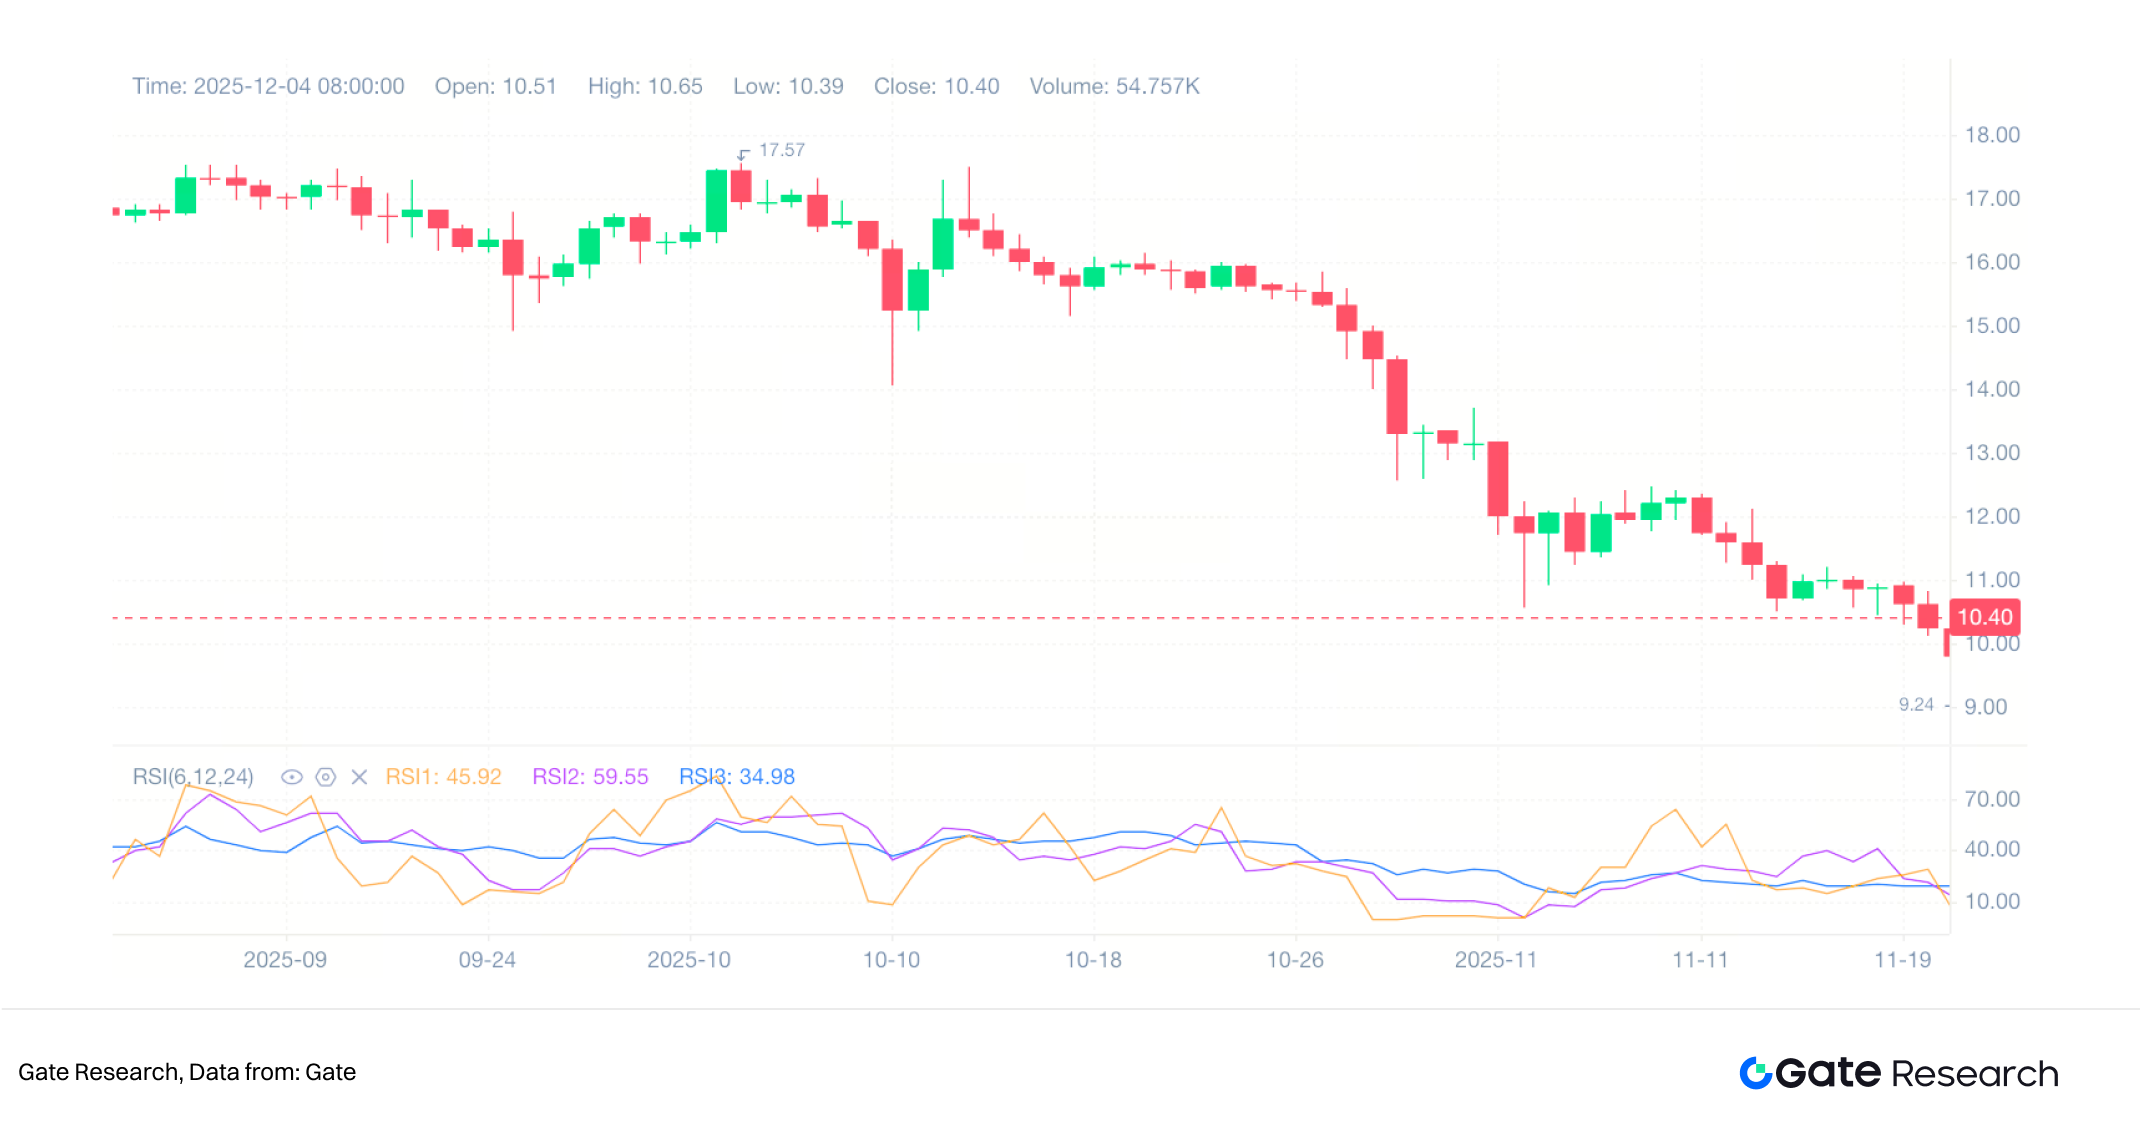
Using Gate’s default set of three RSIs (RSI1, RSI2, RSI3), we can illustrate the market structure as follows:
Before the price reached the October mid-month high of USD 126,193, the short-term RSI (RSI1) had already begun to decline, indicating an early weakening of short-term momentum, while the medium- and longer-term RSIs (RSI2 and RSI3) reacted more slowly. Such divergence between periods is often considered one of the signals that a trend may be nearing its peak.
Following this, the price experienced a sharp decline. The short-term RSI quickly fell below the 30 level, entering the oversold zone, while the medium-term RSIs (RSI2 and RSI3) subsequently followed downward. This progression reflects how bearish momentum gradually aligned across multiple timeframes, forming a more consistent bearish trend structure.
Performance of Momentum Indicators on BTC
5.1 Data Description
This study uses the daily historical data of Bitcoin (BTCUSDT) provided by the TradingView platform as the backtesting sample. To ensure consistency across different strategies, all strategies use the platform’s historical price series with an initial capital of USD 100,000. The data spans the period from November 26, 2024 to November 26, 2025. This timeframe includes phases of consolidation, decline, and rebound in Bitcoin, enabling examination of how trend-following and mean-reversion momentum indicators behave under varying market structures.
The dataset includes open, close, high, low prices, and trading volume. All technical indicators are calculated using closing prices. Since the platform automatically handles missing trading days and timestamp synchronization, no additional data cleaning is required. Throughout the backtesting period, all strategies operate under the same initial capital, fee assumptions, and execution logic to ensure comparability.
5.2 Backtesting Methodology
All strategies in this chapter are backtested using TradingView’s Strategy Tester, with the logic implemented in Pine Script v5. To ensure that the results accurately reflect the effectiveness of each indicator, a unified execution mechanism is used:
- When a signal is generated at the daily close,
- The actual entry or exit is executed at the next candle’s opening price.
This avoids look-ahead bias and aligns with practical trading principles where actions occur only after signal confirmation.
The fee model uses a common spot trading rate of 0.1%. All strategies open positions using full capital, without leverage, scaling in/out, or dynamic position sizing—ensuring that results reflect the quality of indicator-generated signals rather than portfolio management effects.
TradingView’s automated reporting provides performance metrics such as total return, maximum drawdown, profit factor, win rate, and number of trades. These serve as the core quantitative measures for evaluating each indicator’s performance across profitability, risk exposure, and trading efficiency.
5.3 Indicator Strategy Setup
All indicators backtested in this chapter are based on the theoretical discussions in earlier sections and maintain commonly used market parameter settings to avoid excessive parameter optimization.
The MACD strategy uses the difference between the 12-day and 26-day exponential moving averages as DIF, with its 9-day exponential moving average as the signal line. A long position is opened when DIF crosses upward through the signal line, and closed when DIF crosses back below the signal line, representing a typical trend-following logic.
The RSI strategy uses a 14-day parameter. When RSI falls below 30 and then crosses back above this level, it is regarded as a signal of a potential rebound; the position is closed when RSI approaches or falls below 70, representing a typical oversold mean-reversion strategy in range-bound markets.
The ADX/DMI strategy uses a 14-day calculation period. When DMI+ crosses above DMI− and ADX is above 25, the market is considered to have entered a directional trend phase, and a long position is opened; conversely, when trend signals disappear or momentum weakens, the position is closed.
The Bollinger Bands strategy constructs a channel based on the 20-day moving average and two standard deviations. When the closing price breaks above the upper band, it is regarded as a sign of volatility expansion and a long position is opened; when the price falls back below the middle band, the position is closed.
The four strategies respectively represent different trading philosophies: trend following, range reversal, trend confirmation, and volatility breakout, offering a relatively comprehensive reflection of how technical indicators perform under different market structures.
5.4 Backtesting Results
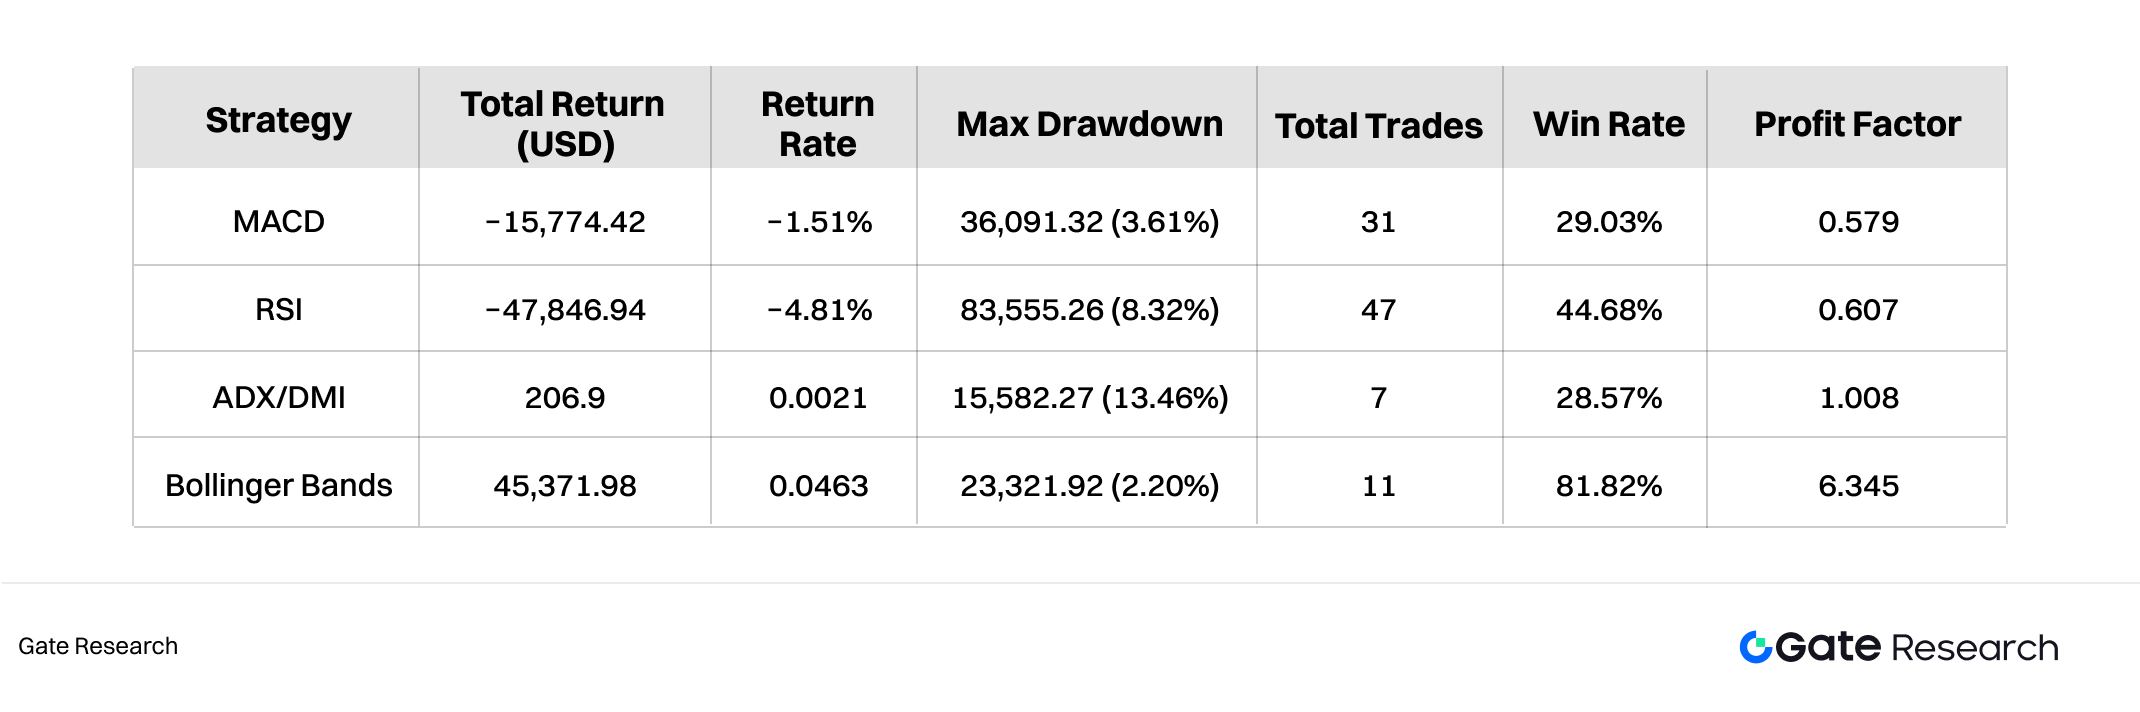
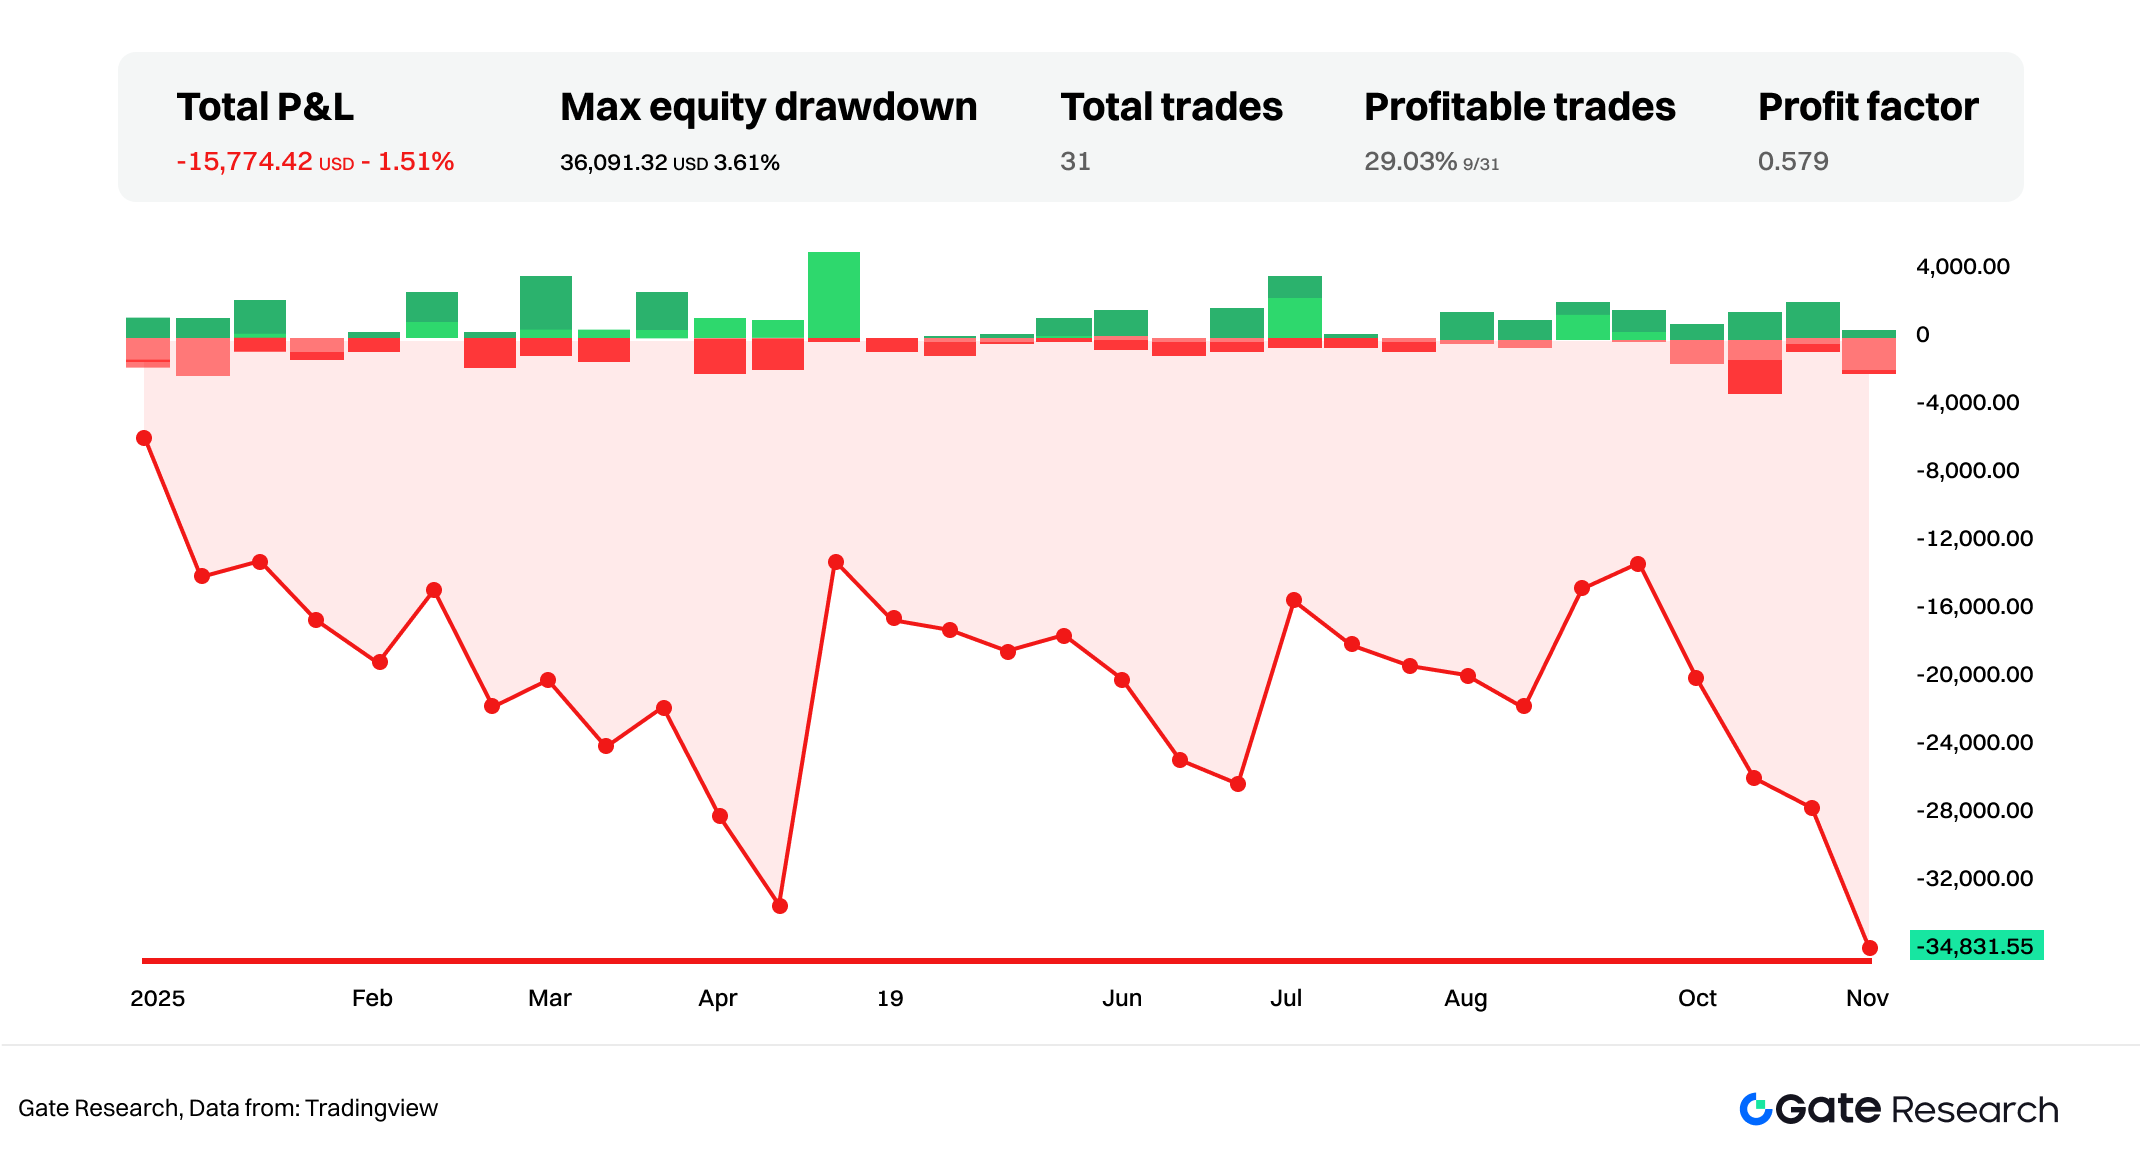
According to the backtesting results from TradingView, during the one-year period from late 2024 to late 2025, the performance of different indicator strategies showed significant variation. The MACD strategy performed poorly overall during this period, with a total return of −15,774.42 USD, or approximately −1.51%. This indicates a lack of sustained trends throughout the year, causing the MACD to generate multiple false breakout signals that resulted in a series of losing trades. Its maximum drawdown reached 36,091.32 USD, the win rate was only 29.03%, and the profit factor was 0.579, reflecting the tendency of trend-following strategies to fail in ranging market conditions.
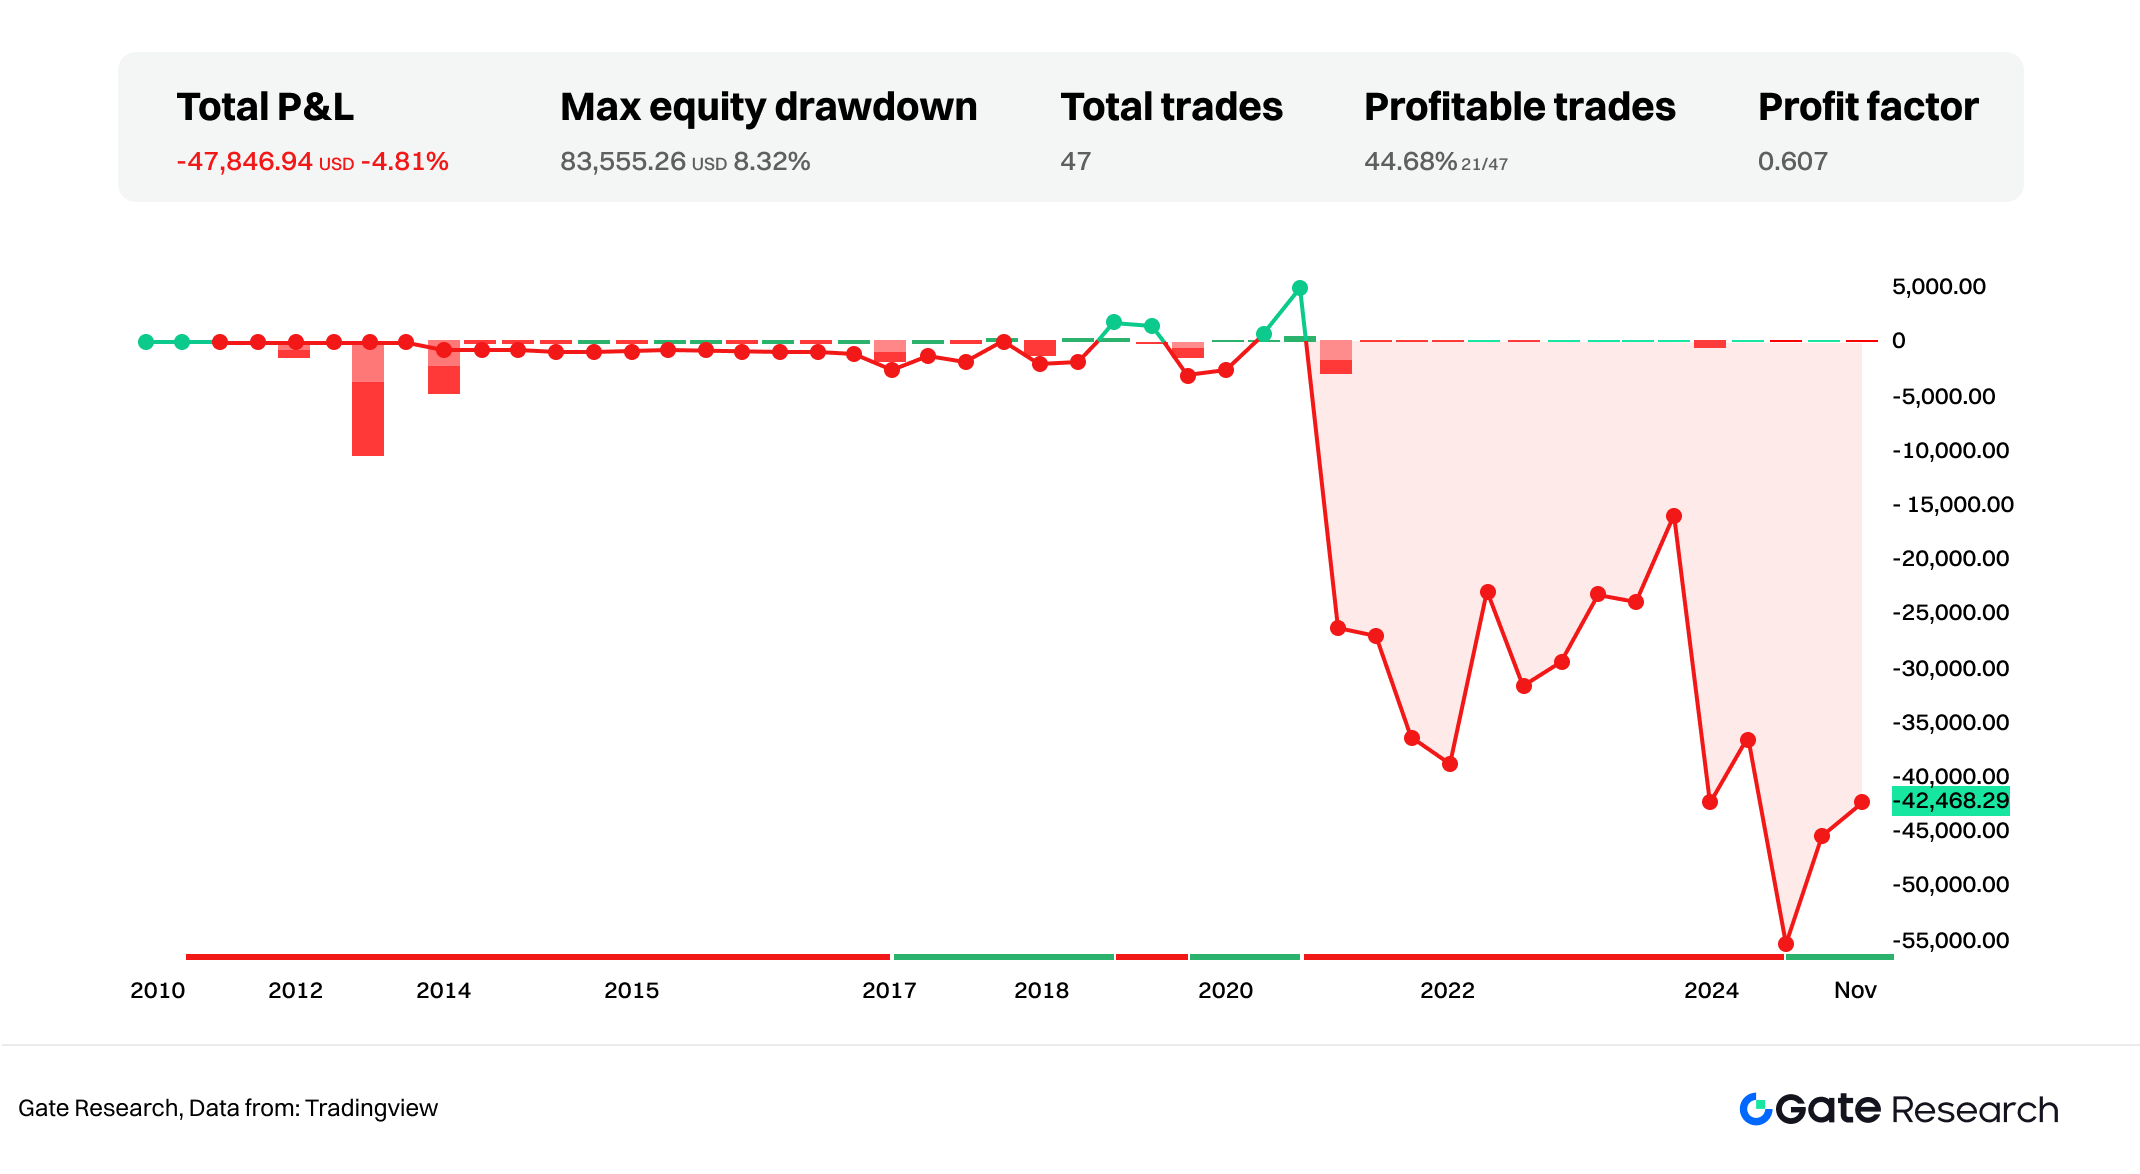
The RSI strategy also showed negative performance in the backtest, with a total return of −47,846.94 USD and a return rate of −4.81%, making it the weakest among the four strategies. Since the overall price movement during this period trended downward, ideal reversal patterns were rare, and the RSI repeatedly generated incorrect oversold rebound signals within the downtrend, causing losses to accumulate continuously. The maximum drawdown reached as high as 83,555.26 USD, significantly higher than that of the other strategies. The profit factor was 0.607, and although the win rate reached 44.68%, the risk-reward ratio was highly unfavorable, leading to poor overall performance of the strategy.
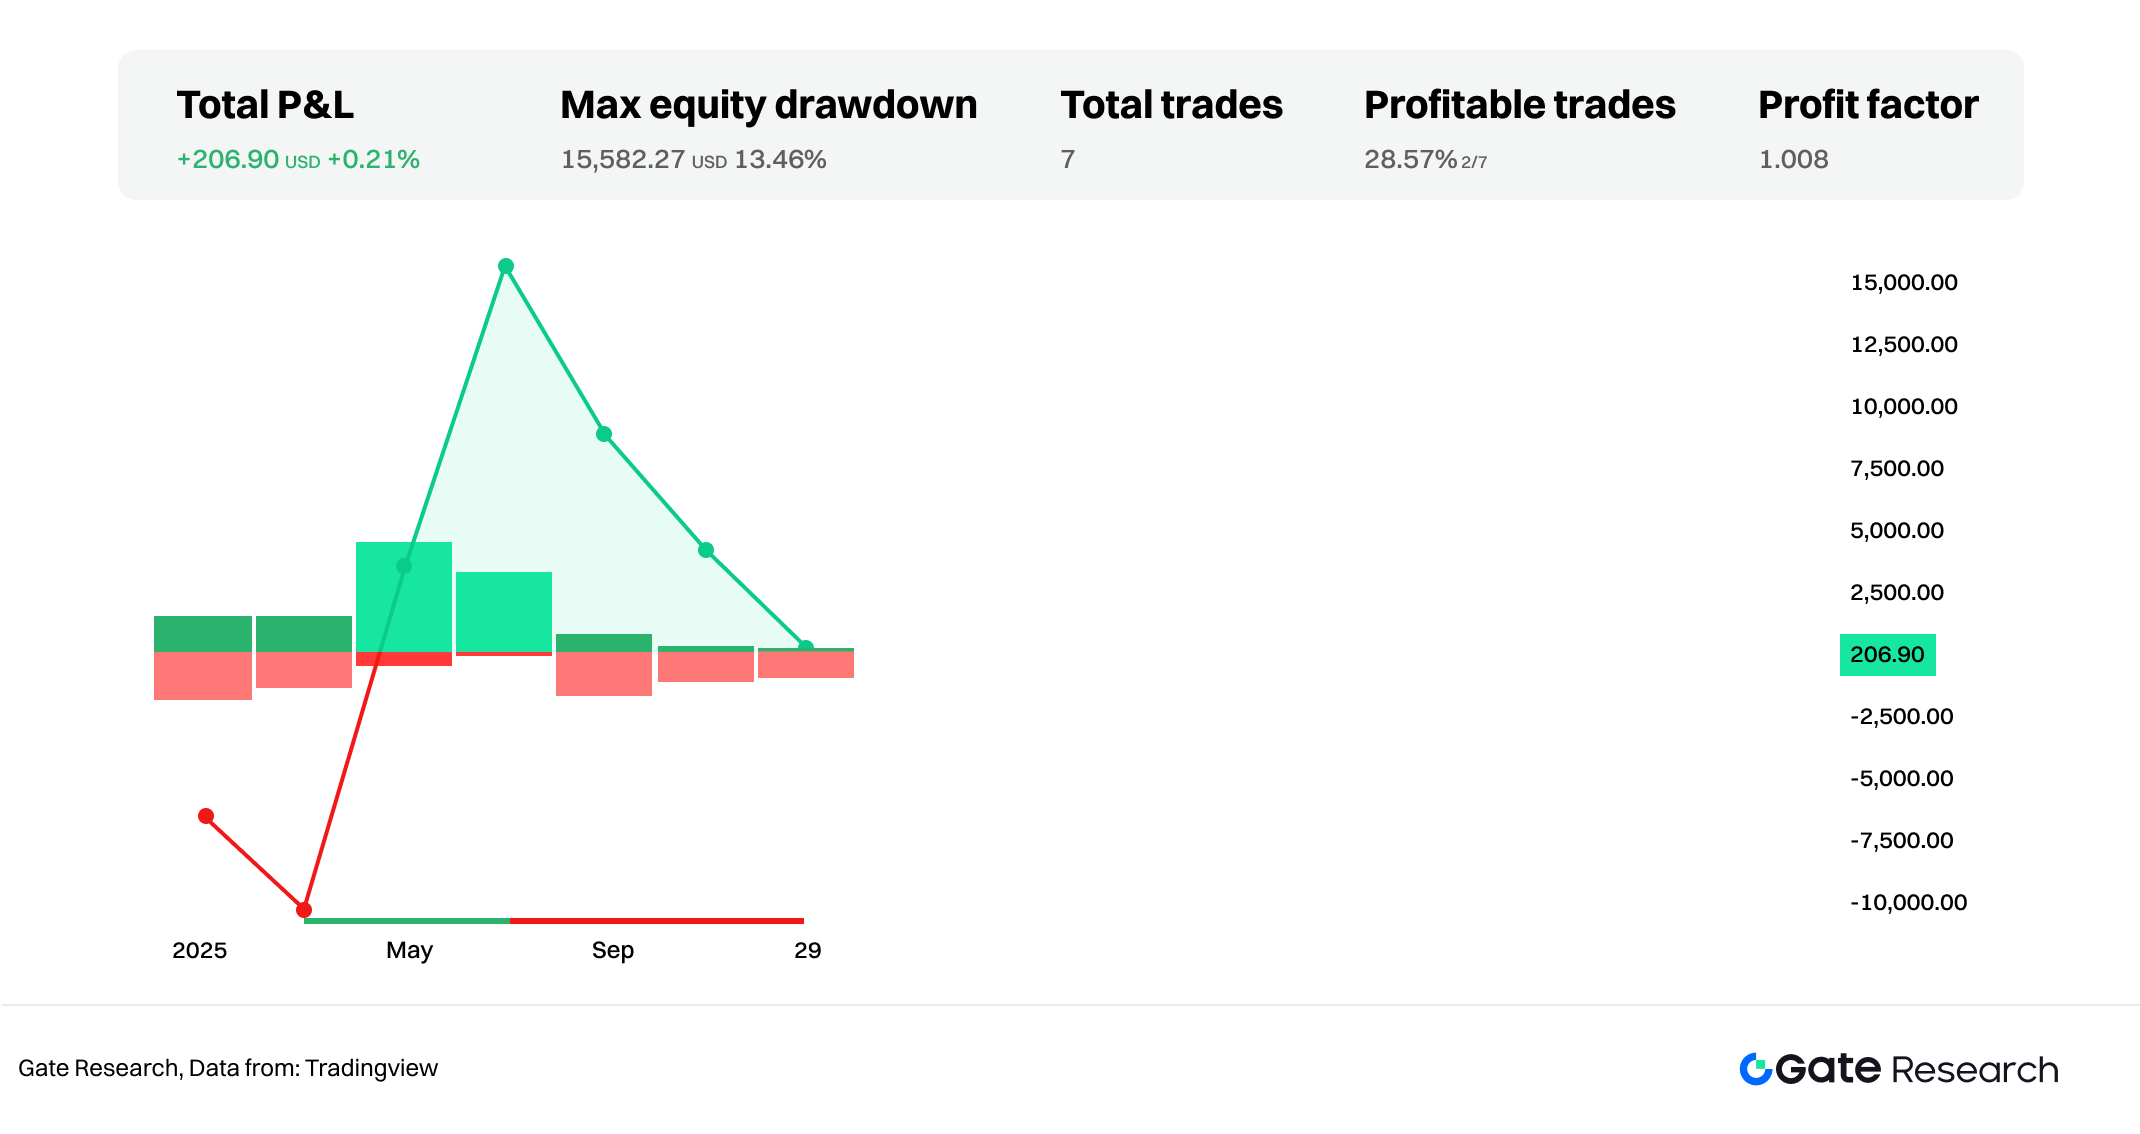
The ADX/DMI strategy had the fewest trades, with only 7 entries and exits, reflecting the indicator’s strict requirement for trend conditions and its tendency to generate signals only when a trend becomes clear. Its total return was 206.90 USD, with a return rate of approximately 0.21%. Although this does not represent significant profit, it effectively avoided overtrading in a ranging market. The maximum drawdown was 13.46%, the win rate was under 30%, but the profit factor was 1.008, slightly above 1, indicating that the strategy was able to maintain a near break-even performance during a year with insufficient trend strength.
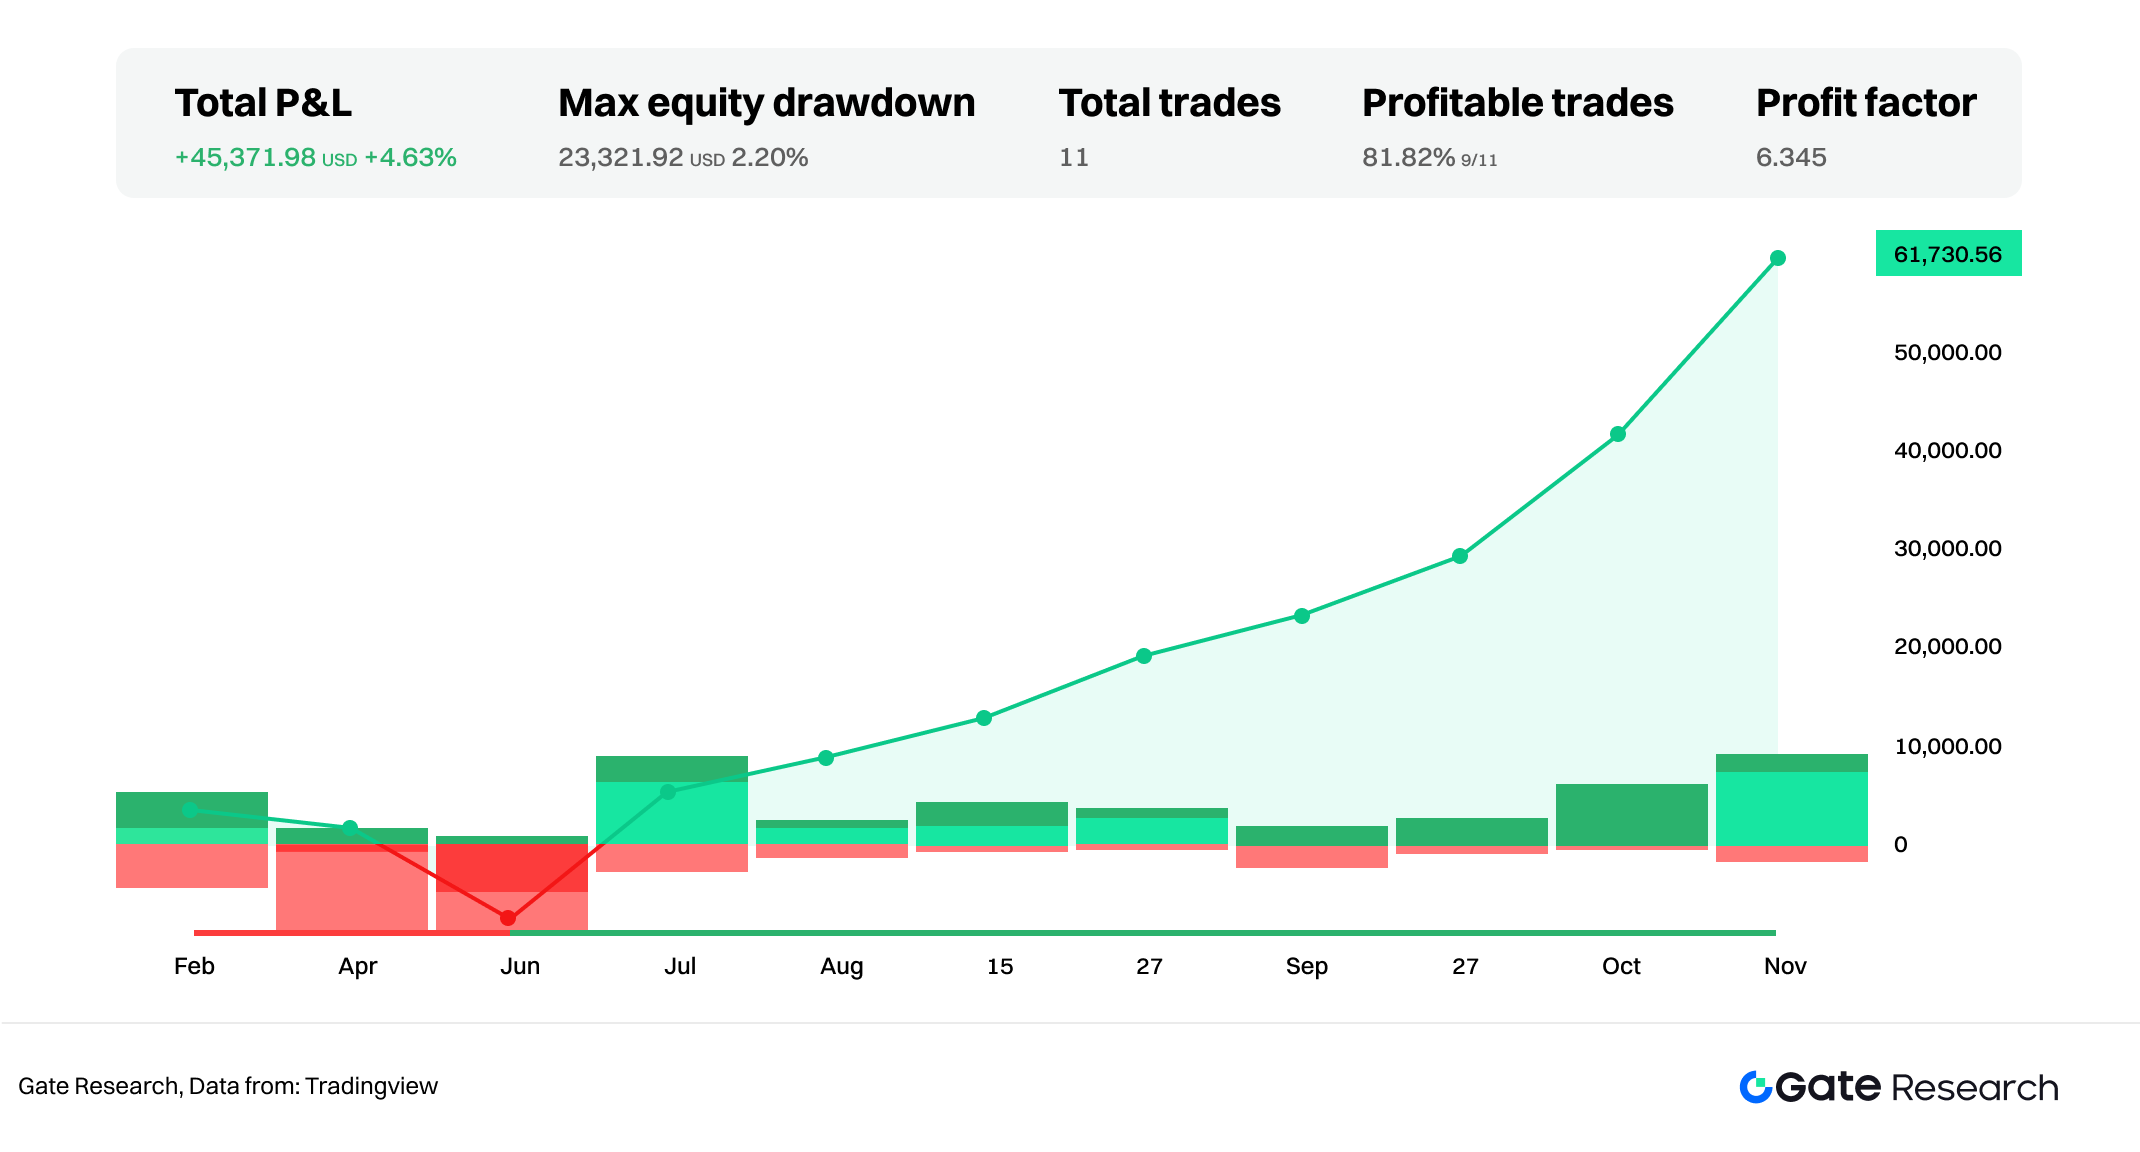
The best-performing strategy was the Bollinger Band breakout strategy, with a total profit of 45,371.98 USD, corresponding to a return rate of 4.63%. During this one-year period, Bitcoin experienced multiple phases of volatility expansion, and the Bollinger Band breakout strategy was able to capture gains arising from price breakouts during periods of rapidly increasing volatility. Out of 11 trades, 9 were profitable, resulting in a high win rate of 81.82%. The profit factor reached 6.345, the highest among all strategies. Its maximum drawdown was only 2.20%, indicating that the strategy not only generated substantial returns but also maintained relatively limited downside risk, giving it a clear advantage in a market environment characterized by both trend and volatility.
Conclusion
Momentum investing is based on the idea of trend continuation, emphasizing the tendency of prices to move in the same direction over a period of time. By reviewing the concept of momentum, its quantitative methods, and its behavioral finance foundations, it becomes evident that cryptocurrencies—especially Bitcoin—often exhibit more pronounced momentum characteristics than traditional assets due to their high volatility and the complexity of market participant structures. Indicators such as MACD, Bollinger Bands, ADX/DMI, and RSI describe trend direction, momentum shifts, volatility structure, and market sentiment from different perspectives, and are among the most commonly used tools in momentum analysis. Visual examination shows that different indicators present unique structural signals during trend formation, momentum decay, and price reversal, such as MACD’s zero-line transitions, Bollinger Band width expansion, ADX’s increase in trend strength, and RSI’s reflections of extreme sentiment. These indicators provide complementary perspectives for understanding market structure from both theoretical and visual standpoints.
Backtesting results under unified settings show that the performance of momentum indicators depends heavily on market structure, rather than being consistently effective across all conditions. From 2024 to 2025, Bitcoin was largely in a weak and choppy market environment, causing trend-following indicators like MACD and oversold-reversal indicators like RSI to frequently encounter false signals and weak rebounds, resulting in overall negative performance. ADX/DMI, which requires clear trend conditions, produced only a small number of trading opportunities throughout the year, yielding insignificant returns but maintaining relatively controlled risk. The best-performing strategy was the Bollinger Band breakout, which benefited from capturing volatility expansion and achieved high win rates and stable drawdowns in an environment with frequent rapid price movements. Overall, the effectiveness of momentum indicators depends on trend strength and volatility structure, and in the cryptocurrency market, it is especially important to consider the match between the indicator and the market phase. Combining indicators, introducing trend or volatility filters, and adding multi-timeframe confirmation may further improve the robustness of momentum strategies and provide a more adaptive quantitative framework for cryptocurrency investment.
Reference
- TradingView, https://www.tradingview.com/support/solutions/43000599883-momentum-strategy/
- Wikipedia, https://en.wikipedia.org/wiki/Momentum_investing
- Cousera, https://www.coursera.org/learn/introduction-to-momentum-investing
- Interactivebrokers, https://www.interactivebrokers.com/campus/ibkr-quant-news/momentum-trading-types-strategies-and-more-part-i/
- WarriorTrading, https://www.warriortrading.com/momentum-day-trading-strategy/
- Quantinsti, https://blog.quantinsti.com/momentum-trading-strategies/
- Gate, https://www.gate.com/trade/BTC_USDT
Gate Research is a comprehensive blockchain and cryptocurrency research platform that provides deep content for readers, including technical analysis, market insights, industry research, trend forecasting, and macroeconomic policy analysis.
Disclaimer
Investing in cryptocurrency markets involves high risk. Users are advised to conduct their own research and fully understand the nature of the assets and products before making any investment decisions. Gate is not responsible for any losses or damages arising from such decisions.
Share
Content


Related Articles

In-depth Explanation of Yala: Building a Modular DeFi Yield Aggregator with $YU Stablecoin as a Medium

BTC and Projects in The BRC-20 Ecosystem

What Is a Cold Wallet?

Blockchain Profitability & Issuance - Does It Matter?
What is the Altcoin Season Index?
