Full Analysis of Gold Trends in 2025: Predicting Future Directions Through Candlestick Charts
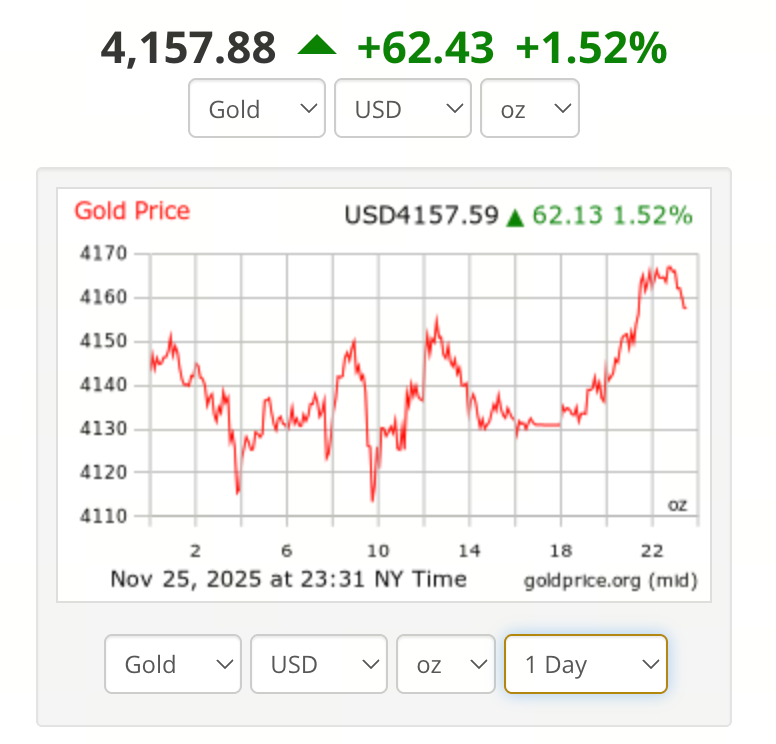
Image source: https://goldprice.org/
Gold Market Overview and Price Review
As of November 26, 2025, the international spot gold price stood at approximately $4,151.88 per ounce, up 0.45% from the previous trading day. Gold prices have been highly volatile in recent months, with prices hitting record highs earlier this year before retreating as profit-taking and shifting market sentiment set in. Despite the correction, prices remain well above last year’s levels, and overall, gold has delivered strong performance in 2025, continuing to draw significant investor attention.
What Is a Candlestick Chart and How Is It Used in Gold Analysis?
The candlestick chart (often called a “K-line chart” or simply “K-line”) is one of the most widely used price charts in financial markets. Each candlestick displays the open, close, high, and low prices for a specific time frame—such as a day, week, or month. When the closing price exceeds the opening price, the candlestick is typically shown as hollow or with a green body. If the closing price is lower, it’s depicted as solid or with a red or black body. The wick (also known as shadow) marks the price range (highs and lows) during that period. For gold traders and investors, identifying distinct candlestick patterns—such as long wicks, Doji, Hammer, or Engulfing formations—helps gauge market buying and selling pressure. This supports both trading and long-term decision-making.
Practical Insights: Recent Gold Candlestick Trends and Key Price Levels
Recent price action highlights the $4,150 per ounce area as a critical support level and area to watch. If gold repeatedly tests this level without breaking below it, the market may establish support at this level. If it does fall through, heightened volatility or downside risk may occur. This example demonstrates the practical value of candlestick analysis. If future gold prices form a long lower wick or “Hammer” pattern, that may signal easing sell pressure and renewed buying. This suggests short-term rebound potential. Conversely, a long upper wick or “Shooting Star” pattern could indicate short-term resistance, so traders should exercise caution regarding possible pullbacks.
However, relying solely on a single candlestick is risky; it’s best to combine candlestick signals with volume, market sentiment, and fundamental analysis for a more comprehensive view.
Key Drivers of Gold Prices: Macroeconomic Factors and Market Sentiment
Macroeconomic conditions and market sentiment have a significant impact on gold prices, beyond what technical charts show.
- Monetary Policy and Interest Rates: When major economies (such as the United States) cut rates or maintain low rates, gold becomes more attractive as a non-yielding asset.
- US Dollar Strength and Exchange Rate Fluctuations: Gold is priced in US dollars, so a weaker dollar makes gold cheaper for holders of other currencies, often boosting demand.
- Geopolitical Events, Uncertainty, and Safe-Haven Demand: During periods of economic or political instability, gold’s role as a safe-haven asset grows more prominent.
- Supply and Demand: Shifts in global central bank gold reserves and physical gold consumption (jewelry or investment gold) also influence prices.
In short, candlestick charts alone aren’t enough. Understanding the macro environment and market sentiment is essential.
Investor Perspective: How to Combine Candlestick Charts with Fundamentals for Decision-Making
Short-term traders can leverage daily or hourly candlestick charts to spot entry and exit opportunities, such as trend reversals and support or resistance breakouts. For medium- and long-term investors, it is important to track macro trends—like inflation expectations, interest rate developments, dollar exchange rates, and geopolitical risks. If investors expect gold to stay strong, they may consider dollar-cost averaging or gradually increasing their position. If volatility is anticipated, investors may choose to buy during price dips or reduce their holdings as appropriate.
Ultimately, using candlestick analysis as a supplementary tool—together with fundamentals and market sentiment—can help investors approach gold investing with increased rationality and discipline.
Share
Content
Gold Market Overview and Price Review
What Is a Candlestick Chart and How Is It Used in Gold Analysis?
Practical Insights: Recent Gold Candlestick Trends and Key Price Levels
Key Drivers of Gold Prices: Macroeconomic Factors and Market Sentiment
Investor Perspective: How to Combine Candlestick Charts with Fundamentals for Decision-Making


Related Articles

Pi Coin Transaction Guide: How to Transfer to Gate.com

Flare Crypto Explained: What Is Flare Network and Why It Matters in 2025

How to Use a Crypto Whale Tracker: Top Tool Recommendation for 2025 to Follow Whale Moves

2025 BTC Price Prediction: BTC Trend Forecast Based on Technical and Macroeconomic Data

What is N2: An AI-Driven Layer 2 Solution