XCAD vs BTC: The Battle of Digital Assets in the Creator Economy
Introduction: XCAD vs BTC Investment Comparison
In the cryptocurrency market, XCAD vs BTC comparison has always been a topic that investors cannot avoid. The two not only have significant differences in market cap ranking, application scenarios, and price performance, but also represent different positions in crypto assets.
XCAD (XCAD): Since its launch in 2021, it has gained market recognition for providing DeFi tools for creators to create an incentive economy.
Bitcoin (BTC): Since its inception in 2009, it has been hailed as "digital gold" and is one of the cryptocurrencies with the highest global trading volume and market capitalization.
This article will comprehensively analyze the investment value comparison between XCAD and BTC, focusing on historical price trends, supply mechanisms, institutional adoption, technological ecosystems, and future predictions, and attempt to answer the question that investors are most concerned about:
"Which is the better buy right now?" I. Price History Comparison and Current Market Status
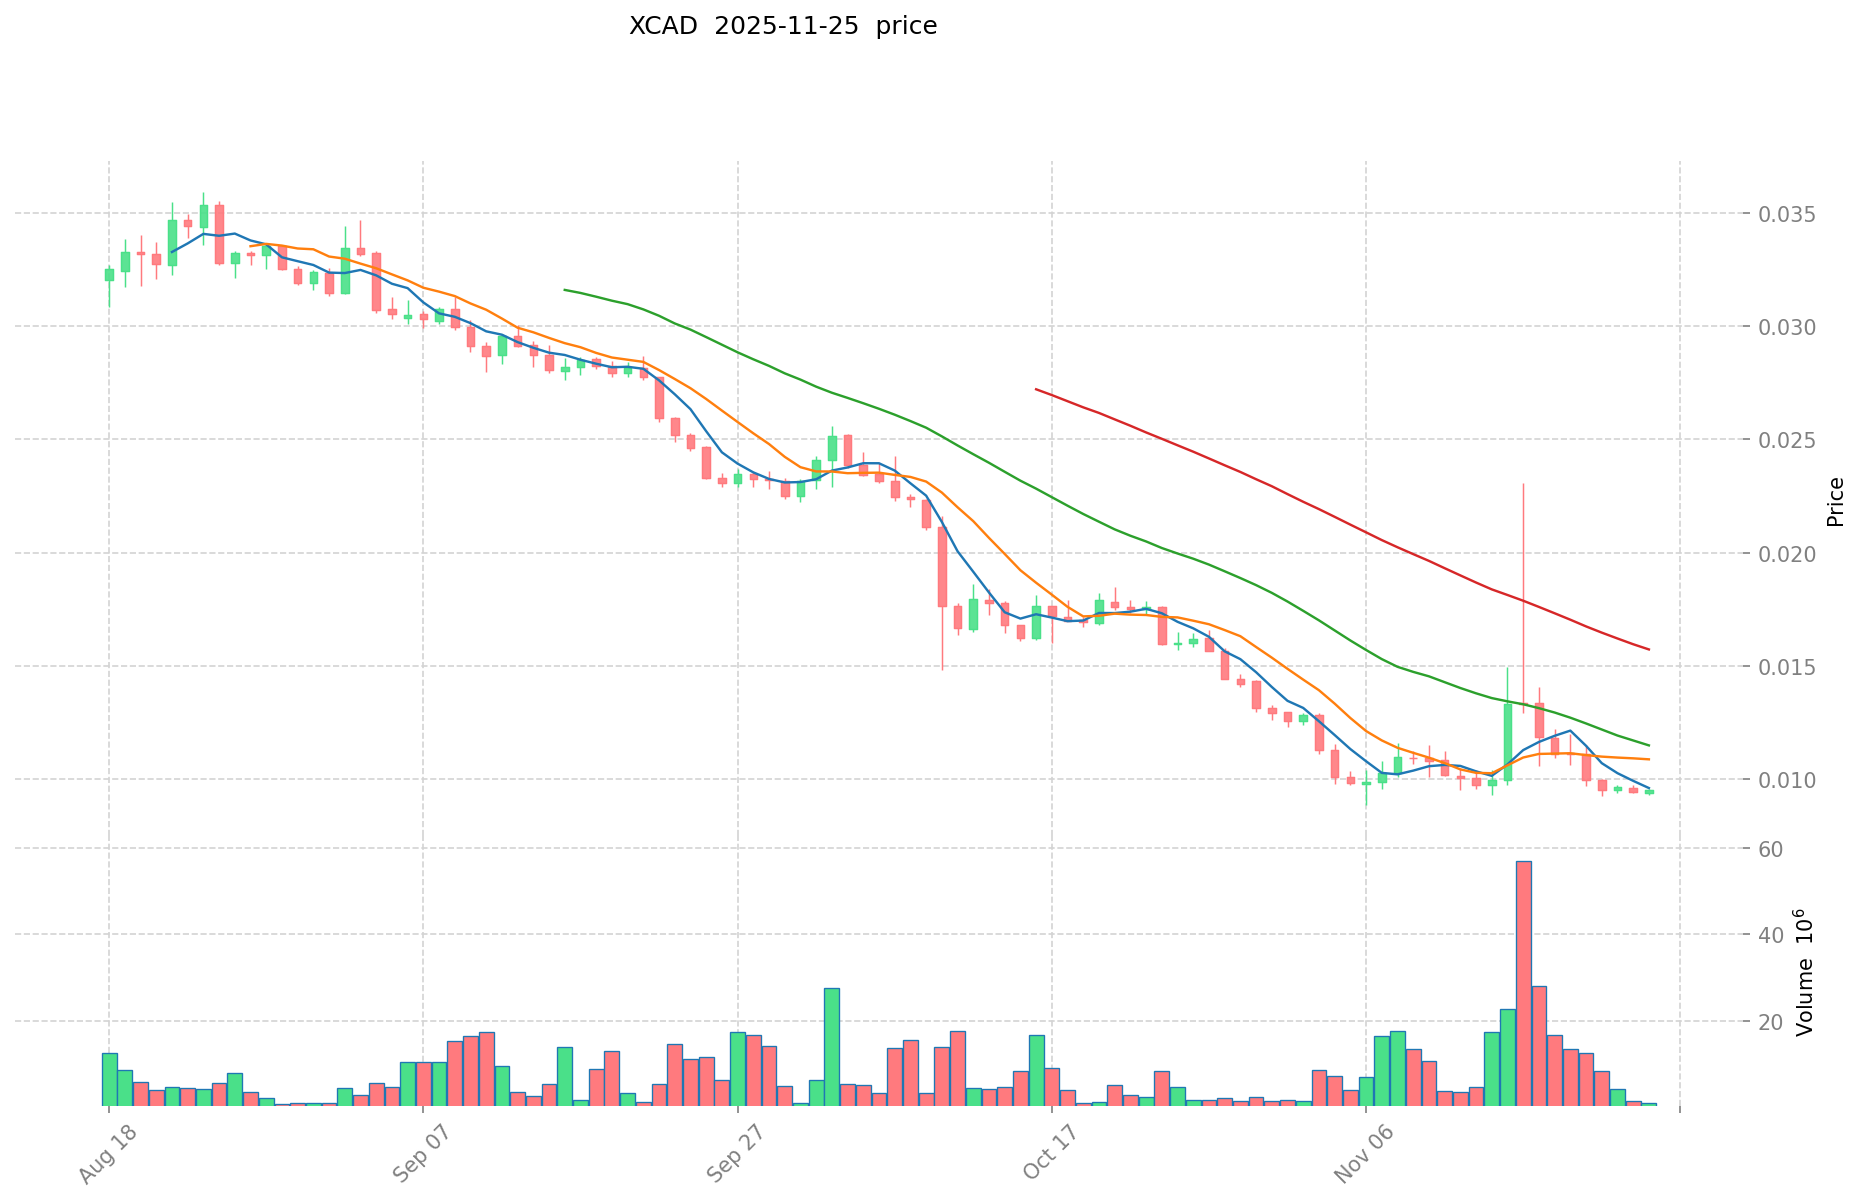
XCAD and BTC Historical Price Trends
- 2021: XCAD reached its all-time high of $9.06 on January 21, 2022.
- 2021: BTC hit a record high of $69,000 in November 2021 due to increased institutional adoption.
- Comparative analysis: During the 2022 bear market, XCAD dropped from $9.06 to a low of $0.0089351, while BTC declined from $69,000 to around $15,000.
Current Market Situation (2025-11-26)
- XCAD current price: $0.009424
- BTC current price: $87,622.4
- 24-hour trading volume: $4,944.91 (XCAD) vs $526,249,003.26 (BTC)
- Market Sentiment Index (Fear & Greed Index): 20 (Extreme Fear)
Click to view real-time prices:
- View XCAD current price Market Price
- View BTC current price Market Price

II. Key Factors Influencing XCAD vs BTC Investment Value
Supply Mechanism Comparison (Tokenomics)
- XCAD: Utility token functioning across gaming and entertainment ecosystems, particularly in the XCAD Network's SocialFi platform
- BTC: Fixed supply with halving mechanism creating scarcity, functioning as a store of value and digital property
- 📌 Historical Pattern: BTC's supply mechanism drives cyclical price movements, while XCAD's value fluctuates based on ecosystem adoption and utility
Institutional Adoption and Market Applications
- Institutional Holdings: BTC enjoys stronger institutional adoption, with companies like MicroStrategy using dual valuation models based on Bitcoin's current value and future premium expectations
- Enterprise Adoption: XCAD functions as a utility token in Watch2Earn platforms connecting YouTube creators with fans, while BTC serves as a hedge against fiat currency devaluation
- Regulatory Attitudes: BTC faces varied regulatory approaches globally, while XCAD's regulatory framework is less established
Technical Development and Ecosystem Building
- XCAD Technical Features: Core component of XCAD Network's PLAY zone centered around Watch2Earn concept, enabling NFT transactions and ecosystem rewards
- BTC Technical Development: Positioned as "digital property" against traditional financial system deterioration
- Ecosystem Comparison: XCAD integrated into NFT ecosystems allowing users to purchase, trade, upgrade and repair NFTs, while BTC serves primarily as a store of value
Macroeconomic Factors and Market Cycles
- Inflation Performance: BTC viewed as a hedge against continuous devaluation of fiat currencies
- Monetary Policy Effects: BTC pricing influenced by expectations around US debt management and money printing
- Geopolitical Factors: BTC positioned as an "ark" to escape traditional financial systems under strain
III. 2025-2030 Price Prediction: XCAD vs BTC
Short-term Prediction (2025)
- XCAD: Conservative $0.00810464 - $0.009424 | Optimistic $0.009424 - $0.0113088
- BTC: Conservative $84,270.53 - $87,781.80 | Optimistic $87,781.80 - $107,971.61
Mid-term Prediction (2027)
- XCAD may enter a growth phase, with an estimated price range of $0.01050686472 - $0.01437145864
- BTC may enter a bullish market, with an estimated price range of $105,266.40 - $127,489.30
- Key drivers: Institutional capital inflow, ETF, ecosystem development
Long-term Prediction (2030)
- XCAD: Base scenario $0.016587060526476 - $0.021729049289683 | Optimistic scenario $0.021729049289683+
- BTC: Base scenario $145,406.14 - $175,941.43 | Optimistic scenario $175,941.43+
Disclaimer: This analysis is for informational purposes only and should not be considered as financial advice. Cryptocurrency markets are highly volatile and unpredictable. Always conduct your own research before making any investment decisions.
XCAD:
| 年份 | 预测最高价 | 预测平均价格 | 预测最低价 | 涨跌幅 |
|---|---|---|---|---|
| 2025 | 0.0113088 | 0.009424 | 0.00810464 | 0 |
| 2026 | 0.013787312 | 0.0103664 | 0.009744416 | 10 |
| 2027 | 0.01437145864 | 0.012076856 | 0.01050686472 | 28 |
| 2028 | 0.0166624382232 | 0.01322415732 | 0.0074055280992 | 40 |
| 2029 | 0.018230823281352 | 0.0149432977716 | 0.011506339284132 | 58 |
| 2030 | 0.021729049289683 | 0.016587060526476 | 0.009620495105356 | 76 |
BTC:
| 年份 | 预测最高价 | 预测平均价格 | 预测最低价 | 涨跌幅 |
|---|---|---|---|---|
| 2025 | 107971.614 | 87781.8 | 84270.528 | 0 |
| 2026 | 136048.62273 | 97876.707 | 80258.89974 | 11 |
| 2027 | 127489.30470285 | 116962.664865 | 105266.3983785 | 33 |
| 2028 | 160116.04006694175 | 122225.984783925 | 99003.04767497925 | 39 |
| 2029 | 149641.2731709593775 | 141171.012425433375 | 103054.83907056636375 | 61 |
| 2030 | 175941.432785817615262 | 145406.14279819637625 | 98876.17710277353585 | 65 |
IV. Investment Strategy Comparison: XCAD vs BTC
Long-term vs Short-term Investment Strategies
- XCAD: Suitable for investors focused on ecosystem potential and SocialFi applications
- BTC: Suitable for investors seeking stability and inflationary hedge properties
Risk Management and Asset Allocation
- Conservative investors: XCAD: 10% vs BTC: 90%
- Aggressive investors: XCAD: 30% vs BTC: 70%
- Hedging tools: Stablecoin allocation, options, cross-currency portfolios
V. Potential Risk Comparison
Market Risk
- XCAD: Higher volatility due to lower market cap and trading volume
- BTC: Susceptible to macroeconomic factors and institutional sentiment
Technical Risk
- XCAD: Scalability, network stability
- BTC: Mining concentration, security vulnerabilities
Regulatory Risk
- Global regulatory policies have different impacts on both assets
VI. Conclusion: Which Is the Better Buy?
📌 Investment Value Summary:
- XCAD advantages: Utility in growing SocialFi and NFT ecosystems, potential for high growth
- BTC advantages: Established market leader, institutional adoption, store of value properties
✅ Investment Advice:
- New investors: Consider a small allocation to XCAD for exposure to emerging trends, with a larger allocation to BTC for stability
- Experienced investors: Balanced approach with higher risk tolerance for XCAD, maintaining significant BTC holdings
- Institutional investors: Focus on BTC for its established track record and regulatory clarity, with potential small allocations to XCAD for diversification
⚠️ Risk Warning: Cryptocurrency markets are highly volatile. This article does not constitute investment advice. None
VII. FAQ
Q1: What are the main differences between XCAD and BTC in terms of investment value? A: XCAD is a utility token for SocialFi and NFT ecosystems with high growth potential, while BTC is an established market leader with institutional adoption and store of value properties.
Q2: How do the supply mechanisms of XCAD and BTC differ? A: XCAD functions as a utility token across gaming and entertainment ecosystems, while BTC has a fixed supply with a halving mechanism creating scarcity.
Q3: Which asset is more suitable for long-term investment? A: BTC is generally considered more suitable for long-term investment due to its established market position and institutional adoption, while XCAD may offer higher growth potential but with increased risk.
Q4: How do institutional adoptions compare between XCAD and BTC? A: BTC enjoys stronger institutional adoption, with companies like MicroStrategy holding it as a treasury asset. XCAD's institutional adoption is currently less pronounced.
Q5: What are the key factors influencing the price of XCAD and BTC? A: XCAD's price is influenced by ecosystem adoption and utility, while BTC's price is affected by macroeconomic factors, institutional sentiment, and its role as a hedge against inflation.
Q6: How do the risk profiles of XCAD and BTC compare? A: XCAD generally has a higher risk profile due to its lower market cap and trading volume, while BTC, though still volatile, is considered more stable within the cryptocurrency market.
Q7: What allocation strategy would you recommend for a balanced portfolio including XCAD and BTC? A: A conservative approach might allocate 10% to XCAD and 90% to BTC, while a more aggressive strategy could allocate 30% to XCAD and 70% to BTC, depending on individual risk tolerance.
Share
Content

