What causes cryptocurrency price volatility and how to predict market swings in 2026?


Historical Price Trends and Support/Resistance Levels: Analyzing Cyclical Volatility Patterns in 2026
Understanding historical price data is fundamental to identifying support and resistance levels that define cryptocurrency volatility patterns heading into 2026. When analysts examine cyclical volatility in crypto markets, they recognize that price movements repeat patterns based on technical levels established through previous trading activity. Story Network, for instance, demonstrated this principle clearly when its price ranged from a high of $14.93 to a low of $1.10, establishing clear resistance and support boundaries that traders monitor closely.
The relationship between historical trends and market swings becomes apparent when studying these technical levels. Support represents a price floor where buying pressure typically emerges, preventing further decline, while resistance marks a ceiling where selling pressure intensifies. By analyzing past 12 months of volatility data—including a dramatic 43.68% swing over seven days—traders can map cyclical patterns that suggest when market reversals may occur. These patterns often correspond with macroeconomic factors and market sentiment shifts.
Cryptocurrency volatility in 2026 will likely follow established cyclical patterns that historical analysis reveals. The extreme price swings observed in digital assets occur because support and resistance levels act as psychological barriers that market participants recognize and react to repeatedly. When prices approach historically significant levels, volatility tends to increase as traders position for potential breakouts or reversals.
Effective volatility prediction requires combining historical price trend analysis with technical level identification. By understanding where support and resistance have formed previously, investors can anticipate periods of heightened volatility and potential market swings. This technical foundation, strengthened through extended historical observation, provides the framework for forecasting cryptocurrency market behavior throughout 2026.
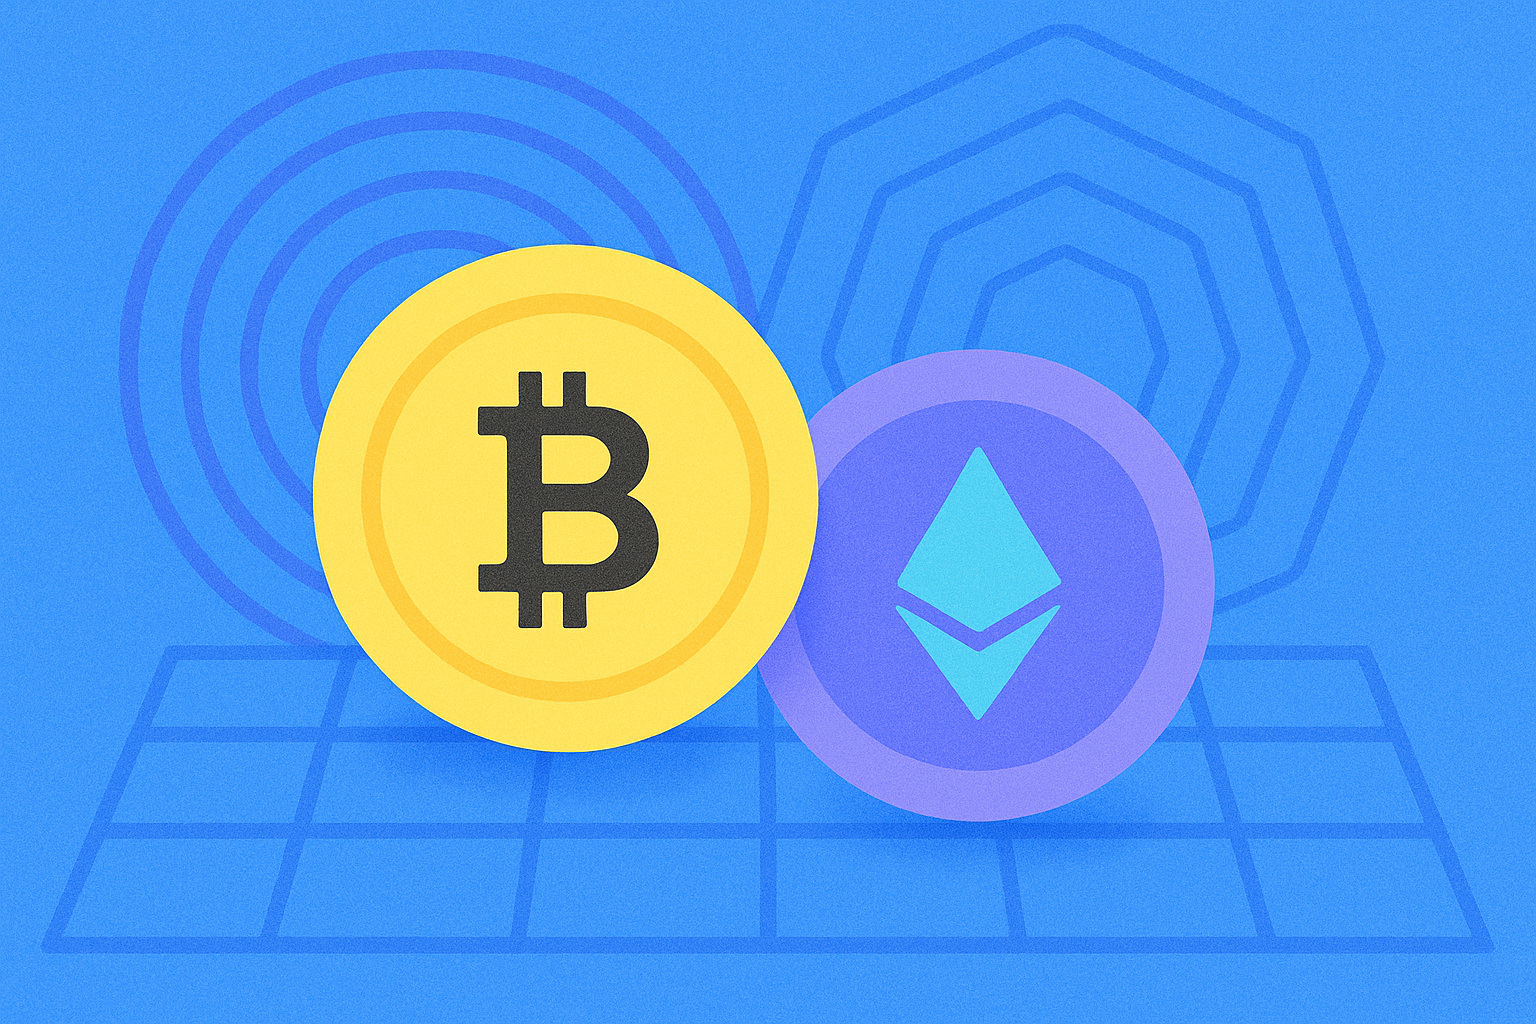
Volatility Drivers and Market Correlation: Understanding BTC/ETH Dependencies and 40%+ Price Swings
Bitcoin and Ethereum experience distinct volatility profiles that fundamentally shape cryptocurrency market swings. Implied volatility serves as the primary volatility driver for options markets, with Ethereum consistently demonstrating higher IV levels than Bitcoin. Recent data shows ETH implied volatility at 73.37% compared to Bitcoin's 49%, reflecting the market's perception that Ethereum exhibits greater price reactivity. This disparity becomes especially pronounced during market stress, as the 7-day ETH/BTC IV ratio climbed from 1.63 to 2.2 during July's regulatory-driven rally, when Ethereum surged over 58% on infrastructure optimism.
Despite elevated implied volatility, BTC and ETH historically maintained a strong 0.89 correlation coefficient throughout 2025, suggesting aligned directional movements driven by shared macroeconomic and regulatory catalysts. However, this relationship fractured during institutional capital reallocation periods. When $4 billion flowed into Ethereum ETFs while Bitcoin experienced outflows, DEX-specific activity drove ETH-centric demand patterns that temporarily decoupled both assets from their traditional correlation baseline. These deviation periods occurred as infrastructure maturity and smart contract innovations created asset-specific momentum independent of Bitcoin's institutional flows.
The 40%+ price swings observed during extreme market conditions typically emerge from combined volatility drivers: regulatory announcements, macroeconomic shifts, and institutional positioning changes. Bitcoin's implied volatility remained historically subdued relative to Ethereum even during all-time high price reaches near $126,000, underscoring persistent market perception of Ethereum as the more volatile asset. Understanding these correlation dependencies and IV dynamics becomes essential for anticipating directional shifts in 2026 crypto markets.
Predictive Models for Cryptocurrency Market Movements: Forecasting Strategies for 2026 Trading
Advanced predictive models are reshaping how traders forecast cryptocurrency market movements in 2026. By leveraging machine learning and predictive analytics, trading desks can uncover patterns invisible to traditional analysis methods, enabling faster and more accurate forecasting strategies. These systems analyze historical price data, volume patterns, and market sentiment to identify emerging trends before they become obvious to retail participants.
The landscape has shifted dramatically with institutional adoption accelerating and regulatory clarity establishing clearer market frameworks. Analysts project Bitcoin reaching $200,000 to $300,000 by year-end 2026, with this trajectory influenced by DeFi maturation and AI integration reshaping cryptocurrency market dynamics. AI agents are expected to play an increasingly significant role in executing trades based on predictive model signals, automating complex decision-making processes that previously required human oversight.
These forecasting strategies incorporate multiple data streams: on-chain metrics, derivative positioning, institutional fund flows, and macroeconomic indicators. The convergence of regulatory progress, technological advancement, and stablecoin adoption creates a more predictable market environment for model-based trading. Sophisticated investors recognize that understanding how these variables interact allows them to anticipate market movements with greater precision, positioning themselves strategically within 2026's evolving cryptocurrency landscape.
FAQ
What are the main factors that drive cryptocurrency price volatility?
Cryptocurrency price volatility is primarily driven by supply and demand dynamics, regulatory uncertainty across different jurisdictions, market sentiment shifts, and lower trading volumes in smaller cryptocurrencies, which experience sharper price swings compared to established coins like Bitcoin and Ethereum.
How do macroeconomic events and regulatory changes affect crypto markets?
Macroeconomic events like interest rate changes and inflation directly impact crypto prices by affecting investor risk appetite. Regulatory announcements can boost or suppress market confidence and adoption rates, creating significant price volatility and trading volume fluctuations.
What technical and fundamental analysis tools can help predict cryptocurrency price movements?
Technical analysis uses charts, moving averages, and RSI indicators to identify price trends. Fundamental analysis examines blockchain metrics, adoption rates, and market conditions. Combined, they help traders understand cryptocurrency price behavior and market dynamics.
How reliable are cryptocurrency price prediction models for 2026?
Cryptocurrency price prediction models for 2026 offer limited reliability. While AI can identify trend directions and sentiment signals, no model can predict exact prices due to market volatility, news shocks, and unpredictable events. Use prediction tools for directional insights only, not precise price targets.
What role do market sentiment and social media play in crypto price swings?
Market sentiment and social media are pivotal in driving crypto price swings. Influential posts, trending topics, and major announcements trigger rapid market reactions. Positive sentiment fuels price increases, while negative sentiment accelerates declines, often creating volatile swings independent of fundamental value.
How can investors protect their portfolios from cryptocurrency market volatility?
Diversify across multiple cryptocurrencies and asset classes. Use dollar-cost averaging to reduce timing risk. Set stop-loss orders and maintain a balanced portfolio allocation. Consider stablecoins for portfolio stability during market swings.
FAQ
What is IP coin? What are its main functions and uses?
IP coin is the native cryptocurrency of Story Protocol, enabling on-chain transactions, security, and governance. It empowers creators to leverage blockchain technology and smart contracts for intellectual property management and monetization.
How to buy and trade IP coin? Where can I purchase it?
You can purchase IP coin through major cryptocurrency exchanges that support it. Simply create an account, complete verification, deposit funds, and trade IP coin against USDT or other trading pairs. Check the exchange's spot market for IP coin availability and current trading volume.
What are the risks of IP coin? Is investing in IP coin safe?
IP coin investment involves market volatility and regulatory risks. Safety depends on your market understanding and risk management. Ensure compliance with local regulations and conduct thorough research before investing.
What is the total supply of IP coin? How is the tokenomics designed?
IP coin has a total supply of 1 billion tokens. The tokenomics allocates 58.4% to community ecosystem, with an initial unlock ratio of 25%. Distribution includes foundation allocation, early investor stakes, and contributor incentives structured for long-term ecosystem growth.
What are the advantages and differences of IP coin compared with other cryptocurrencies?
IP coin focuses on decentralized intellectual property management and trading infrastructure. It features strong capital backing, innovative technology in the IP tokenization sector, growing ecosystem with increasing dApp adoption, and strategic partnerships driving AIGC IP rights protection. Its unique positioning in knowledge property management distinguishes it from general-purpose cryptocurrencies.
IP coin的团队背景和项目进展如何?
IP coin's team features prominent industry leaders including Jason Zhao. The project transforms intellectual property into globally transferable blockchain assets, empowering creators and maximizing IP economic value. Recent progress includes significant blockchain integration milestones and ecosystem expansion.
How to safely store and manage IP coin?
Store IP coin in secure offline wallets or hardware wallets. Use cold storage solutions and keep private keys written on paper in a safe location. Never share private keys or store them digitally on cloud services or email.
What is the future development prospect and roadmap of IP coin?
IP coin, native token of Story Protocol, focuses on decentralized IP management with roadmap including GitHub for IP platform development, ecosystem expansion, and increased adoption. Price expected to appreciate as utility grows and mainstream integration accelerates.
Share
Content
Historical Price Trends and Support/Resistance Levels: Analyzing Cyclical Volatility Patterns in 2026
Volatility Drivers and Market Correlation: Understanding BTC/ETH Dependencies and 40%+ Price Swings
Predictive Models for Cryptocurrency Market Movements: Forecasting Strategies for 2026 Trading
FAQ
FAQ
Trending Cryptocurrencies


How does macroeconomic policy impact crypto prices: Fed rates, inflation data, and traditional market correlation

New York Fed's $6.8B Liquidity Boost Through Treasury Bills and Its Impact on Crypto Markets
How Does Federal Reserve Policy Impact Cryptocurrency Prices and Market Volatility

What Drives Cryptocurrency Price Volatility: Historical Trends, Support Levels, and BTC/ETH Correlation Analysis

What Drives Cryptocurrency Price Volatility: Support Levels, Resistance Levels, and Bitcoin-Ethereum Correlation Analysis
What Causes Crypto Price Volatility and How Does It Affect Bitcoin and Ethereum?

What is ENSO? New Infrastructure for Web3 and Smart Contract Automation

Michael Saylor: The Path to Leadership in the Cryptocurrency Sphere

What is a Bitcoin hardware wallet
Introduction to Phantom Wallet and How to Use It

What is LYP: A Comprehensive Guide to Understanding Lymphocyte Yield Protocol in Modern Medical Testing