OBI vs GRT: A Battle of Blockchain Protocols Shaping the Future of Decentralized Finance
Introduction: OBI vs GRT Investment Comparison
In the cryptocurrency market, the comparison between Orbofi (OBI) vs The Graph (GRT) has been an unavoidable topic for investors. The two not only show significant differences in market cap ranking, application scenarios, and price performance, but also represent different positions in crypto assets.
Orbofi (OBI): Since its launch in 2023, it has gained market recognition for its multimodal and tradable AI agent factory and launchpad.
The Graph (GRT): Introduced in 2020, it has been hailed as the "Google of blockchains" and is one of the leading indexing protocols for querying networks like Ethereum and IPFS.
This article will comprehensively analyze the investment value comparison between OBI and GRT, focusing on historical price trends, supply mechanisms, institutional adoption, technical ecosystems, and future predictions, attempting to answer the question investors care about most:
"Which is the better buy right now?"
I. Price History Comparison and Current Market Status
OBI and GRT Historical Price Trends
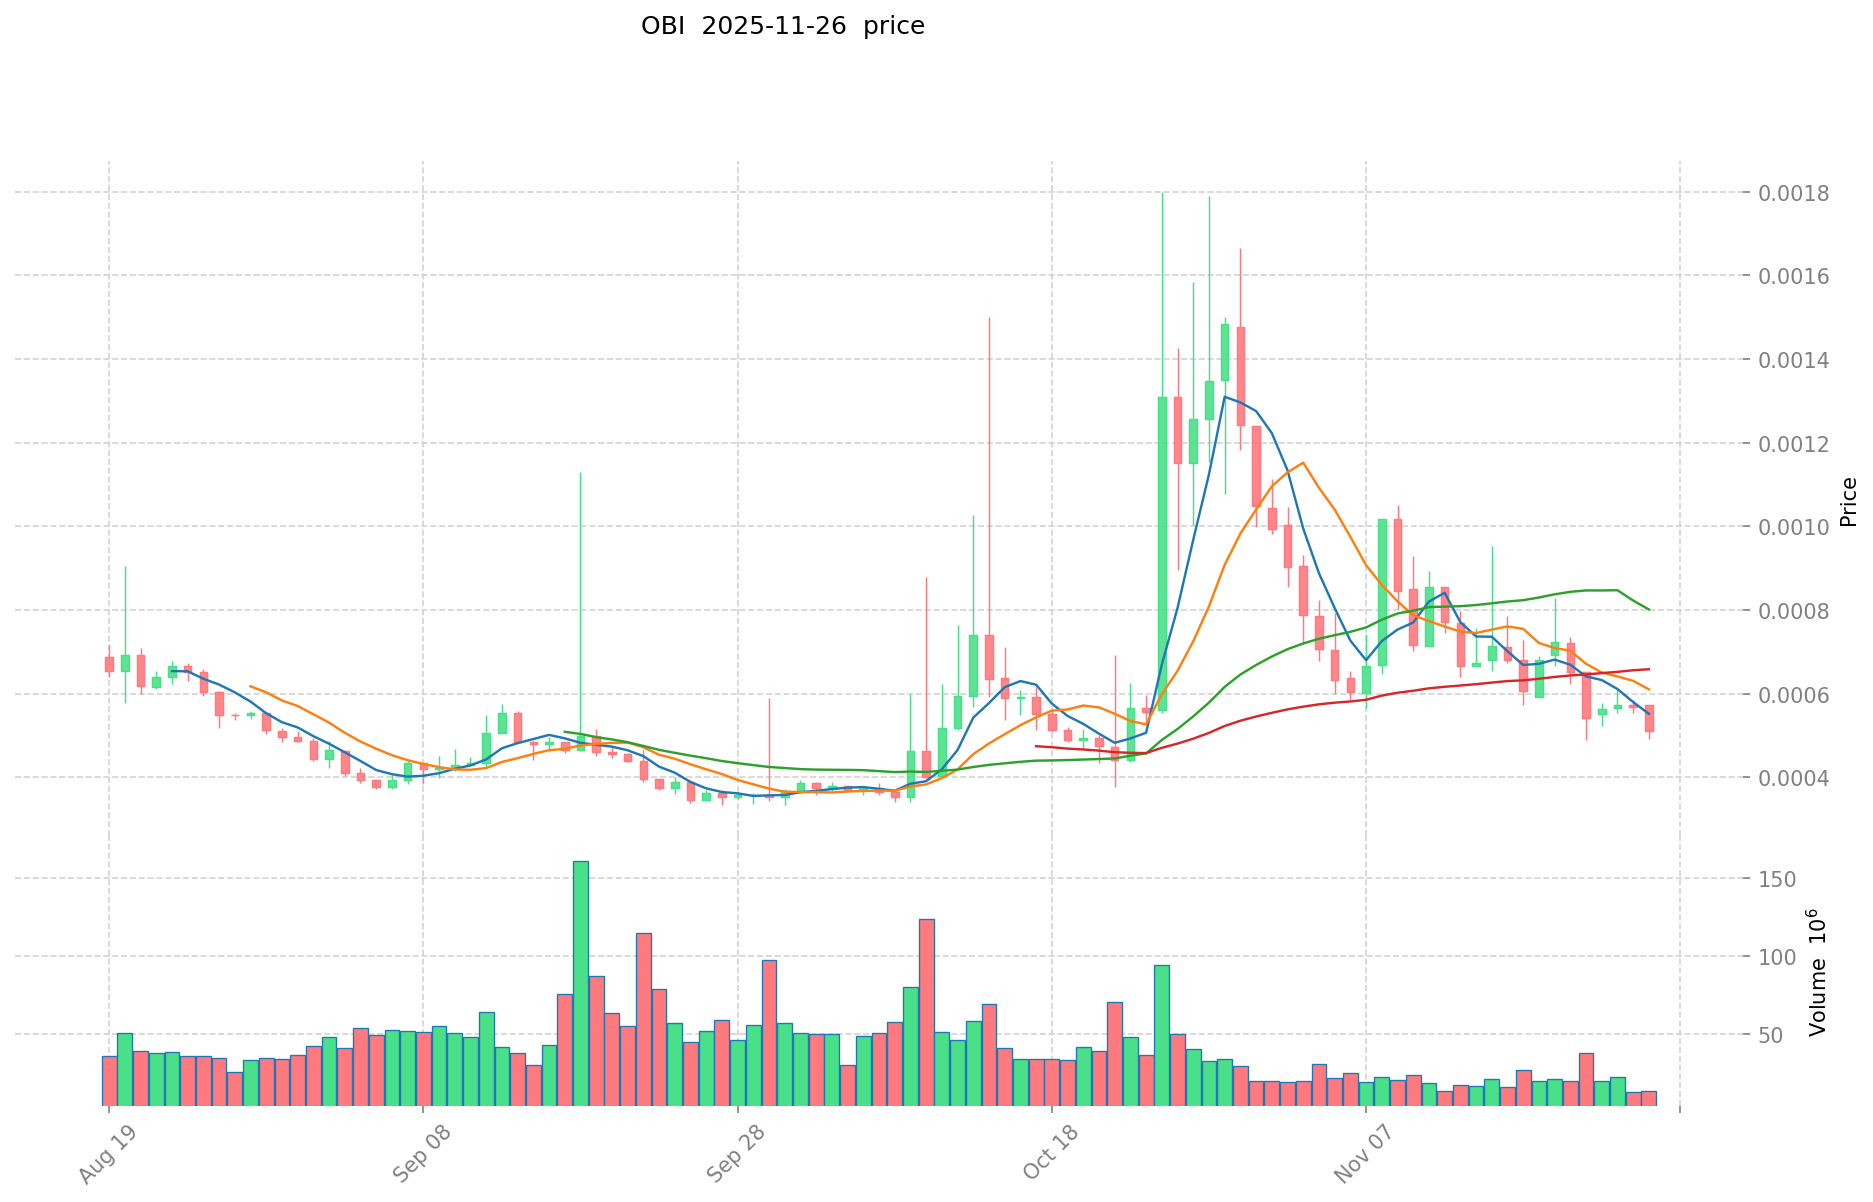
- 2023: OBI launched with an initial price of $0.008, experiencing significant volatility in its early trading period.
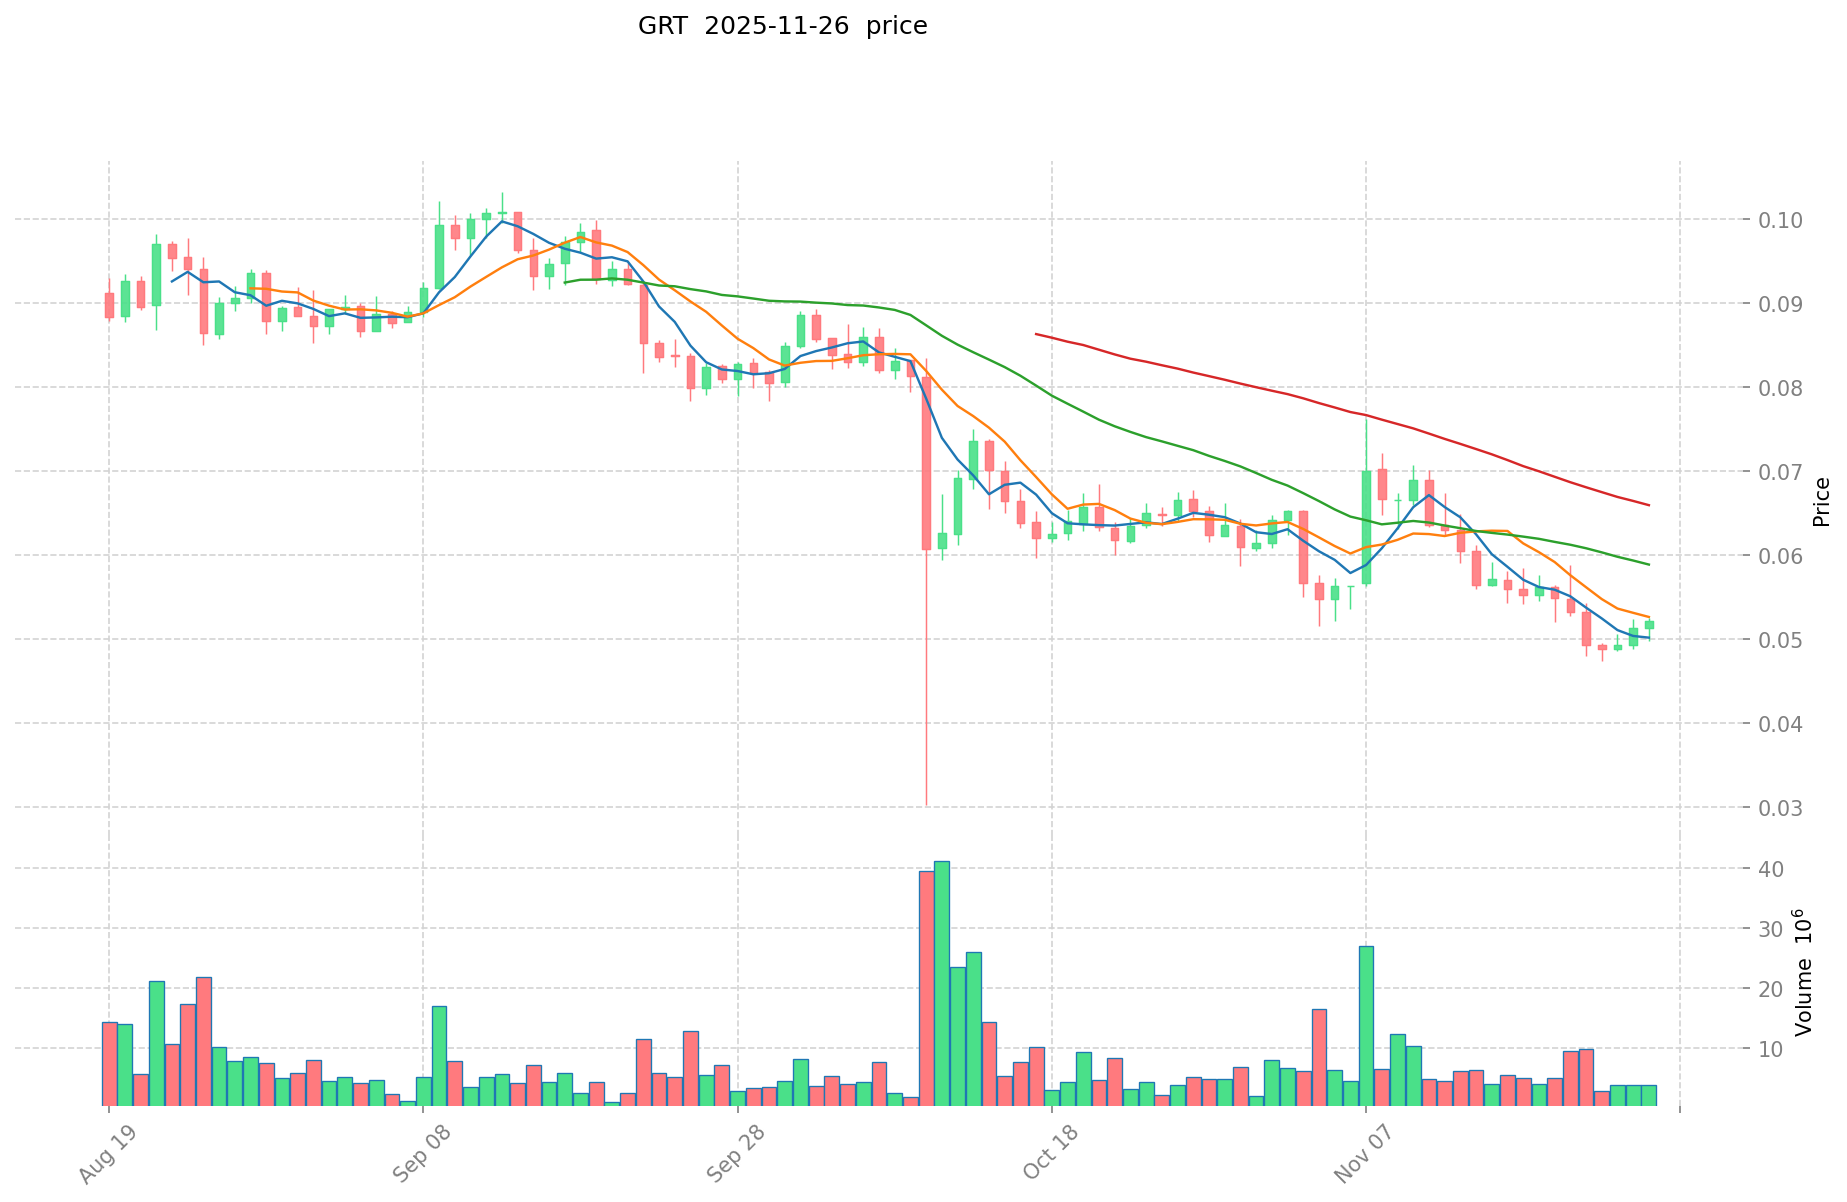
- 2021: GRT reached its all-time high of $2.84 on February 12, 2021, during the broader cryptocurrency bull market.
- Comparative Analysis: Since their respective peaks, OBI has declined from $0.08 to $0.0005178, while GRT has fallen from $2.84 to $0.05117, both reflecting the overall market downturn.
Current Market Situation (2025-11-26)
- OBI current price: $0.0005178
- GRT current price: $0.05117
- 24-hour trading volume: OBI $10,934.89 vs GRT $205,764.18
- Market Sentiment Index (Fear & Greed Index): 20 (Extreme Fear)
Click to view real-time prices:
- View OBI current price Market Price
- View GRT current price Market Price
II. Core Factors Affecting OBI vs GRT Investment Value
Supply Mechanisms Comparison (Tokenomics)
- OBI: Fixed supply model with a maximum cap of 10 billion tokens
- GRT: Inflationary model with 3% annual issuance rate, with burning mechanisms to offset inflation
- 📌 Historical Pattern: Fixed supply models like OBI's typically create stronger scarcity value over time, while GRT's model with burning mechanisms aims to balance network growth with value preservation.
Institutional Adoption and Market Applications
- Institutional Holdings: GRT has more established institutional backing with investors like Coinbase Ventures, Digital Currency Group, and MultiCoin Capital
- Enterprise Adoption: GRT has wider enterprise adoption with over 35,000+ subgraphs deployed and integration with major Web3 projects; OBI is newer with fewer documented enterprise implementations
- National Policies: Both projects face similar regulatory considerations as utility tokens in the decentralized data space
Technical Development and Ecosystem Building
- OBI Technical Upgrades: Recently launched zkHolistic architecture with homomorphic encryption for enhanced data privacy and security
- GRT Technical Development: Established query infrastructure with recent improvements to subgraph composition and updates to the Graph Node
- Ecosystem Comparison: GRT has a more mature ecosystem with thousands of developers and dApps using The Graph's indexing services; OBI's ecosystem is growing but at an earlier stage of development
Macroeconomic Factors and Market Cycles
- Performance in Inflationary Environment: GRT with its larger market cap has demonstrated more resilience during market downturns
- Macroeconomic Monetary Policy: Both tokens show correlation with broader crypto market reactions to Federal Reserve decisions
- Geopolitical Factors: Growing demand for decentralized data infrastructure benefits both projects as privacy concerns and data sovereignty issues increase globally
III. 2025-2030 Price Prediction: OBI vs GRT
Short-term Forecast (2025)
- OBI: Conservative $0.000419418 - $0.0005178 | Optimistic $0.0005178 - $0.000740454
- GRT: Conservative $0.03834 - $0.05112 | Optimistic $0.05112 - $0.0725904
Mid-term Forecast (2027)
- OBI may enter a growth phase, with estimated prices ranging from $0.0004670638848 to $0.0008100639252
- GRT may enter a bullish market, with estimated prices ranging from $0.06468816816 to $0.0885611826
- Key drivers: Institutional capital inflow, ETF, ecosystem development
Long-term Forecast (2030)
- OBI: Base scenario $0.000748019313823 - $0.000971453654315 | Optimistic scenario $0.000971453654315 - $0.001156029848635
- GRT: Base scenario $0.095661405993562 - $0.10995563907306 | Optimistic scenario $0.10995563907306 - $0.153937894702284
Disclaimer
OBI:
| 年份 | 预测最高价 | 预测平均价格 | 预测最低价 | 涨跌幅 |
|---|---|---|---|---|
| 2025 | 0.000740454 | 0.0005178 | 0.000419418 | 0 |
| 2026 | 0.00083044764 | 0.000629127 | 0.00059137938 | 21 |
| 2027 | 0.0008100639252 | 0.00072978732 | 0.0004670638848 | 40 |
| 2028 | 0.000816121159956 | 0.0007699256226 | 0.000492752398464 | 48 |
| 2029 | 0.001149883917353 | 0.000793023391278 | 0.000697860584324 | 53 |
| 2030 | 0.001156029848635 | 0.000971453654315 | 0.000748019313823 | 87 |
GRT:
| 年份 | 预测最高价 | 预测平均价格 | 预测最低价 | 涨跌幅 |
|---|---|---|---|---|
| 2025 | 0.0725904 | 0.05112 | 0.03834 | 0 |
| 2026 | 0.092164248 | 0.0618552 | 0.054432576 | 20 |
| 2027 | 0.0885611826 | 0.077009724 | 0.06468816816 | 50 |
| 2028 | 0.106793234757 | 0.0827854533 | 0.052154835579 | 61 |
| 2029 | 0.12512193411762 | 0.0947893440285 | 0.0758314752228 | 85 |
| 2030 | 0.153937894702284 | 0.10995563907306 | 0.095661405993562 | 114 |
IV. Investment Strategy Comparison: OBI vs GRT
Long-term vs Short-term Investment Strategies
- OBI: Suitable for investors focused on AI and multimodal technology potential
- GRT: Suitable for investors seeking established decentralized data infrastructure exposure
Risk Management and Asset Allocation
- Conservative investors: OBI: 10% vs GRT: 90%
- Aggressive investors: OBI: 30% vs GRT: 70%
- Hedging tools: Stablecoin allocation, options, cross-currency portfolios
V. Potential Risk Comparison
Market Risk
- OBI: Higher volatility due to smaller market cap and newer project status
- GRT: Susceptible to broader crypto market trends and competition in the indexing space
Technical Risk
- OBI: Scalability challenges, network stability concerns as the platform grows
- GRT: Query performance issues, potential vulnerabilities in subgraph deployment
Regulatory Risk
- Global regulatory policies may impact both tokens, with GRT potentially facing more scrutiny due to its wider adoption
VI. Conclusion: Which Is the Better Buy?
📌 Investment Value Summary:
- OBI advantages: Innovative AI agent factory, potential for high growth in emerging tech sector
- GRT advantages: Established ecosystem, wider adoption, proven track record in blockchain indexing
✅ Investment Advice:
- Novice investors: Consider a small allocation to GRT as part of a diversified crypto portfolio
- Experienced investors: Explore a balanced approach with both OBI and GRT, adjusting based on risk tolerance
- Institutional investors: Focus on GRT for its established market position, while monitoring OBI for potential long-term growth opportunities
⚠️ Risk Warning: The cryptocurrency market is highly volatile. This article does not constitute investment advice. None
VII. FAQ
Q1: What are the main differences between OBI and GRT? A: OBI is a newer project focused on AI agent factory and launchpad, while GRT is an established indexing protocol for querying blockchain networks. OBI has a fixed supply of 10 billion tokens, whereas GRT has an inflationary model with a 3% annual issuance rate. GRT has wider enterprise adoption and a more mature ecosystem, while OBI is still in earlier stages of development.
Q2: Which token has performed better historically? A: GRT has a longer price history and reached an all-time high of $2.84 in February 2021. OBI, launched in 2023, has experienced significant volatility in its early trading period. Both tokens have declined from their peaks, reflecting the overall market downturn.
Q3: What are the key factors affecting the investment value of OBI and GRT? A: Key factors include supply mechanisms, institutional adoption, technical development, ecosystem building, and macroeconomic factors. GRT has more established institutional backing and wider enterprise adoption, while OBI offers potential in the emerging AI technology sector.
Q4: How do the price predictions for OBI and GRT compare for 2030? A: For 2030, OBI's base scenario predicts a range of $0.000748019313823 - $0.000971453654315, with an optimistic scenario of $0.000971453654315 - $0.001156029848635. GRT's base scenario for 2030 is $0.095661405993562 - $0.10995563907306, with an optimistic scenario of $0.10995563907306 - $0.153937894702284.
Q5: What are the recommended investment strategies for OBI and GRT? A: For conservative investors, a suggested allocation is 10% OBI and 90% GRT. For aggressive investors, the recommendation is 30% OBI and 70% GRT. OBI may be suitable for investors focused on AI potential, while GRT is appropriate for those seeking exposure to established decentralized data infrastructure.
Q6: What are the main risks associated with investing in OBI and GRT? A: Risks include market volatility, technical challenges, and regulatory uncertainties. OBI may face higher volatility due to its smaller market cap and newer status. GRT is susceptible to broader crypto market trends and competition in the indexing space. Both tokens may be impacted by global regulatory policies.
Q7: Which token is considered the better buy? A: The better buy depends on an investor's risk tolerance and investment goals. GRT may be more suitable for novice investors due to its established ecosystem and wider adoption. Experienced investors might consider a balanced approach with both tokens. Institutional investors may focus on GRT while monitoring OBI for long-term growth potential.
Share
Content
Introduction: OBI vs GRT Investment Comparison
I. Price History Comparison and Current Market Status
II. Core Factors Affecting OBI vs GRT Investment Value
III. 2025-2030 Price Prediction: OBI vs GRT
IV. Investment Strategy Comparison: OBI vs GRT
V. Potential Risk Comparison
VI. Conclusion: Which Is the Better Buy?
VII. FAQ

