Is DeGods (DEGOD) a good investment?: A Comprehensive Analysis of Price Trends, Risk Factors, and Future Outlook for NFT Token Investors


Introduction: DeGods (DEGOD) Investment Position and Market Prospects
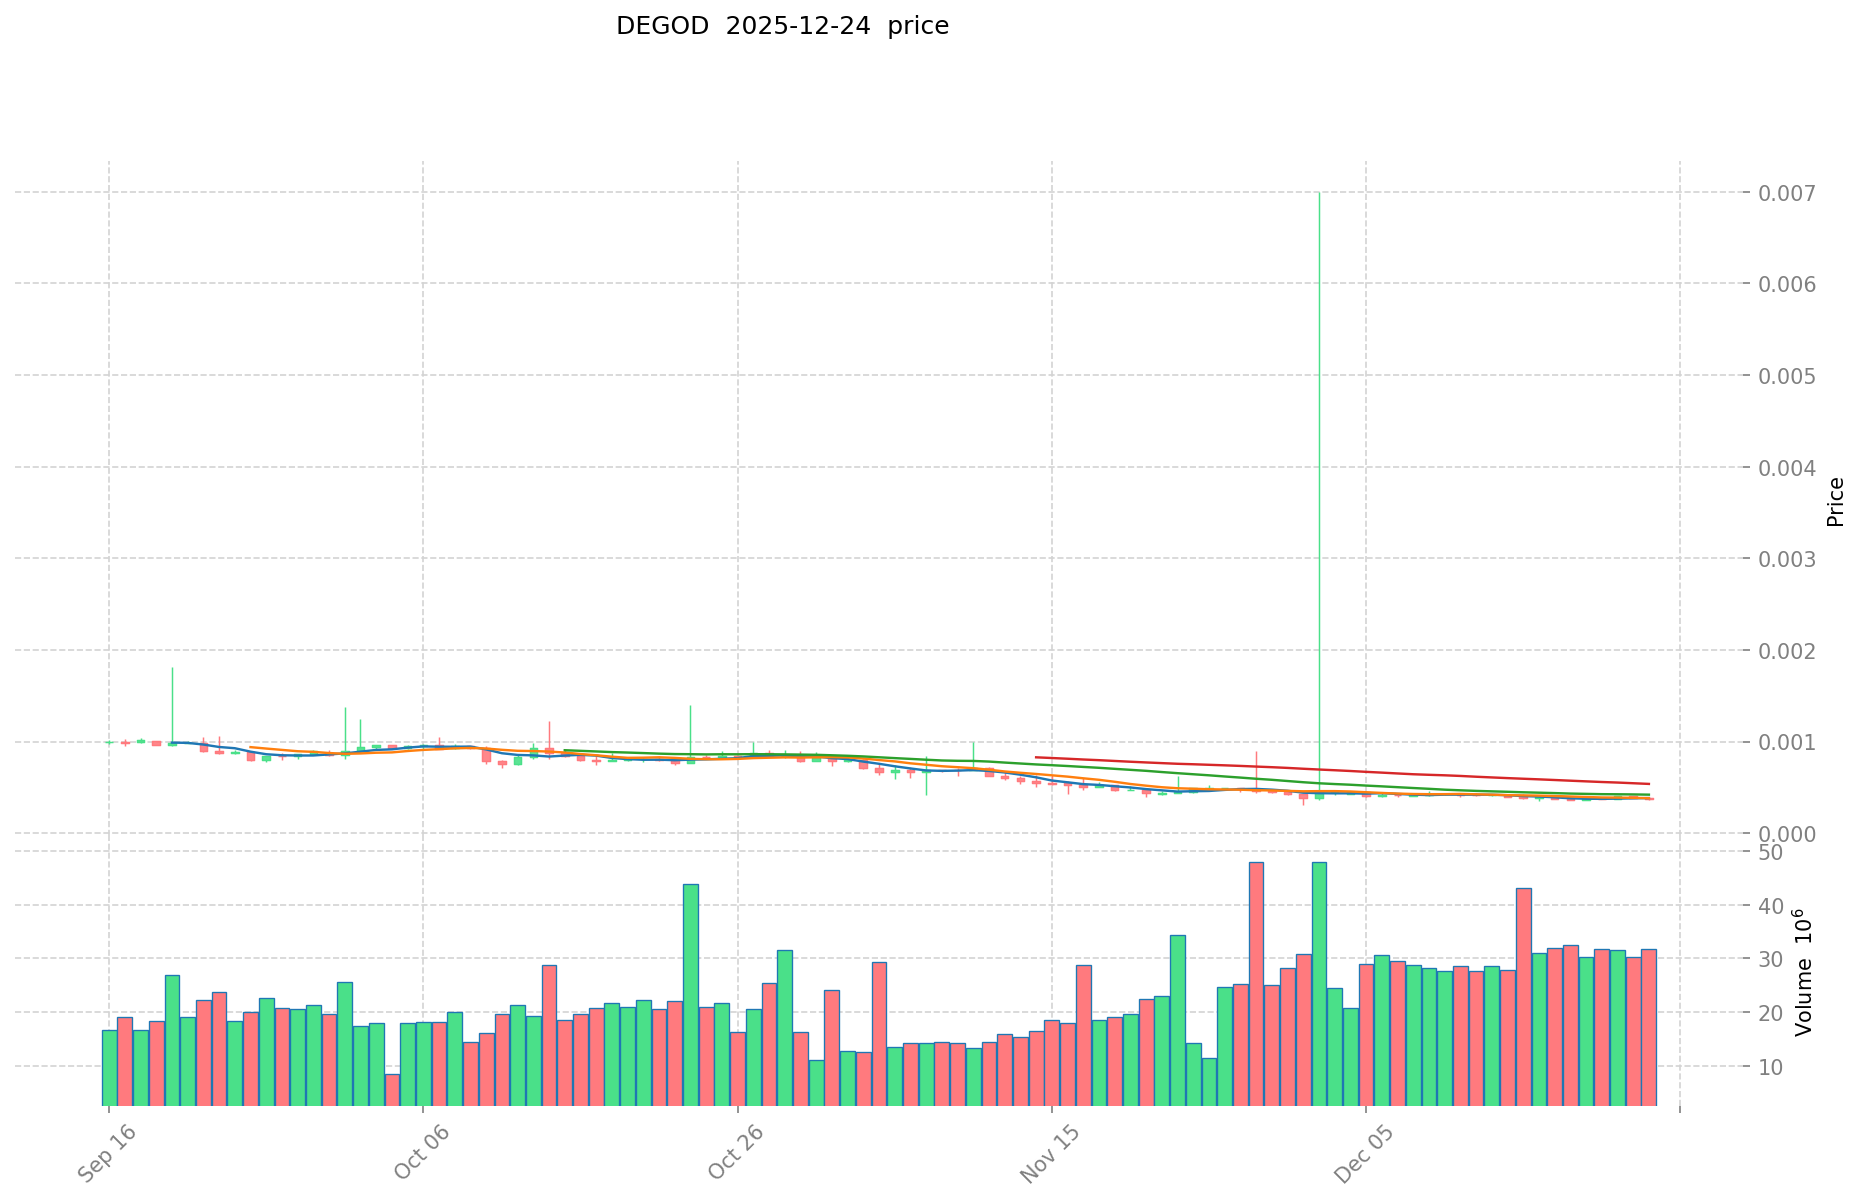
DEGOD is a community-focused cryptocurrency asset built on the Solana blockchain. Positioned as "a community coin for bros on the internet," DEGOD has attracted growing attention in the crypto market. As of December 24, 2025, the token maintains a market capitalization of approximately $3,768,000 with a circulating supply of 9,999,999,922 tokens out of a total supply of 10,000,000,000. The current price stands at $0.0003768.
Since its launch in September 2024, DEGOD has experienced significant price volatility. The token reached its all-time high of $0.08 on July 7, 2025, but has since faced considerable downward pressure, declining 89.44% over the past year. This dramatic price movement reflects both the speculative nature of community-driven tokens and broader market dynamics affecting the crypto sector. With approximately 29,639 token holders and trading activity on multiple exchanges, DEGOD represents an emerging micro-cap digital asset that warrants careful analysis.
This report provides a comprehensive examination of DEGOD's investment merit, historical price performance, forward-looking price forecasts, and associated risks. The analysis aims to equip investors with relevant data points when evaluating whether DEGOD aligns with their investment objectives and risk tolerance.
DeGods (DEGOD) Research Report
I. DEGOD Price History Review and Current Investment Value
DEGOD Historical Price Performance
All-Time High (ATH): USD 0.08 (July 7, 2025)
All-Time Low (ATL): USD 0.0003035 (December 1, 2025)
Price Decline from ATH to ATL: Approximately 99.62% decline, representing a significant value depreciation over the project's relatively short trading history.
Current DEGOD Market Status (December 24, 2025)
- Current Price: USD 0.0003768
- 24-Hour Change: -3.13% (down by USD 0.000012174914834314)
- 24-Hour Price Range: High of USD 0.0003892, Low of USD 0.0003647
- 1-Hour Change: +0.19%
- 7-Day Change: -3.30%
- 30-Day Change: -16.91%
- 1-Year Change: -89.44%
Market Metrics
- Total Market Capitalization: USD 3,768,000.00
- Fully Diluted Valuation (FDV): USD 3,768,000.00
- Market Cap to FDV Ratio: 100% (indicating all tokens are in circulation)
- 24-Hour Trading Volume: USD 12,059.90
- Circulating Supply: 9,999,999,922 tokens (99.99999922% of total supply)
- Total Supply: 10,000,000,000 tokens
- Max Supply: 10,000,000,000 tokens
- Market Dominance: 0.00011%
- Market Ranking: 1,714
Holder Distribution
- Number of Holders: 29,639
- Exchange Listings: 2 exchanges
Project Information
- Network: Solana
- Project Description: "A community coin for bros on the internet."
- Contract Address (Solana): degod39zqQWzpG6h4b7SJLLTCFE6FeZnZD8BwHBFxaN
Official Channels
- Website: https://degods.com/
- Twitter/X: @degodsnft
- Solana Explorer: https://explorer.solana.com/account/degod39zqQWzpG6h4b7SJLLTCFE6FeZnZD8BwHBFxaN
- Whitepaper: Available on project documentation
Disclaimer: This report presents factual market data as of December 24, 2025, based on available information. Investors should conduct thorough due diligence and consult with financial advisors before making any investment decisions. Cryptocurrency markets are highly volatile and speculative.
DeGods (DEGOD) Investment Analysis Report
Report Date: December 24, 2025
I. Executive Summary
DeGods (DEGOD) is a community token operating on the Solana blockchain, designed as "a community coin for bros on the internet." As of December 24, 2025, DEGOD is ranked 1,714th in the cryptocurrency market with a price of $0.0003768 and a total market capitalization of approximately $3.77 million. The token has experienced significant volatility, with a 1-year decline of 89.44% from its all-time high of $0.08 recorded on July 7, 2025.
II. Core Factors Influencing DEGOD Investment Quality
Supply Mechanism and Scarcity (DEGOD Investment Scarcity)
The DEGOD token operates with a fixed maximum supply of 10 billion tokens, with 9,999,999,922 tokens currently in circulation, representing 99.99999922% circulation ratio. This near-complete circulation indicates minimal deflationary tokenomics from new supply issuance.
However, the deflationary mechanism is linked to the underlying DeGods NFT ecosystem. The DeGods NFTs themselves are deflationary, as users can burn these NFTs, which theoretically supports long-term value growth through scarcity reduction. This deflationary property of the NFT collection may indirectly provide support for the token's value proposition.
Investment Significance: The fixed supply structure and the relationship to deflationary NFTs represent a core value mechanism, though the token's utility remains primarily community-oriented rather than driven by fundamental use cases.
Market Performance and Price Trends
The DEGOD token demonstrates notable volatility across different time horizons:
| Time Period | Price Change |
|---|---|
| 1 Hour | +0.19% |
| 24 Hours | -3.13% |
| 7 Days | -3.30% |
| 30 Days | -16.91% |
| 1 Year | -89.44% |
24-Hour Trading Activity: Volume in the last 24 hours was $12,059.90, indicating relatively modest trading liquidity. The primary trading venue for DEGOD/SOL pair is Raydium.
Historical Price Range:
- All-Time High: $0.08 (July 7, 2025)
- All-Time Low: $0.0003035 (December 1, 2025)
- Current Price vs. ATH: 99.53% decline
Community and Holder Base
The DEGOD ecosystem maintains an active holder community with 29,639 addresses currently holding the token. The community-centric positioning emphasizes engagement and passion among holders, though quantitative metrics on community size growth or engagement levels are not detailed in available data.
Institutional Investment and Mainstream Adoption
Available data does not provide explicit information regarding institutional investment levels, major corporate adoption, or endorsements from recognized institutions. The token trades on limited exchanges (indicated by "exchange_num": 2), suggesting constrained accessibility compared to major cryptocurrencies.
III. Market Sentiment and Analyst Forecasts
Conflicting Price Predictions for 2025
Market analysts present divergent outlooks for DEGOD:
-
Bearish Perspective: Multiple technical quantitative indicators suggest a bearish forecast for 2025, indicating potential continued downward pressure.
-
Bullish Perspective: Analysis based on historical crypto bull market patterns suggests a high likelihood of bull market conditions for DEGOD in 2025, citing the project's strong team as a supporting factor.
This contradiction reflects the speculative nature of DEGOD as a community token with limited fundamental use cases and significant market uncertainty.
IV. Risk Factors and Considerations
Extreme Price Volatility
The 89.44% decline over 12 months and 99.53% depreciation from all-time high represent extreme volatility typical of speculative community tokens. This level of volatility poses significant investment risk.
Limited Liquidity and Exchange Access
With only 2 exchange listings and modest 24-hour trading volumes, DEGOD exhibits liquidity constraints that may hinder entry and exit opportunities for investors.
Regulatory and Sustainability Questions
The referenced analysis comparing NFT projects to Ponzi scheme dynamics raises structural sustainability questions for community-driven projects like DeGods, though specific regulatory developments are not detailed in current data.
Leadership Transitions
Historical reports indicate CEO leadership changes within the DeGods organization, introducing organizational uncertainty that may impact project direction and investor confidence.
V. Conclusion
DEGOD presents a high-risk, speculative investment profile suitable only for risk-tolerant investors. The token's value proposition rests primarily on community engagement and NFT ecosystem integration rather than established utility or institutional adoption. The extreme historical price decline, limited liquidity, conflicting analyst forecasts, and organizational changes create a complex risk-reward dynamic. Potential investors should conduct thorough independent research and consider their risk tolerance before allocation decisions.
Data Sources: Gate, CoinCodex, CoinLore, CoinGecko, Solana Explorer
Last Updated: December 24, 2025
III. DeGods (DEGOD) Future Investment Predictions and Price Outlook
Short-term Investment Prediction (2026, short-term DEGOD investment outlook)
- Conservative prediction: $0.000221 - $0.000408
- Neutral prediction: $0.000408 - $0.000478
- Optimistic prediction: $0.000478 - $0.000550
Mid-term Investment Outlook (2027-2028, mid-term DeGods (DEGOD) investment forecast)
- Market phase expectation: Gradual recovery phase with consolidation patterns emerging across 2027-2028 period
- Investment return predictions:
- 2027: $0.000408 - $0.000586
- 2028: $0.000309 - $0.000597
- Key catalysts: Community engagement expansion, ecosystem development initiatives, potential trading volume increases on decentralized exchanges
Long-term Investment Outlook (Is DEGOD a good long-term investment?)
- Base scenario: $0.000482 - $0.000806 USD (Assuming steady community growth and moderate market recovery)
- Optimistic scenario: $0.000822 USD and above (Assuming significant institutional adoption and favorable macro conditions)
- Risk scenario: $0.000253 USD or below (Extreme market downturns and loss of community momentum)
Click to view DEGOD long-term investment and price predictions: Price Prediction
2025-12-24 to 2030 Long-term Outlook
- Base scenario: $0.000482 - $0.000689 USD (Corresponding to stable growth and gradual ecosystem expansion)
- Optimistic scenario: $0.000689 - $0.000822 USD (Corresponding to mainstream adoption acceleration and favorable market environment)
- Transformative scenario: $0.000822 USD and above (Such as breakthrough ecosystem progress and widespread community adoption)
- 2030-12-31 predicted high: $0.000806 USD (Based on optimistic development assumptions)
Disclaimer: This analysis is provided for informational purposes only and should not be construed as investment advice. Cryptocurrency markets are highly volatile and speculative. Past performance does not guarantee future results. Investors should conduct their own due diligence before making any investment decisions.
| 年份 | 预测最高价 | 预测平均价格 | 预测最低价 | 涨跌幅 |
|---|---|---|---|---|
| 2025 | 0.000440856 | 0.0003768 | 0.000252456 | 0 |
| 2026 | 0.00047832876 | 0.000408828 | 0.00022076712 | 8 |
| 2027 | 0.0005855234616 | 0.00044357838 | 0.0004080921096 | 17 |
| 2028 | 0.000596879068128 | 0.0005145509208 | 0.00030873055248 | 36 |
| 2029 | 0.000822458191806 | 0.000555714994464 | 0.00053904354463 | 47 |
| 2030 | 0.000806231313968 | 0.000689086593135 | 0.000482360615194 | 82 |
DeGods (DEGOD) Investment Analysis Report
I. Project Overview
Basic Information
Project Name: DeGods
Token Symbol: DEGOD
Blockchain: Solana
Contract Address: degod39zqQWzpG6h4b7SJLLTCFE6FeZnZD8BwHBFxaN
Project Description: A community coin for bros on the internet.
Market Position
- Current Price: $0.0003768
- Market Capitalization: $3,768,000
- Fully Diluted Valuation: $3,768,000
- Market Ranking: 1,714
- Market Dominance: 0.00011%
- Total Holders: 29,639
II. Token Economics
Supply Structure
- Total Supply: 10,000,000,000 DEGOD
- Circulating Supply: 9,999,999,922 DEGOD (99.99999922%)
- Maximum Supply: 10,000,000,000 DEGOD
- Circulation Ratio: 99.99999922%
Price History
- All-Time High: $0.08 (July 7, 2025)
- All-Time Low: $0.0003035 (December 1, 2025)
- 24H High: $0.0003892
- 24H Low: $0.0003647
- Initial Launch Price: $0.00672
III. Market Performance Analysis
Price Trends
| Time Period | Price Change | Change Amount |
|---|---|---|
| 1 Hour | +0.19% | +$0.000000714562 |
| 24 Hours | -3.13% | -$0.000012174915 |
| 7 Days | -3.30% | -$0.000012858738 |
| 30 Days | -16.91% | -$0.000076684174 |
| 1 Year | -89.44% | -$0.003191381818 |
Trading Activity
- 24H Trading Volume: $12,059.90
- Listed Exchanges: 2
- Market Emotion Index: 0 (Neutral)
IV. Investment Strategy and Risk Management
Investment Methodology
Long-term Holding (HODL DEGOD): Suitable for conservative investors seeking exposure to community-driven Solana tokens with established project infrastructure and social engagement.
Active Trading: Requires careful monitoring of the limited trading volume and execution of technical analysis strategies during the specific 24-hour trading windows.
Risk Management Considerations
Asset Allocation Guidance:
- Conservative investors: Minimal allocation (less than 1% of crypto portfolio)
- Aggressive investors: Limited to micro-cap allocation strategies
- Institutional investors: Not recommended for large-scale institutional positions
Portfolio Diversification: Given the extreme volatility and low liquidity, DEGOD should represent only a small portion of any diversified cryptocurrency portfolio.
Security Considerations: For holders maintaining positions, Solana ecosystem wallets (e.g., Phantom, Solflare) with hardware wallet backup options are recommended for secure asset management.
V. Investment Risks and Challenges
Market Risks
- Extreme Volatility: 89.44% decline over one year from initial launch price ($0.00672 to current $0.0003768) demonstrates severe price instability
- Low Liquidity: 24-hour trading volume of only $12,059.90 creates significant execution risk for larger positions
- Micro-cap Status: Small market capitalization ($3.7M) susceptible to substantial price swings from relatively modest capital flows
Regulatory Risks
- Solana-based tokens face evolving regulatory frameworks across different jurisdictions
- Community-driven projects may face increased scrutiny regarding token utility and classification
Technical and Operational Risks
- Dependence on Solana network infrastructure and stability
- Limited project documentation and development updates available
- Community token model sustainability questions
VI. Conclusion: Is DEGOD a Good Investment?
Investment Value Assessment
DeGods presents as a speculative micro-cap community token with established social engagement (29,639 holders) but demonstrates concerning long-term performance metrics. The 89.44% annual decline and ultra-low liquidity characteristics indicate this asset class carries substantial risk unsuitable for most investors.
Investor Recommendations
✅ Retail Investors: Only consider minimal allocations ($100-500 maximum) as part of experimental portfolio diversification, with full expectation of potential total loss.
✅ Experienced Traders: Wave-trading strategies may be viable during identified technical breakout patterns, maintaining strict stop-loss discipline given execution challenges.
✅ Institutional Investors: Not recommended for institutional portfolio allocation due to liquidity constraints and regulatory uncertainty.
Project Resources
- Website: https://degods.com/
- Whitepaper: https://decorp.notion.site/degod-1015d2e4c18480bd8501f4834f354ece
- Twitter: x.com/degodsnft
- Solana Explorer: https://explorer.solana.com/account/degod39zqQWzpG6h4b7SJLLTCFE6FeZnZD8BwHBFxaN
⚠️ Disclaimer: Cryptocurrency investments carry substantial risk, including potential total loss of capital. This analysis is provided for informational purposes only and does not constitute investment advice. Investors should conduct independent research and consult qualified financial advisors before making investment decisions.
DeGods (DEGOD) Frequently Asked Questions
FAQ
Q1: What is DeGods (DEGOD) and what is its primary use case?
A: DeGods (DEGOD) is a community-focused cryptocurrency token built on the Solana blockchain, designed as "a community coin for bros on the internet." The token serves primarily as a community engagement asset rather than possessing traditional utility functions. DEGOD is interconnected with the DeGods NFT ecosystem, where NFTs can be burned to support deflationary mechanisms. As of December 24, 2025, DEGOD maintains a market capitalization of approximately $3.77 million with a circulating supply of 9,999,999,922 tokens out of a total supply of 10 billion.
Q2: What has been DEGOD's historical price performance and current market status?
A: DEGOD experienced extreme price volatility since its September 2024 launch. The token reached an all-time high of $0.08 on July 7, 2025, but subsequently declined 99.53% to its current price of $0.0003768 (as of December 24, 2025). Over the past 12 months, DEGOD declined 89.44% from its initial launch price. Current market metrics show 24-hour trading volume of $12,059.90 with only 2 exchange listings and approximately 29,639 token holders, indicating limited liquidity and narrow market accessibility.
Q3: Is DEGOD a suitable investment for conservative investors?
A: DEGOD is not recommended for conservative investors. The token exhibits extreme volatility, minimal liquidity, and speculative characteristics typical of micro-cap community tokens. Conservative investors should maintain minimal allocations if any (less than 1% of crypto portfolio), with full expectation of potential total loss. The 89.44% annual decline and ultra-low trading volume create significant execution risks and price slippage challenges. Investors requiring capital preservation or stable returns should avoid this asset class entirely.
Q4: What price forecasts exist for DEGOD through 2030?
A: Price predictions vary significantly depending on market scenarios. Short-term forecasts (2026) suggest a range of $0.000221 to $0.000550. Mid-term outlooks (2027-2028) project $0.000408 to $0.000597. Long-term base scenarios (2030) estimate $0.000482 to $0.000689, while optimistic scenarios project $0.000689 to $0.000822. These predictions assume steady community growth, gradual market recovery, and expanded ecosystem development. However, prediction accuracy remains uncertain given the speculative nature of community tokens and volatile crypto market conditions.
Q5: What are the primary risk factors associated with DEGOD investment?
A: Key risks include extreme price volatility (89.44% annual decline), critically low liquidity with only $12,059.90 in 24-hour trading volume, micro-cap status ($3.77M market cap) susceptible to substantial price swings, limited exchange listings constraining accessibility, regulatory uncertainty surrounding community tokens, and operational risks related to project sustainability. The token's value proposition depends primarily on community engagement rather than established utility or institutional adoption, creating additional vulnerability during market downturns.
Q6: How should DEGOD be managed within a cryptocurrency portfolio?
A: DEGOD should represent only a minimal allocation within diversified crypto portfolios, if included at all. Conservative allocations should not exceed 1% of total crypto holdings. Active traders may employ wave-trading strategies during identified technical patterns with strict stop-loss discipline. For secure asset management, Solana ecosystem wallets such as Phantom or Solflare with hardware wallet backup are recommended. Portfolio diversification across established cryptocurrencies, stablecoins, and other blockchain assets is essential to mitigate DEGOD-specific risks. Institutional investors should generally avoid DEGOD positions due to liquidity constraints and regulatory uncertainty.
Q7: What distinguishes DEGOD from other Solana-based tokens?
A: DEGOD's primary distinction is its explicit community-first positioning and integration with the DeGods NFT ecosystem. The token's deflationary mechanism operates indirectly through burnable NFTs rather than traditional token burning. With 29,639 holders and active social engagement, DEGOD demonstrates established community infrastructure. However, this community focus does not translate to superior investment characteristics—the token lacks institutional adoption, substantial use cases, or significant trading infrastructure compared to established Solana tokens. DEGOD's ranking at 1,714 in global cryptocurrency market capitalization reflects its niche status within the broader crypto ecosystem.
Q8: What are the recommended security and storage practices for DEGOD holdings?
A: DEGOD token holders should employ non-custodial Solana-compatible wallets such as Phantom, Solflare, or other hardware wallet-compatible options. For significant holdings, hardware wallets with Solana support provide enhanced security against exchange hacks or smart contract vulnerabilities. Users should verify contract address accuracy (degod39zqQWzpG6h4b7SJLLTCFE6FeZnZD8BwHBFxaN on Solana Explorer) before conducting transactions. Enable two-factor authentication on any exchange accounts used for DEGOD trading. Maintain backup seed phrases in secure, offline storage locations. Never share private keys or seed phrases with third parties. Given DEGOD's low liquidity, withdrawals to personal wallets minimize counterparty risk compared to extended exchange holdings.
Disclaimer: This FAQ provides informational content as of December 24, 2025, and does not constitute investment advice. Cryptocurrency markets are highly volatile and speculative. Investors should conduct independent due diligence and consult qualified financial advisors before making investment decisions. Past performance does not guarantee future results.
Share
Content
Introduction: DeGods (DEGOD) Investment Position and Market Prospects
I. DEGOD Price History Review and Current Investment Value
I. Executive Summary
II. Core Factors Influencing DEGOD Investment Quality
III. Market Sentiment and Analyst Forecasts
IV. Risk Factors and Considerations
V. Conclusion
III. DeGods (DEGOD) Future Investment Predictions and Price Outlook
I. Project Overview
II. Token Economics
III. Market Performance Analysis
IV. Investment Strategy and Risk Management
V. Investment Risks and Challenges
VI. Conclusion: Is DEGOD a Good Investment?
FAQ
How to Buy Cryptocurrency


Trending Cryptocurrencies


What Factors Are Driving the Current Price Volatility in the Crypto Market?
2025 TNSR Price Prediction: Expert Analysis and Market Forecast for Tensor's Future Value
Is Tensor (TNSR) a good investment?: A comprehensive analysis of opportunities and risks in the emerging AI infrastructure market

How to convert SOL to USD: Real-time Solana price calculator

2025 PENGUPrice Prediction: Analyzing Market Trends and Potential Growth Factors for the Digital Asset

2025 RAYPrice Prediction: Analyzing Growth Factors and Market Potential for RAY Token in the Coming Years

How does Federal Reserve policy impact ZEC price in 2026: macroeconomic factors and S&P 500 correlation
How to Use MACD, RSI, and KDJ Indicators to Trade Zcash (ZEC) at $540.90?
Who Is Satoshi Nakamoto? The Mysterious Creator of Bitcoin Turns 50

How does macroeconomic policy affect SAPIEN crypto price in 2026

What is driving USELESS coin's 17.12% price surge and where are key support resistance levels in 2026?