Is CHEQD NETWORK (CHEQ) a good investment?: A Comprehensive Analysis of Tokenomics, Use Cases, and Market Potential in the Decentralized Identity Sector


Introduction: Investment Position and Market Prospects of CHEQD NETWORK (CHEQ)
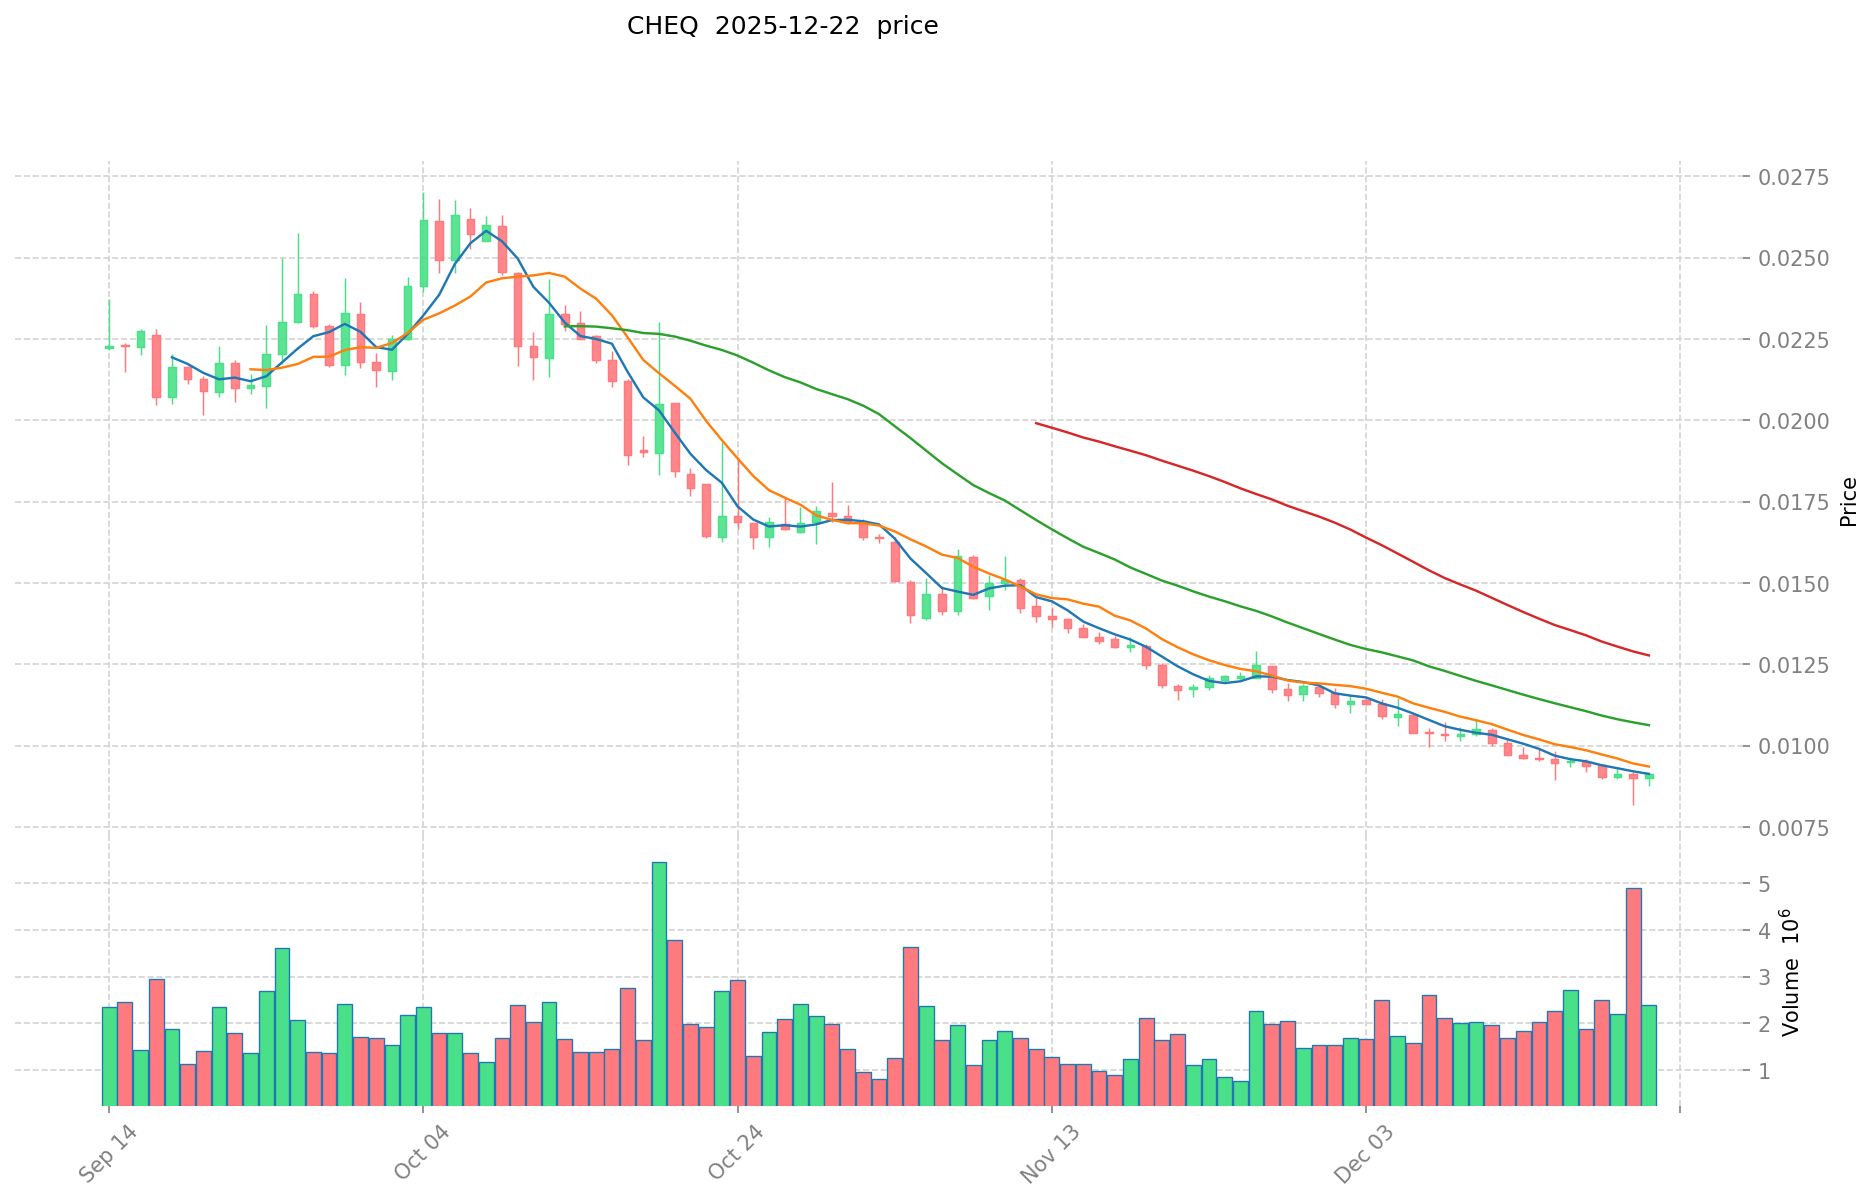
CHEQ is an important asset in the cryptocurrency field, dedicated to building a "real data economy." As of December 22, 2025, CHEQ has a market capitalization of USD 9,129,000, with a circulating supply of approximately 967,499,027 tokens. The current price stands at USD 0.009129. Leveraging its positioning as a Layer 1 network for verifiable credentials and decentralized identity, CHEQ has gradually become a focal point when investors discuss "Is CHEQD NETWORK (CHEQ) a good investment?" The project enables a new business model where verifiable credentials are exchanged in a trusted, reusable, secure, and cost-effective manner through customizable business models and governance structures built on a public permissionless network with dedicated payment tokenomics.
This article provides a comprehensive analysis of CHEQ's investment value, market performance, price trends, and investment risks to serve as a reference for investors.
CHEQD Network (CHEQ) Cryptocurrency Research Report
I. CHEQ Price History Review and Current Investment Market Status
CHEQ Historical Price Performance and Investment Returns
Key Historical Milestones:
- November 2021: Asset reached all-time high (ATH) of USD 0.71551 on November 26, 2021 → Peak valuation period
- December 2025: Asset declined to all-time low (ATL) of USD 0.00820217 on December 21, 2025 → Significant value depreciation over the period
Price Trajectory Summary:
- From ATH (USD 0.71551) to current price (USD 0.009129) represents a depreciation of approximately 98.75% from historical peak
- One-year performance: −83.78% decline
Current CHEQ Market Status (As of December 22, 2025)
Market Metrics:
- Current Price: USD 0.009129
- Market Capitalization: USD 9,129,000.00 (Fully Diluted Valuation)
- Circulating Market Cap: USD 8,832,298.62
- 24-Hour Trading Volume: USD 20,169.64
- Market Dominance: 0.00028%
- Market Ranking: 1,233rd by market capitalization
Price Movement Analysis:
| Time Period | Price Change | Change Amount |
|---|---|---|
| 1 Hour | −0.19% | −USD 0.000017 |
| 24 Hours | +2.21% | +USD 0.000197 |
| 7 Days | −6.37% | −USD 0.000621 |
| 30 Days | −21.77% | −USD 0.002540 |
| 1 Year | −83.78% | −USD 0.047153 |
24-Hour Price Range:
- High: USD 0.00917
- Low: USD 0.008771
Token Supply Information:
- Circulating Supply: 967,499,027 CHEQ (96.75% of total)
- Total Supply: 1,000,000,000 CHEQ
- Maximum Supply: 1,000,000,000 CHEQ
For real-time CHEQ market prices, visit Gate CHEQ Trading
II. Project Overview and Core Value Proposition
CHEQ Network Fundamentals
Project Mission: CHEQD Network is constructing a "real data economy" by adding authenticity, source verification, and verifiability to data exchange. The project enables a trust-based data marketplace where verifiable credentials can be exchanged in a secure, reusable, cost-effective, and trustworthy manner.
Technical Infrastructure:
- Built on Cosmos SDK as a dedicated Layer 1 blockchain network
- Features a custom payment token with pluggable tokenomics
- Supports customizable business models and governance structures through autonomous identity paradigms
Business Model Application: The network facilitates ecosystems (such as IATA Travelpass Airlines Group) to migrate their operations onto the network infrastructure and monetize their data trading activities through verifiable credential systems.
III. Current Market Performance and Exchange Information
Trading Information:
- Listed on 4 cryptocurrency exchanges
- Trading status: Active (Gate listed)
Community and Resources:
- Official Website: https://www.cheqd.io/
- Block Explorer: https://bigdipper.live/
- GitHub Repository: https://github.com/cheqd
- Twitter: https://twitter.com/cheqd_io
IV. Risk Considerations
Key Risk Factors:
-
Significant Value Depreciation: Asset has declined 98.75% from its historical peak, indicating substantial loss of investor value since November 2021.
-
Low Market Liquidity: 24-hour trading volume of approximately USD 20,169 is relatively low, which may impact price stability and trading execution.
-
Market Capitalization: With a market cap under USD 10 million, CHEQ remains a micro-cap asset with associated volatility risks.
-
Negative Long-Term Performance: One-year decline of 83.78% indicates persistent downward price pressure and potential market skepticism regarding project fundamentals.
This report is provided for informational purposes only and should not be construed as investment advice or a recommendation to purchase, sell, or hold any asset.
Report Generated: December 22, 2025
Data Source: Gate Market Data
Disclaimer: All market data and metrics are accurate as of the report generation date. Cryptocurrency markets are highly volatile and subject to rapid changes.
CHEQD NETWORK (CHEQ) Investment Analysis Report
Report Date: December 22, 2025
I. Executive Summary
CHEQD NETWORK (CHEQ) is a Layer 1 blockchain platform built on the Cosmos SDK, designed to establish a "real data economy" by enabling verifiable credentials and decentralized identity solutions. As of the report date, CHEQ is trading at $0.009129 with a market capitalization of approximately $8.83 million USD, ranked #1233 by market cap. The token has experienced significant depreciation over the past year, declining 83.78% from its previous levels.
II. Core Factors Influencing CHEQ Investment Viability
A. Supply Mechanism and Scarcity
- Total Supply: 1,000,000,000 CHEQ tokens (fixed maximum supply)
- Circulating Supply: 967,499,027 CHEQ tokens (96.75% of total supply)
- Circulation Ratio: The high circulation ratio (96.75%) indicates limited remaining token scarcity, as the majority of tokens are already in circulation
- Scarcity Impact: With most tokens already distributed, supply-side constraints are unlikely to provide significant upward pressure on valuation
B. Platform Utility and Business Model
- Core Use Case: Verifiable credentials exchange through customizable business models and governance structures
- Network Architecture: Public permissionless network with dedicated payment token mechanism
- Commercial Applications: Designed to support institutional ecosystems (referenced example: IATA travelpass and airline industry partnerships)
- Value Proposition: Enables monetization of data trading and identity authentication services within decentralized frameworks
C. Historical Price Performance
- All-Time High (ATH): $0.71551 (November 26, 2021)
- All-Time Low (ATL): $0.00820217 (December 21, 2025)
- 12-Month Performance: -83.78% decline
- Recent Volatility:
- 1-hour change: -0.19%
- 24-hour change: +2.21%
- 7-day change: -6.37%
- 30-day change: -21.77%
III. Market Sentiment and Technical Outlook
A. Price Prediction Consensus (2025)
Market forecasts for CHEQ demonstrate divergent scenarios:
| Forecast Type | Range |
|---|---|
| Conservative | $0.0084277 - $0.01187 |
| Neutral | $0.01187 - $0.013 |
| Optimistic | $0.013 - higher |
| Bullish outlier | $0.3919 - $0.5434 |
General Assessment: The majority of quantitative technical indicators suggest a bearish outlook for 2025, indicating prevailing market caution regarding near-term price appreciation.
B. Market Sentiment Indicator
Current market emotion is rated as slightly positive (neutral to mildly bullish), though this contrasts with the overall bearish technical consensus.
IV. On-Chain and Market Metrics
- 24-Hour Trading Volume: $20,169.64 USD
- 24-Hour High/Low: $0.00917 / $0.008771
- Market Dominance: 0.00028% of total cryptocurrency market capitalization
- Fully Diluted Valuation (FDV): $9,129,000 USD
- FDV-to-Market Cap Ratio: 96.75% (indicating limited gap between current and fully diluted valuations)
- Exchange Listings: 4 major exchanges
V. Ecosystem and Development Activity
- Official Website: https://www.cheqd.io/
- Active Development: GitHub repository active at https://github.com/cheqd
- Community Presence: Twitter account at https://twitter.com/cheqd_io
- Block Explorer: BigDipper blockchain explorer integration
VI. Risk Considerations
-
Severe Price Depreciation: The 83.78% annual decline reflects significant investor losses and potential lack of confidence in near-term prospects
-
Market Capitalization Concerns: Current market cap of $8.83 million is substantially diminished compared to historical valuations, suggesting reduced institutional interest
-
Limited Trading Volume: Daily volume of $20,169.64 indicates relatively low liquidity compared to market capitalization
-
Highly Distributed Token Supply: With 96.75% of tokens in circulation, potential for significant dilution events if remaining tokens are released
-
Competitive Landscape: Decentralized identity and verifiable credentials market includes numerous competing projects and protocols
VII. Conclusion
CHEQD NETWORK operates within the emerging decentralized identity sector with a functional blockchain platform and stated partnerships. However, current market data reflects significant headwinds:
- Technical indicators predominantly suggest bearish sentiment for 2025
- Severe historical price decline raises concerns about market confidence
- Limited market capitalization and trading volume indicate constrained liquidity
- High token circulation ratio limits supply-side catalysts
The investment case for CHEQ remains speculative, dependent on future ecosystem adoption, institutional partnerships, and broader market recovery in the identity authentication sector.
III. CHEQ Future Investment Predictions and Price Outlook (Is CHEQD NETWORK(CHEQ) worth investing in 2025-2030)
Short-term Investment Prediction (2025, short-term CHEQ investment outlook)
- Conservative forecast: $0.00566 - $0.00915
- Neutral forecast: $0.00915 - $0.01028
- Optimistic forecast: $0.01028 - $0.01160
Mid-term Investment Outlook (2026-2027, mid-term CHEQD NETWORK(CHEQ) investment forecast)
- Market stage expectations: Gradual recovery phase with incremental ecosystem development and adoption of verifiable credentials across identified use cases
- Investment return projections:
- 2026: $0.00601 - $0.01286 (projected appreciation of ~13%)
- 2027: $0.00767 - $0.01382 (projected appreciation of ~27%)
- Key catalysts: Expansion of trusted data economy infrastructure, enterprise adoption of identity verification solutions, integration with mainstream platforms similar to IATA travel pass initiatives
Long-term Investment Outlook (Is CHEQ a good long-term investment?)
- Base case: $0.01099 - $0.01667 USD (assuming steady ecosystem development and mainstream adoption of decentralized identity solutions through 2030)
- Optimistic case: $0.01498 - $0.01819 USD (assuming accelerated enterprise adoption and significant expansion of the verifiable credentials market)
- Risk scenario: $0.00566 - $0.00768 USD (assuming limited ecosystem traction and competitive pressures in identity verification space)
Click to view CHEQ long-term investment and price predictions: Price Prediction
2025-12-31 Long-term Outlook
- Base case: $0.00915 - $0.01160 USD (corresponding to steady growth in real data economy and gradual mainstream adoption)
- Optimistic case: $0.01160 - $0.01382 USD (corresponding to large-scale enterprise adoption and favorable market environment)
- Transformative case: $0.01819 USD and above (if ecosystem achieves breakthrough progress and mainstream proliferation of identity verification solutions)
- 2030-12-31 forecast high point: $0.01767 USD (based on optimistic development assumptions)
Disclaimer: This analysis is for informational purposes only and does not constitute investment advice. Cryptocurrency markets are highly volatile and speculative. Past performance does not guarantee future results. All price predictions involve substantial uncertainty and risk.
| 年份 | 预测最高价 | 预测平均价格 | 预测最低价 | 涨跌幅 |
|---|---|---|---|---|
| 2025 | 0.01160399 | 0.009137 | 0.00566494 | 0 |
| 2026 | 0.0128594138 | 0.010370495 | 0.0060148871 | 13 |
| 2027 | 0.013821795736 | 0.0116149544 | 0.007665869904 | 27 |
| 2028 | 0.01818727634724 | 0.012718375068 | 0.01131935381052 | 39 |
| 2029 | 0.016379995250077 | 0.01545282570762 | 0.014989240936391 | 69 |
| 2030 | 0.017667215631521 | 0.015916410478848 | 0.010982323230405 | 74 |
CHEQD NETWORK (CHEQ) Investment Analysis Report
Report Date: December 22, 2025
Current Price: $0.009129
Market Cap Rank: 1,233
I. Project Overview
Project Introduction
CHEQD NETWORK is building a "real data economy" by adding authenticity, source verification, and credibility to data exchanges. The project utilizes the Cosmos SDK to construct a dedicated Layer 1 network and token, enabling customizable business models and autonomous identity paradigms through pluggable tokenomics.
The platform's core solution supports new business models where verifiable credentials can be exchanged in a trusted, reusable, more secure, and cost-effective manner. By providing customizable commercial models and governance structures, CHEQD enables the creation of authentic data ecosystems, all built on a public permissionless network with a dedicated payment token.
Token Information
| Metric | Value |
|---|---|
| Token Symbol | CHEQ |
| Current Price | $0.009129 |
| Total Supply | 1,000,000,000 |
| Circulating Supply | 967,499,027 (96.75%) |
| Market Capitalization | $8,832,298.62 |
| Fully Diluted Valuation | $9,129,000.00 |
| Market Dominance | 0.00028% |
II. Market Performance Analysis
Price Dynamics
| Time Period | Price Change | Amount Change |
|---|---|---|
| 1 Hour | -0.19% | -$0.000017 |
| 24 Hours | +2.21% | +$0.000197 |
| 7 Days | -6.37% | -$0.000621 |
| 30 Days | -21.77% | -$0.002540 |
| 1 Year | -83.78% | -$0.047153 |
Historical Price Metrics
- All-Time High: $0.71551 (November 26, 2021)
- All-Time Low: $0.00820217 (December 21, 2025)
- 24-Hour High: $0.00917
- 24-Hour Low: $0.008771
- Decline from ATH: 98.72%
Trading Metrics
- 24-Hour Volume: $20,169.64
- Volume-to-Market Cap Ratio: 0.23%
- Listed Exchanges: 4
III. Market Sentiment & Risk Assessment
Current Market Sentiment
The token displays negative market sentiment with significant long-term depreciation. The 83.78% decline over the past year and recent all-time low price established on December 21, 2025, indicate sustained downward pressure. However, the modest 24-hour gain of 2.21% suggests minor short-term stabilization.
Key Observations
- Liquidity Concerns: Low trading volume relative to market cap indicates limited liquidity and potential challenges in position entry/exit
- Supply Dynamics: 96.75% of total supply is in circulation, indicating high token distribution
- Market Maturity: Ranking at 1,233 suggests CHEQD operates in a competitive mid-tier segment with limited mainstream adoption
IV. Investment Strategy and Risk Management
Investment Methodology
Long-Term Holdings (HODL CHEQ)
- Suitable for risk-tolerant investors believing in the "real data economy" thesis
- Requires conviction in verifiable credentials and data monetization adoption
- Best suited for those with long investment horizons (3-5+ years)
Active Trading
- Dependent on technical analysis and identifying support/resistance levels
- Limited viability due to low trading volume and liquidity constraints
- High slippage risk on larger positions
Risk Management Framework
Portfolio Allocation Guidance
- Conservative Investors: 0-1% of total portfolio maximum
- Aggressive Investors: 1-3% of speculative allocation
- Professional Investors: Tactical allocation with hedging strategies
Risk Mitigation Strategies
- Diversify across multiple blockchain infrastructure projects
- Maintain allocation size appropriate to risk tolerance given extreme volatility
- Consider dollar-cost averaging to reduce timing risk
Security Considerations
- Hot wallets: Use only for active trading amounts
- Cold Storage: Hardware wallets (Ledger, Trezor) recommended for long-term holdings
- Exchange Risk: Minimize funds held on centralized exchanges
V. Investment Risks and Challenges
Market Risks
- Extreme Volatility: 83.78% annual decline demonstrates severe price instability
- Liquidity Risk: Low trading volume ($20K daily) creates slippage and exit barriers
- Market Manipulation Risk: Small market cap susceptible to concentrated positions affecting price
Regulatory Risks
- Jurisdictional Uncertainty: Regulatory treatment of identity and credential verification tokens remains unclear across major markets
- Compliance Challenges: Data privacy regulations (GDPR, CCPA) may impact business model viability
- Policy Changes: Future restrictions on decentralized identity systems could adversely affect adoption
Technology Risks
- Network Security: As a Layer 1 blockchain, security vulnerabilities could impact ecosystem confidence
- Development Execution: Adoption dependent on successful integration with enterprise partners
- Competitive Pressure: Emergence of alternative identity and credential solutions poses displacement risk
Adoption and Commercial Risks
- Enterprise Adoption: Unproven ability to achieve commercial traction with institutions
- Network Effects: Success dependent on ecosystem growth and meaningful transaction volume
- Economic Viability: Customizable tokenomics model may not achieve sustainable economics
VI. Conclusion: Is CHEQD a Good Investment?
Investment Value Assessment
CHEQD NETWORK addresses a significant market need in verifiable credentials and data authenticity, operating within an emerging blockchain infrastructure category. However, the project faces substantial challenges:
Positive Factors:
- Addresses real market problem in data verification
- Cosmos-based architecture provides technical flexibility
- Public permissionless network model aligns with decentralization principles
Negative Factors:
- 98.72% decline from all-time high indicates severe execution or market fit challenges
- Extremely low liquidity constrains practical investment feasibility
- Market rank (1,233) reflects limited adoption and recognition
- Extended bear market with no clear recovery signals
Investment Recommendations
⚠️ For New Investors: Not recommended for portfolio allocation. If exploring, limit exposure to <0.5% of speculative allocation using dollar-cost averaging over extended periods. Mandatory use of secure cold storage.
⚠️ For Experienced Investors: Consider only as high-risk speculative position with clear technical catalysts or adoption announcements. Implement strict position sizing (1-3% max) and defined exit strategies.
⚠️ For Institutional Investors: Research-stage allocation only. Requires due diligence on adoption roadmap, partnership progress, and competitive differentiation before meaningful position consideration.
Disclaimer
⚠️ Important Notice: Cryptocurrency investments carry substantial risk including potential total loss of capital. CHEQD's extreme volatility and historical price decline represent heightened risk factors. This analysis is provided for informational purposes only and does not constitute investment advice, financial recommendation, or endorsement. Conduct independent research and consult qualified financial advisors before making investment decisions. Past performance does not guarantee future results.
Report Generated: December 22, 2025
Data Source: Market data as of 10:21:18 UTC
CHEQD NETWORK (CHEQ) Frequently Asked Questions
FAQ
Q1: What is CHEQD NETWORK and what problem does it solve?
A: CHEQD NETWORK is a Layer 1 blockchain built on the Cosmos SDK designed to establish a "real data economy" by enabling verifiable credentials and decentralized identity solutions. It solves the problem of data authenticity and source verification by allowing verifiable credentials to be exchanged in a trusted, secure, reusable, and cost-effective manner through customizable business models and governance structures on a public permissionless network.
Q2: What is the current price and market performance of CHEQ as of December 22, 2025?
A: As of December 22, 2025, CHEQ is trading at USD 0.009129 with a market capitalization of approximately USD 8,832,298.62. The token has experienced significant depreciation, declining 98.72% from its all-time high of USD 0.71551 (November 26, 2021) and 83.78% over the past year. The current market rank is 1,233 by capitalization.
Q3: What are the token supply details and distribution status?
A: CHEQ has a fixed maximum supply of 1,000,000,000 tokens. The circulating supply is 967,499,027 CHEQ (96.75% of total supply), indicating that most tokens are already in circulation. The high circulation ratio limits remaining scarcity and reduces supply-side catalysts for price appreciation.
Q4: Is CHEQD a good investment for 2025-2030?
A: CHEQD remains a speculative investment with mixed signals. Price forecasts for 2025 range from USD 0.00566 to USD 0.01160 (conservative to optimistic scenarios). Long-term outlooks (2030) project potential prices between USD 0.00768 to USD 0.01819 USD under various scenarios. However, the project faces significant challenges including extreme historical volatility, low trading liquidity, and unproven enterprise adoption. Investment suitability depends entirely on individual risk tolerance and conviction in the verifiable credentials market thesis.
Q5: What are the primary risk factors associated with CHEQ investment?
A: Key risks include: (1) severe historical depreciation indicating execution or market fit challenges; (2) extremely low trading volume (USD 20,169.64 daily) creating liquidity and exit barriers; (3) micro-cap status (under USD 10 million) with associated volatility; (4) regulatory uncertainty surrounding decentralized identity systems; (5) unproven ability to achieve meaningful enterprise adoption; and (6) competitive pressure from alternative identity verification solutions.
Q6: How does CHEQD's trading liquidity compare to other cryptocurrencies?
A: CHEQD exhibits concerning liquidity metrics with 24-hour trading volume of approximately USD 20,169.64 and a volume-to-market cap ratio of only 0.23%. This limited liquidity creates significant challenges for investors, including potential slippage on market orders, difficulty executing larger positions without moving price, and barriers to entering or exiting positions. The low liquidity is particularly problematic given the micro-cap market capitalization of under USD 10 million.
Q7: What investment allocation strategy is recommended for CHEQD?
A: Recommended allocation guidelines are: Conservative investors should allocate 0-1% maximum of total portfolio; Aggressive investors should limit to 1-3% of speculative allocation only; Professional investors should employ tactical allocation with hedging strategies. For all investor types, CHEQD should be classified as high-risk speculative exposure with strict position sizing rules. Use of secure cold storage (hardware wallets) is mandatory for long-term holdings. Dollar-cost averaging over extended periods is recommended to reduce timing risk.
Q8: What are the future price predictions and catalysts for CHEQD?
A: Price predictions by 2030 range from USD 0.00768 (risk scenario) to USD 0.01819 (optimistic case), suggesting limited upside potential relative to risk. Key catalysts for potential recovery include: expansion of verifiable credentials adoption in enterprise ecosystems, successful integration with mainstream platforms similar to IATA travel pass initiatives, enterprise adoption breakthroughs, and broader market recovery in the decentralized identity sector. However, technical indicators predominantly suggest bearish sentiment, and realization of these catalysts remains unproven.
Disclaimer: This FAQ is provided for informational purposes only and does not constitute investment advice, financial recommendation, or endorsement. Cryptocurrency markets are highly volatile and speculative. Conduct independent research and consult qualified financial advisors before making investment decisions. Past performance does not guarantee future results. All information is accurate as of December 22, 2025.
Share
How to Buy Cryptocurrency


Trending Cryptocurrencies


HOT vs ATOM: Comparing Performance and Features of Two Popular Text Editors

NRN vs ATOM: Comparing Two Cutting-Edge Neural Network Architectures for Natural Language Processing

Is Agoric (BLD) a good investment?: Analyzing the potential and risks of this blockchain platform

Is Agoric (BLD) a good investment?: A comprehensive analysis of tokenomics, market potential, and risk factors for 2024

Hedera (HBAR) 2025 Price Analysis and Investment Prospects

Sei Network 2025 Development Status and Investment Opportunity Analysis
Pi Network Price Prediction 2024, 2025, 2030, 2040, 2050

2025 RUNI Price Prediction: Expert Analysis and Market Forecast for the Coming Year

2025 FTR Price Prediction: Expert Analysis and Market Forecast for Fractal's Native Token
Satoshi-Era Bitcoin Address Moves $1 Billion of BTC After 14 Years

2025 MIDNIGHT Price Prediction: Expert Analysis and Market Outlook for the Next Generation Cryptocurrency Token