Here's a Summary of the Japanese Candlestick Trading Bible

What Are Japanese Candlesticks Made Of?
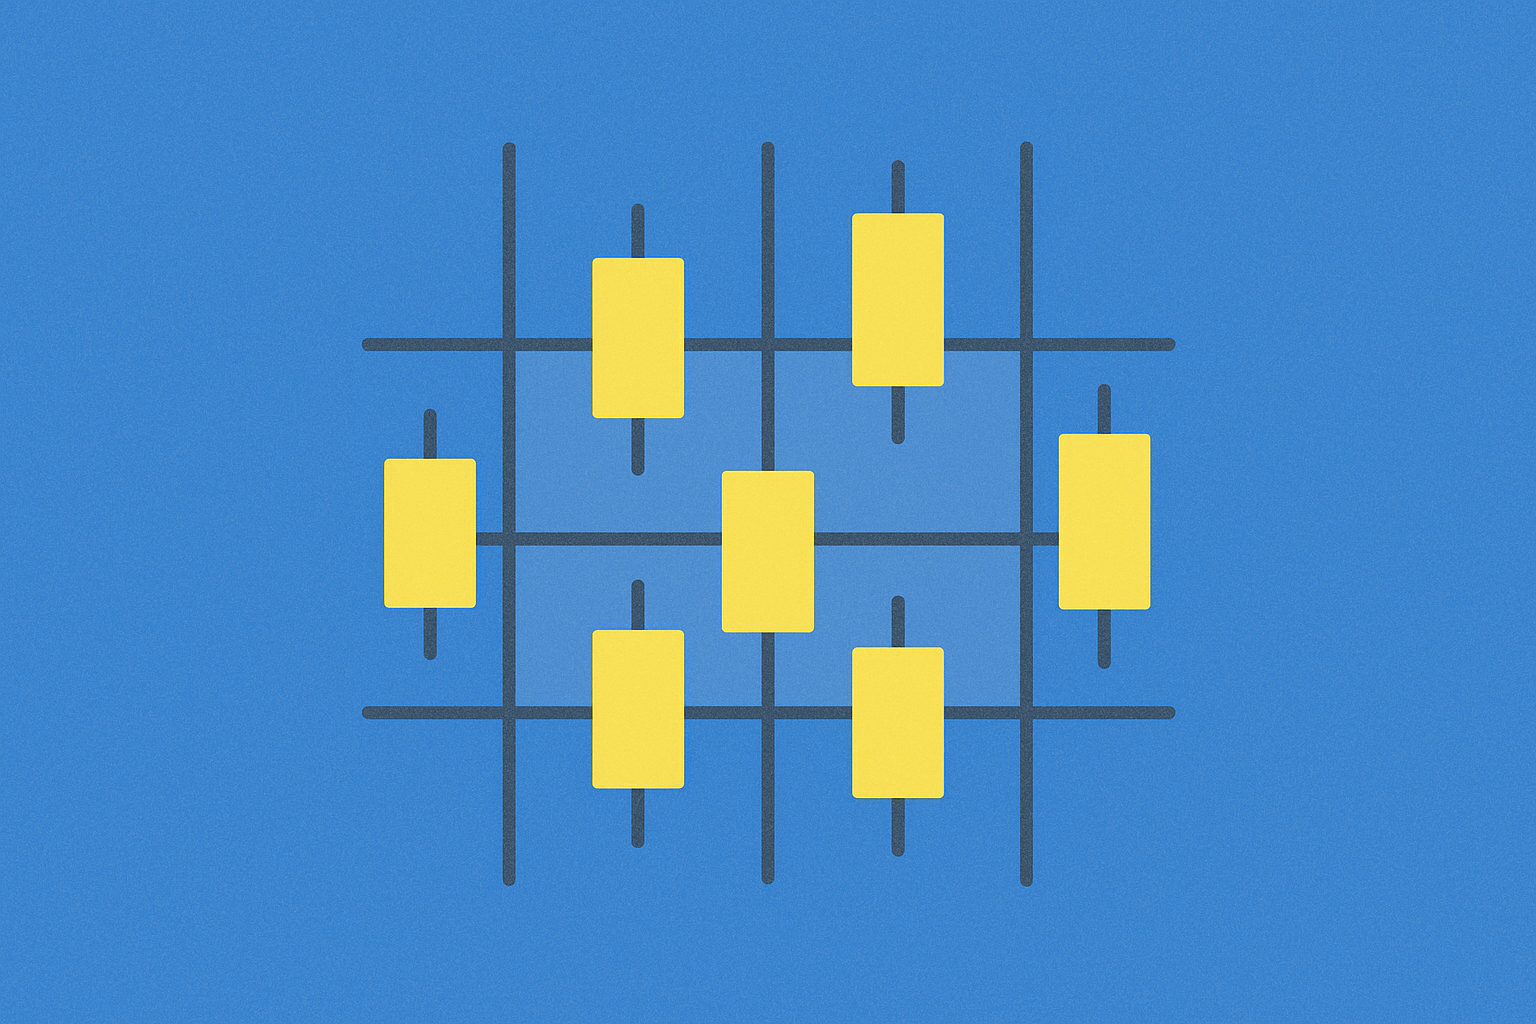
Japanese candlesticks are composed of two main components: the real body and the shadows (also called wicks). Understanding these structural elements is fundamental to interpreting candlestick patterns effectively in technical analysis.
Real Body
The real body is represented by a rectangle whose upper or lower border indicates the opening price, while the opposite border represents the closing price—the final price at which the asset traded during the period. The color of the real body conveys important information: a green (or white) body indicates that the closing price was higher than the opening price, reflecting bullish momentum, while a red (or black) body indicates that the closing price was lower than the opening price, reflecting bearish momentum. This color distinction provides traders with immediate visual feedback about the period's price direction.
Shadows (Wicks)
Shadows extend above and below the real body, representing the price extremes during the trading period:
-
Upper Shadow: A vertical line extending from the top of the real body to the highest price reached during the period. This shadow illustrates the maximum buying pressure and the resistance encountered.
-
Lower Shadow: A vertical line extending from the bottom of the real body to the lowest price reached during the period. This shadow demonstrates the maximum selling pressure and the support level tested.
Together, these components create a visual representation of the market's internal struggle between buyers and sellers.
How Do You Interpret Japanese Candlesticks After They Form?
Japanese candlesticks serve as a visual language for reading market dynamics, specifically the ongoing conflict between buyers (bulls) and sellers (bears). Each candlestick tells a story about who controlled the market during that specific period.
A long green candlestick indicates that buyers maintained control throughout most of the trading period, with the conflict concluding in a bullish victory. This pattern typically signals positive momentum and suggests potential upward price movement.
Conversely, a long red candlestick is evidence of seller dominance and represents a bearish victory. This pattern typically signals negative momentum and may suggest potential downward price movement.
The shadows and body proportions provide additional context about the intensity of this conflict and the potential for future price movements, making candlestick analysis a powerful tool for traders seeking to understand market sentiment.
Individual Japanese Candlestick Patterns
Individual candlestick patterns are formations composed of a single candle. These patterns provide immediate signals about market sentiment and potential price direction. Here are the primary individual candlestick patterns:
Long Green Candle
In a long green candlestick, the opening price is positioned near the lowest price, while the closing price is positioned near the highest price. This configuration demonstrates that buyers maintained control throughout the entire trading period, pushing prices higher from open to close. The emergence of this pattern is considered positive and often signals strong bullish momentum that may continue in subsequent periods.
Long Red Candle
The long red candlestick presents the inverse scenario: the opening price is positioned near the highest price, while the closing price is positioned near the lowest price. This indicates that sellers controlled the market throughout the trading period, successfully pushing prices lower. The appearance of this pattern is considered negative and typically suggests strong bearish momentum.
Short Candle
A short candlestick occurs when the opening price is very close to the closing price, regardless of whether the real body is green or red. This pattern indicates minimal price movement and reflects a lack of conviction from either buyers or sellers. The appearance of short candles suggests market indecision and has limited predictive significance on its own, though it may gain importance when appearing in specific contexts or sequences.
High Wave Candle
The high wave candlestick is characterized by a short real body combined with long upper and lower shadows. The opening and closing prices are close to each other, but the price tested both significantly higher and lower levels during the period. This pattern indicates strong volatility and internal conflict between buyers and sellers. In an upward trend, its appearance is somewhat negative, suggesting that buyers are losing conviction. Conversely, in a downward trend, its appearance is positive, suggesting that sellers are losing control.
Hammer Candle
The hammer candlestick features a small real body positioned at the top of the candle's range, with a long lower shadow and minimal or no upper shadow. This formation resembles a hammer tool, hence its name. The hammer pattern is particularly significant when it appears at the bottom of a downtrend, as it suggests that sellers initially pushed prices lower but buyers successfully defended those levels, creating a potential reversal signal. The long lower shadow demonstrates strong support and potential bullish reversal.
Shooting Star Candle
The shooting star is the inverse of the hammer pattern. It features a small real body positioned at the bottom of the candle's range, with a long upper shadow and minimal or no lower shadow. When the opening and closing prices are close together (whether green or red), this pattern becomes particularly meaningful. In an uptrend, the appearance of a shooting star is negative, suggesting potential weakness and possible reversal, as it indicates buyers could not sustain higher prices. Conversely, in a downtrend, its appearance is positive, indicating that sellers are losing momentum.
Doji Candle
The doji candlestick is formed when the opening price equals the closing price, resulting in virtually no real body. What distinguishes doji candles is the variation in their shadows. These shadows may be long, short, or absent entirely, and the specific configuration depends on the market's behavior during the period. The doji pattern represents equal strength between buyers and sellers, indicating market indecision. This pattern is particularly significant at turning points, as it suggests that neither side has gained control, often preceding significant price movements as the market prepares to break from equilibrium.
Composite Japanese Candlestick Patterns
Composite candlestick patterns consist of two or more consecutive candlesticks that together form recognizable formations. Unlike individual candlestick patterns, composite patterns provide stronger trading signals and additional confirmations due to their multi-candle structure. These patterns offer traders more reliable indicators of potential price direction and market sentiment shifts.
Composite patterns are particularly valuable in technical analysis because they demonstrate sustained market behavior over multiple periods, reducing the likelihood of false signals. Traders often wait for composite pattern confirmation before making trading decisions, as the additional candles provide validation of the initial signal. Common composite patterns include engulfing patterns, harami patterns, and other multi-candle formations that indicate strong bullish or bearish momentum.
Conclusion
Mastering Japanese candlestick patterns requires moving beyond memorizing pattern names to developing a genuine understanding of the underlying market dynamics. Each candlestick pattern represents the story of conflict between buyers and sellers, and the visual representation provides valuable insights into market sentiment and potential future price movements.
The key to effective candlestick analysis is recognizing that these patterns are not mere technical formations but rather visual expressions of market psychology. By understanding the principles behind each pattern's formation—the balance of power between bulls and bears, the levels of support and resistance tested, and the implications for future price action—traders can make more informed decisions.
When combined with other technical analysis tools and proper risk management strategies, Japanese candlestick patterns remain one of the most powerful and widely-used methods for analyzing financial markets and identifying trading opportunities.
FAQ
What is the main content of 'The Japanese Candlestick Trading Bible'?
This book explains candlestick chart technical analysis for predicting market trends and reflecting collective psychology. Candlestick patterns reveal buying and selling dynamics through price movements.
What is Japanese Candlestick (K-line), and what are its basic patterns and meanings?
Japanese candlesticks display daily open, close, high, and low prices. Key patterns include Morning Star signaling reversal, Hammer showing buying strength, Engulfing indicating trend changes, and Shooting Star suggesting price pullback potential in trading volumes.
How to use candlestick charts for stock or futures trading?
Candlestick charts display open, close, high, and low prices. Green candles indicate uptrends, red candles indicate downtrends. Identify patterns and trends to make buy or sell decisions. Analyze candle bodies and wicks to recognize support and resistance levels, then execute trades accordingly.
What are the advantages of candlestick technical analysis compared to other technical indicators?
Candlestick charts are intuitive and easy to interpret, allowing traders to quickly identify bullish and bearish trends through visual patterns and colors. They are beginner-friendly, more accessible than complex indicators, and provide clear support and resistance levels for informed trading decisions.
How should beginners learn and apply candlestick trading methods?
Beginners should start by mastering basic candlestick patterns and colors, then practice identifying common trend and reversal formations. Finally, combine technical analysis with fundamental analysis to execute trades effectively and build trading expertise.
How to identify and apply common candlestick patterns (such as hammer lines, engulfing patterns, etc.) in practical trading?
Identify hammer lines by short body with long lower wick after downtrends, signaling potential reversals. Engulfing patterns show larger candles completely covering previous ones, indicating trend changes. Use these with volume confirmation and market context for entry/exit signals in crypto trading strategies.
What are the risks and limitations of candlestick trading?
Candlestick trading faces time lag and price gap risks that may affect short-term strategies. High leverage amplifies both gains and losses. Combining with other technical indicators improves accuracy and reduces false signals in volatile markets.
Share
Content
How to Buy Cryptocurrency


Trending Cryptocurrencies


How to Read Crypto Charts: Beginner's Guide to Trading

How to Interpret MACD, RSI, and Moving Averages for Crypto Trading Signals?

How to Interpret MACD, RSI, and Moving Averages for Crypto Trading Signals?

How to Interpret Technical Indicators for Crypto Trading Success?

How to Interpret Multiple Technical Indicators for Cryptocurrency Trading?
A Beginner’s Guide to Reading and Analyzing Candlestick Charts

Understanding Spot Balance on a Cryptocurrency Exchange
Cooin Wallet: A Comprehensive Guide to Secure Crypto Management

What Is a Market Order?
List of XRP Rich: How Much XRP Puts You in the Top 10%

Fear, Uncertainty and Doubt (FUD)