GROK vs OP: The Battle for AI Supremacy in the Tech Titan Arena
Introduction: GROK vs OP Investment Comparison
In the cryptocurrency market, the comparison between GROK and OP has been an unavoidable topic for investors. The two not only show significant differences in market cap ranking, application scenarios, and price performance but also represent different positioning in crypto assets.
GROK (GROK): Launched in 2023, it has gained market recognition as a fully decentralized meme project on the Ethereum Blockchain based on Elon's artificial intelligence - Grok AI.
OP (OP): Since its introduction in 2022, it has been hailed as a low-cost, lightning-fast Ethereum Layer 2 solution, addressing the practical needs of developers and users.
This article will comprehensively analyze the investment value comparison between GROK and OP, focusing on historical price trends, supply mechanisms, institutional adoption, technological ecosystems, and future predictions, attempting to answer the question most concerning to investors:
"Which is the better buy right now?"
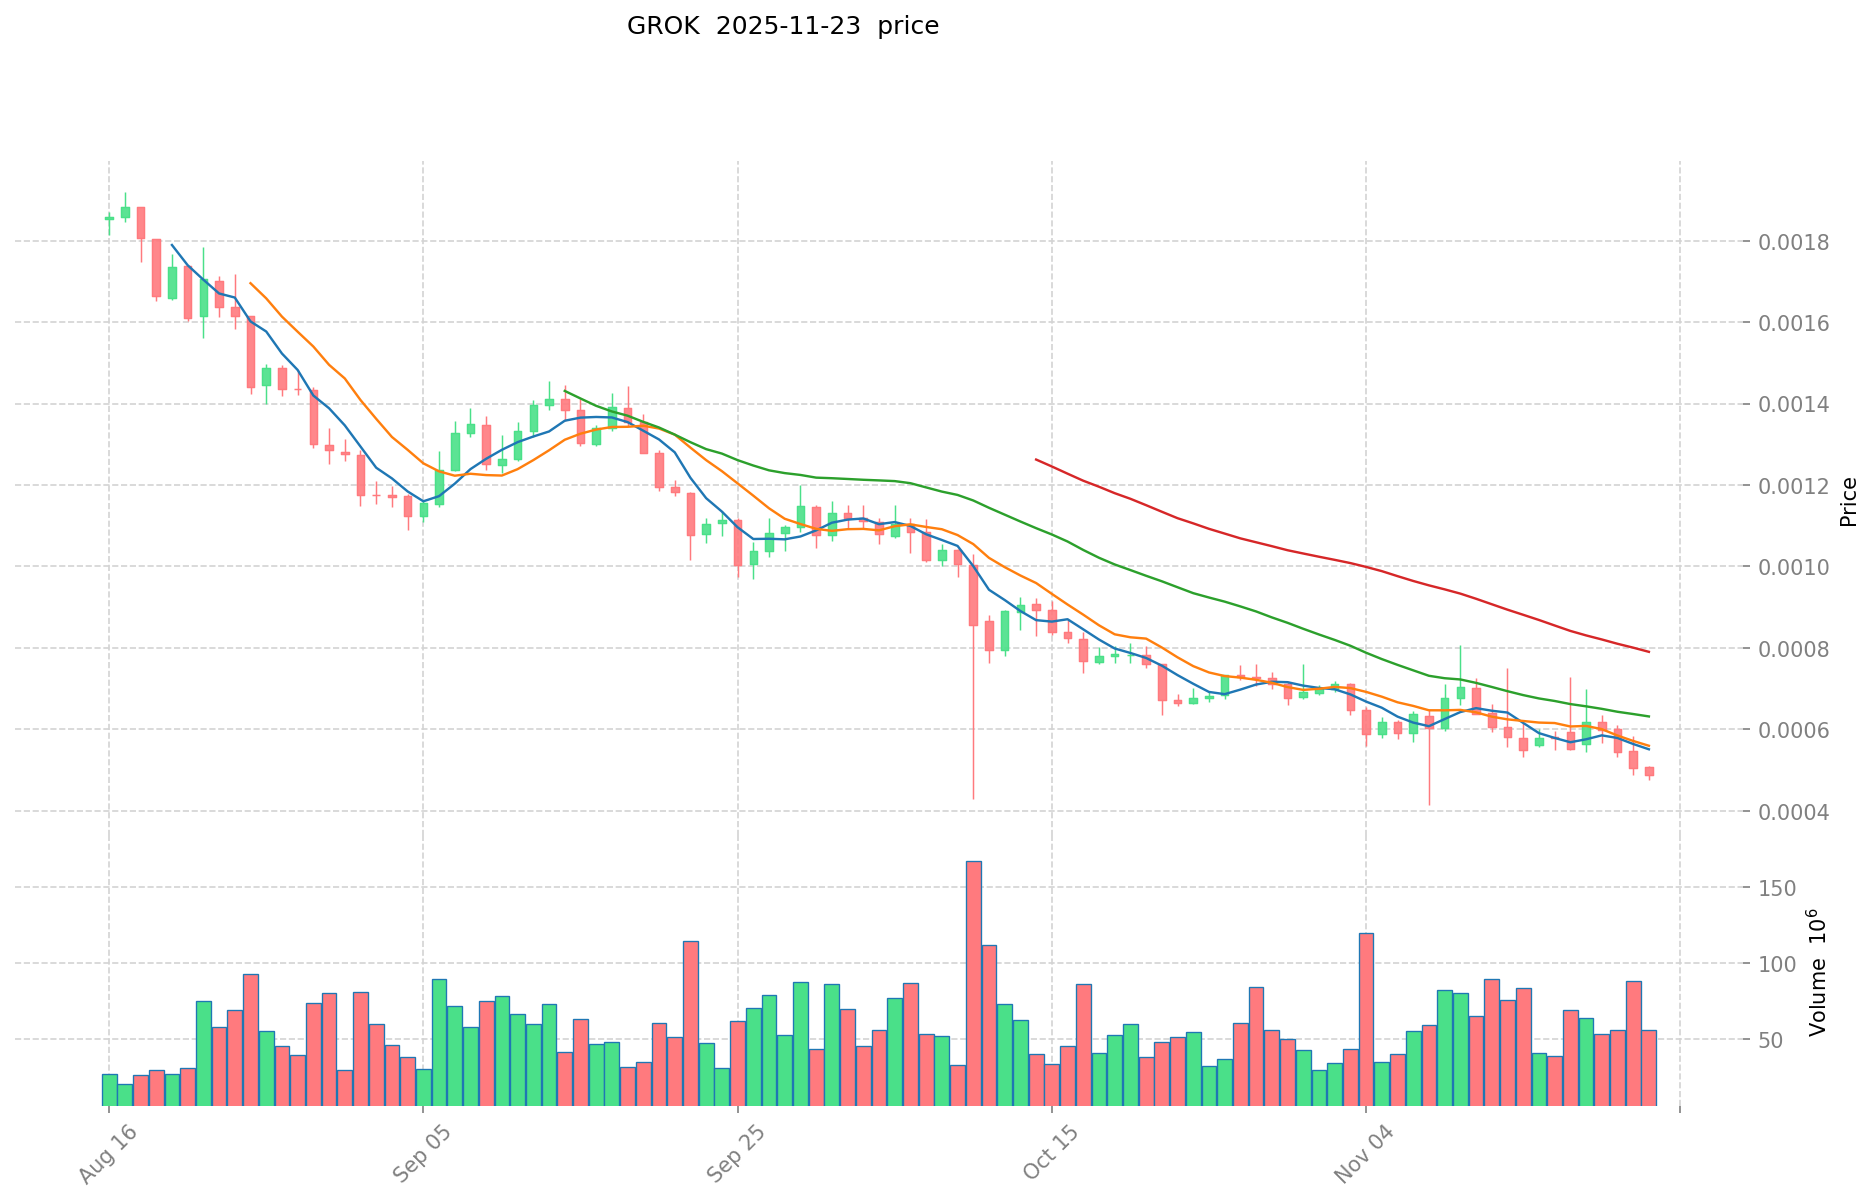
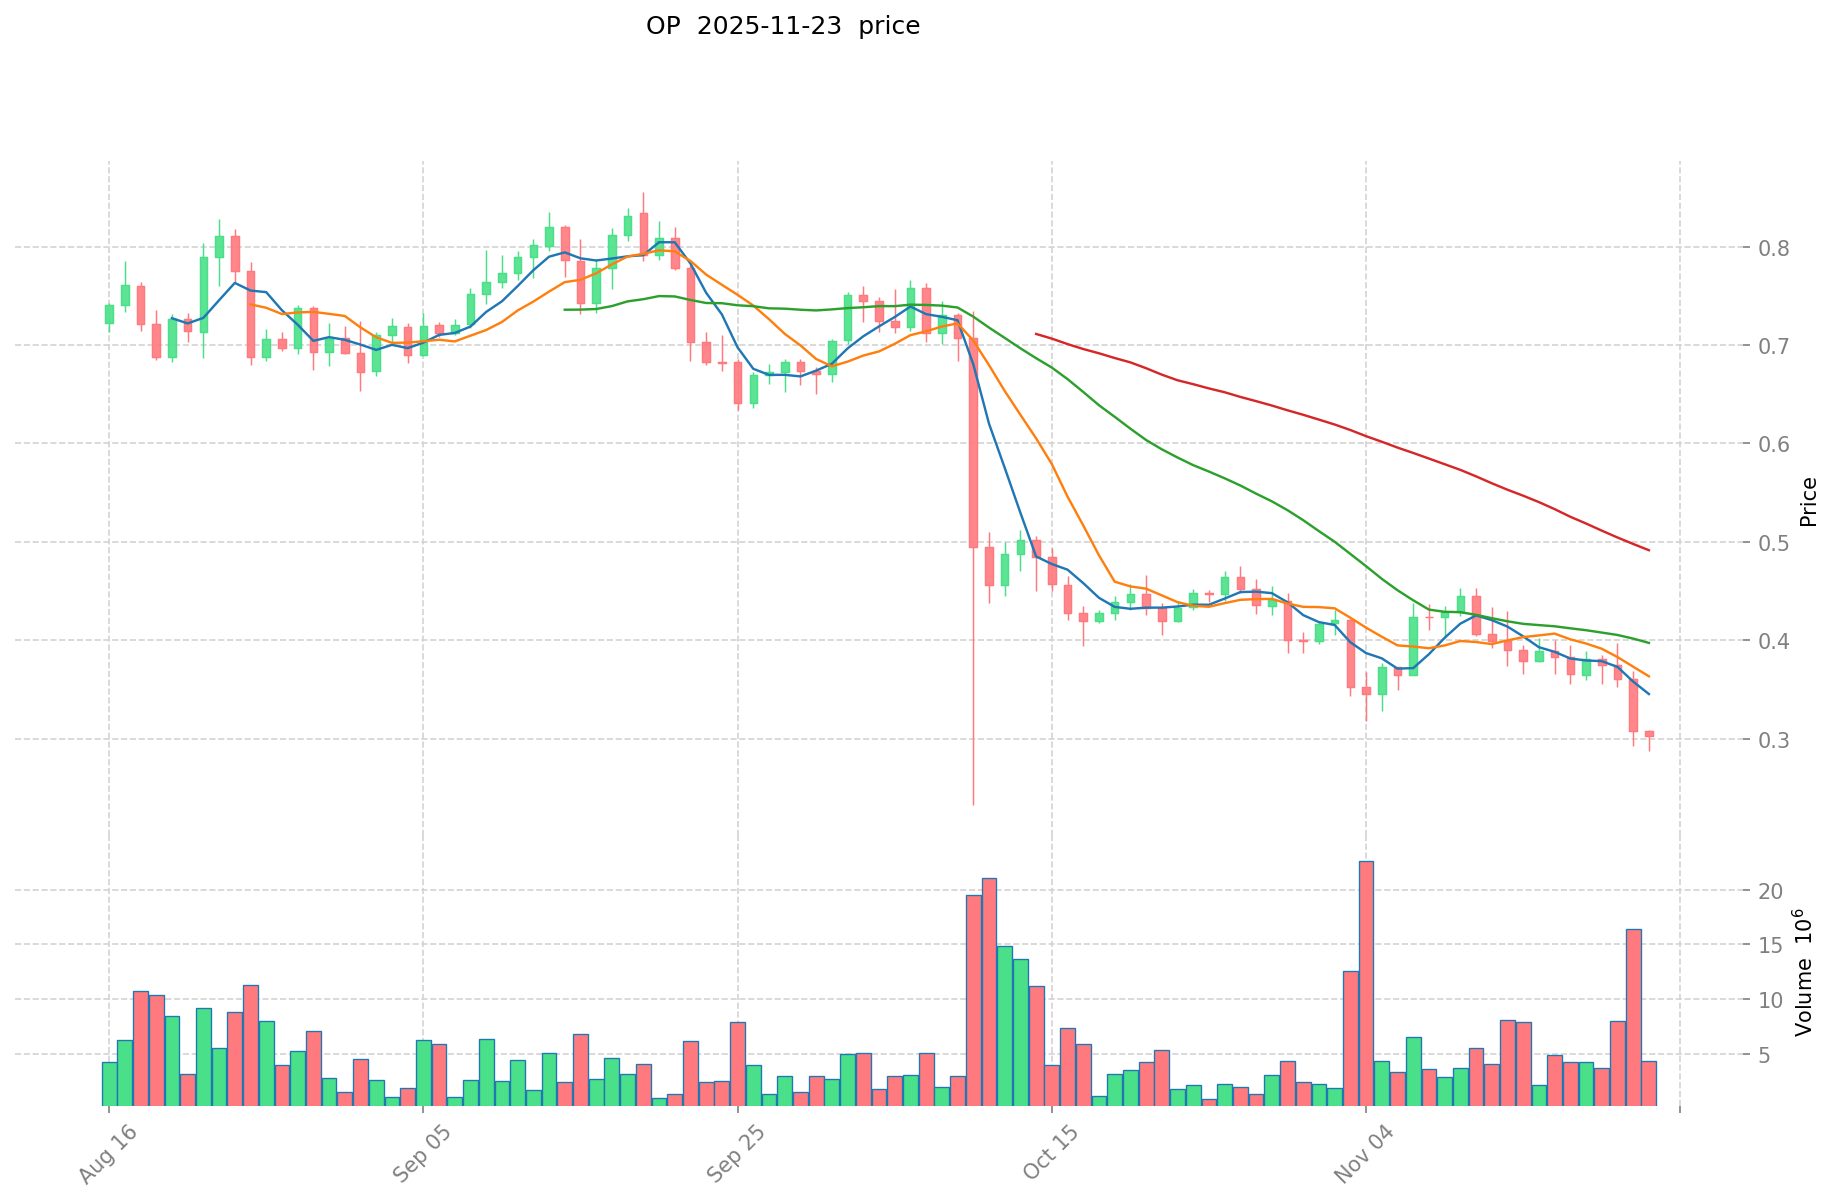
I. Price History Comparison and Current Market Status
GROK and OP Historical Price Trends
- 2023: GROK reached its all-time high of $0.031 on November 13, 2023, shortly after its launch.
- 2024: OP achieved its all-time high of $4.84 on March 6, 2024, marking a significant milestone for the project.
- Comparative analysis: In the current market cycle, GROK has fallen from its all-time high of $0.031 to a low of $0.0004135, while OP has declined from its peak of $4.84 to $0.304.
Current Market Situation (2025-11-23)
- GROK current price: $0.0005012
- OP current price: $0.304
- 24-hour trading volume: GROK $22,170.93 vs OP $940,044.79
- Market Sentiment Index (Fear & Greed Index): 13 (Extreme Fear)
Click to view real-time prices:
- View GROK current price Market Price
- View OP current price Market Price
II. Core Factors Affecting Investment Value of GROK vs OP
Supply Mechanism Comparison (Tokenomics)
- GROK: Fixed supply of 420 million tokens with a deflationary model, featuring token burns and staking rewards
- OP: Total supply of 4.29 billion tokens with gradual distribution through an inflation schedule, allocating tokens to ecosystem development, governance, and user incentives
- 📌 Historical Pattern: Deflationary tokens like GROK tend to create price pressure during bull markets, while OP's controlled inflation supports long-term ecosystem growth but may dilute value in short-term periods.
Institutional Adoption and Market Applications
- Institutional Holdings: OP has stronger institutional backing with Andreessen Horowitz (a16z) and other major VCs as supporters, while GROK remains primarily retail-driven
- Enterprise Adoption: OP shows broader enterprise integration through Optimism's scaling solutions for Ethereum applications, whereas GROK is still developing its utility framework
- Regulatory Stance: Both tokens face similar regulatory scrutiny as utility tokens, though OP benefits from clearer positioning within Ethereum's established ecosystem
Technical Development and Ecosystem Building
- GROK Technical Upgrades: Integration with Elon Musk's xAI technology creating potential AI-blockchain hybrid applications
- OP Technical Development: Continuous improvement of the Optimism Layer 2 scaling solution with significant progress on the OP Stack technology
- Ecosystem Comparison: OP has a mature ecosystem with hundreds of dApps, established DeFi protocols, and governance mechanisms already in place, while GROK's ecosystem is nascent with development primarily focused on meme value and potential AI integration
Macroeconomic and Market Cycle Factors
- Inflation Performance: Neither token has significant historical data to demonstrate anti-inflationary properties, though OP's connection to Ethereum gives it indirect exposure to ETH's store-of-value narrative
- Monetary Policy Impact: Both tokens show high correlation to overall crypto market movements in response to interest rate changes, with speculative assets like GROK typically experiencing higher volatility
- Geopolitical Factors: OP benefits from Ethereum's global infrastructure and regulatory clarity, while GROK may face challenges as a newer, less established asset
III. 2025-2030 Price Prediction: GROK vs OP
Short-term Prediction (2025)
- GROK: Conservative $0.00047614 - $0.0005012 | Optimistic $0.0005012 - $0.000641536
- OP: Conservative $0.239923 - $0.3037 | Optimistic $0.3037 - $0.315848
Mid-term Prediction (2027)
- GROK may enter a growth phase, with prices estimated between $0.00047566386 and $0.00084205359
- OP may enter a growth phase, with prices estimated between $0.1848576345 and $0.4772688018
- Key drivers: Institutional capital inflow, ETFs, ecosystem development
Long-term Prediction (2030)
- GROK: Base scenario $0.000930105398376 - $0.001004513830246 | Optimistic scenario $0.001004513830246 - $0.001058395798152
- OP: Base scenario $0.543760580458095 - $0.598136638503904 | Optimistic scenario $0.598136638503904 - $0.59543013787719
Disclaimer: The information provided is for informational purposes only and should not be considered as financial advice. Cryptocurrency markets are highly volatile and unpredictable. Always conduct your own research before making any investment decisions.
GROK:
| 年份 | 预测最高价 | 预测平均价格 | 预测最低价 | 涨跌幅 |
|---|---|---|---|---|
| 2025 | 0.000641536 | 0.0005012 | 0.00047614 | 0 |
| 2026 | 0.00071421 | 0.000571368 | 0.00046280808 | 14 |
| 2027 | 0.00084205359 | 0.000642789 | 0.00047566386 | 28 |
| 2028 | 0.0008612087022 | 0.000742421295 | 0.0006533307396 | 48 |
| 2029 | 0.001058395798152 | 0.0008018149986 | 0.000705597198768 | 59 |
| 2030 | 0.001004513830246 | 0.000930105398376 | 0.000725482210733 | 85 |
OP:
| 年份 | 预测最高价 | 预测平均价格 | 预测最低价 | 涨跌幅 |
|---|---|---|---|---|
| 2025 | 0.315848 | 0.3037 | 0.239923 | 0 |
| 2026 | 0.36243558 | 0.309774 | 0.18276666 | 1 |
| 2027 | 0.4772688018 | 0.33610479 | 0.1848576345 | 10 |
| 2028 | 0.577495250178 | 0.4066867959 | 0.235878341622 | 33 |
| 2029 | 0.59543013787719 | 0.492091023039 | 0.3444637161273 | 61 |
| 2030 | 0.598136638503904 | 0.543760580458095 | 0.358881983102342 | 78 |
IV. Investment Strategy Comparison: GROK vs OP
Long-term vs Short-term Investment Strategy
- GROK: Suitable for investors focused on meme potential and AI integration possibilities
- OP: Suitable for investors interested in Ethereum scaling solutions and established ecosystem growth
Risk Management and Asset Allocation
- Conservative investors: GROK: 5% vs OP: 15%
- Aggressive investors: GROK: 15% vs OP: 30%
- Hedging tools: Stablecoin allocation, options, cross-token portfolio
V. Potential Risk Comparison
Market Risk
- GROK: High volatility due to meme-driven nature and speculative trading
- OP: Correlated with overall Ethereum ecosystem performance and market sentiment
Technical Risk
- GROK: Scalability, network stability
- OP: Dependence on Ethereum's development, potential Layer 2 competition
Regulatory Risk
- Global regulatory policies may impact both tokens differently, with OP potentially benefiting from clearer positioning within the Ethereum ecosystem
VI. Conclusion: Which Is the Better Buy?
📌 Investment Value Summary:
- GROK advantages: Deflationary model, potential AI integration, high speculative interest
- OP advantages: Established ecosystem, institutional backing, Ethereum Layer 2 scaling solution
✅ Investment Advice:
- New investors: Consider a small allocation to OP as part of a diversified portfolio
- Experienced investors: Balance between GROK and OP based on risk tolerance and market outlook
- Institutional investors: Focus on OP for its established ecosystem and institutional adoption
⚠️ Risk Warning: Cryptocurrency markets are highly volatile. This article does not constitute investment advice. None
VII. FAQ
Q1: What are the main differences between GROK and OP? A: GROK is a meme token with potential AI integration, while OP is an Ethereum Layer 2 scaling solution. GROK has a fixed supply and deflationary model, whereas OP has a controlled inflation schedule. OP has a more established ecosystem and stronger institutional backing compared to GROK.
Q2: Which token has shown better price performance historically? A: OP has shown better historical price performance, reaching an all-time high of $4.84 in March 2024, compared to GROK's all-time high of $0.031 in November 2023. However, both tokens have experienced significant declines from their peak prices.
Q3: How do the supply mechanisms of GROK and OP differ? A: GROK has a fixed supply of 420 million tokens with a deflationary model featuring token burns and staking rewards. OP has a total supply of 4.29 billion tokens with a gradual distribution through an inflation schedule, allocating tokens to ecosystem development, governance, and user incentives.
Q4: Which token has stronger institutional adoption? A: OP has stronger institutional backing, with support from major venture capital firms like Andreessen Horowitz (a16z). GROK remains primarily driven by retail investors.
Q5: What are the key factors affecting the future price of GROK and OP? A: Key factors include institutional capital inflow, potential ETF approvals, ecosystem development, technical upgrades, regulatory developments, and overall market sentiment. For GROK, AI integration possibilities could also play a significant role.
Q6: How should investors allocate their portfolios between GROK and OP? A: Conservative investors might consider allocating 5% to GROK and 15% to OP, while aggressive investors might allocate 15% to GROK and 30% to OP. However, these allocations should be adjusted based on individual risk tolerance and market outlook.
Q7: What are the main risks associated with investing in GROK and OP? A: Both tokens face market risks due to the volatile nature of cryptocurrencies. GROK has higher volatility due to its meme-driven nature, while OP is correlated with the overall Ethereum ecosystem performance. Technical risks include scalability issues for GROK and dependence on Ethereum's development for OP. Regulatory risks are present for both tokens, with potential impacts varying based on global regulatory policies.
Share
Content
Introduction: GROK vs OP Investment Comparison
I. Price History Comparison and Current Market Status
II. Core Factors Affecting Investment Value of GROK vs OP
III. 2025-2030 Price Prediction: GROK vs OP
IV. Investment Strategy Comparison: GROK vs OP
V. Potential Risk Comparison
VI. Conclusion: Which Is the Better Buy?
VII. FAQ

