EYWA vs KAVA: Comparing Two Emerging DeFi Platforms for Cross-Chain Liquidity
Introduction: Investment Comparison of EYWA vs KAVA
In the cryptocurrency market, the comparison between EYWA and KAVA has been an unavoidable topic for investors. The two not only show significant differences in market cap ranking, application scenarios, and price performance, but also represent different positioning in the crypto asset space.
EYWA (EYWA): Since its launch, it has gained market recognition for its unified cross-chain liquidity market approach.
Kava (KAVA): Introduced in 2019, it has been hailed as a cross-chain DeFi platform, becoming one of the notable projects in the decentralized finance sector.
This article will provide a comprehensive analysis of the investment value comparison between EYWA and KAVA, focusing on historical price trends, supply mechanisms, institutional adoption, technological ecosystems, and future predictions, attempting to answer the question most concerning to investors:
"Which is the better buy right now?"
I. Price History Comparison and Current Market Status
EYWA and KAVA Historical Price Trends
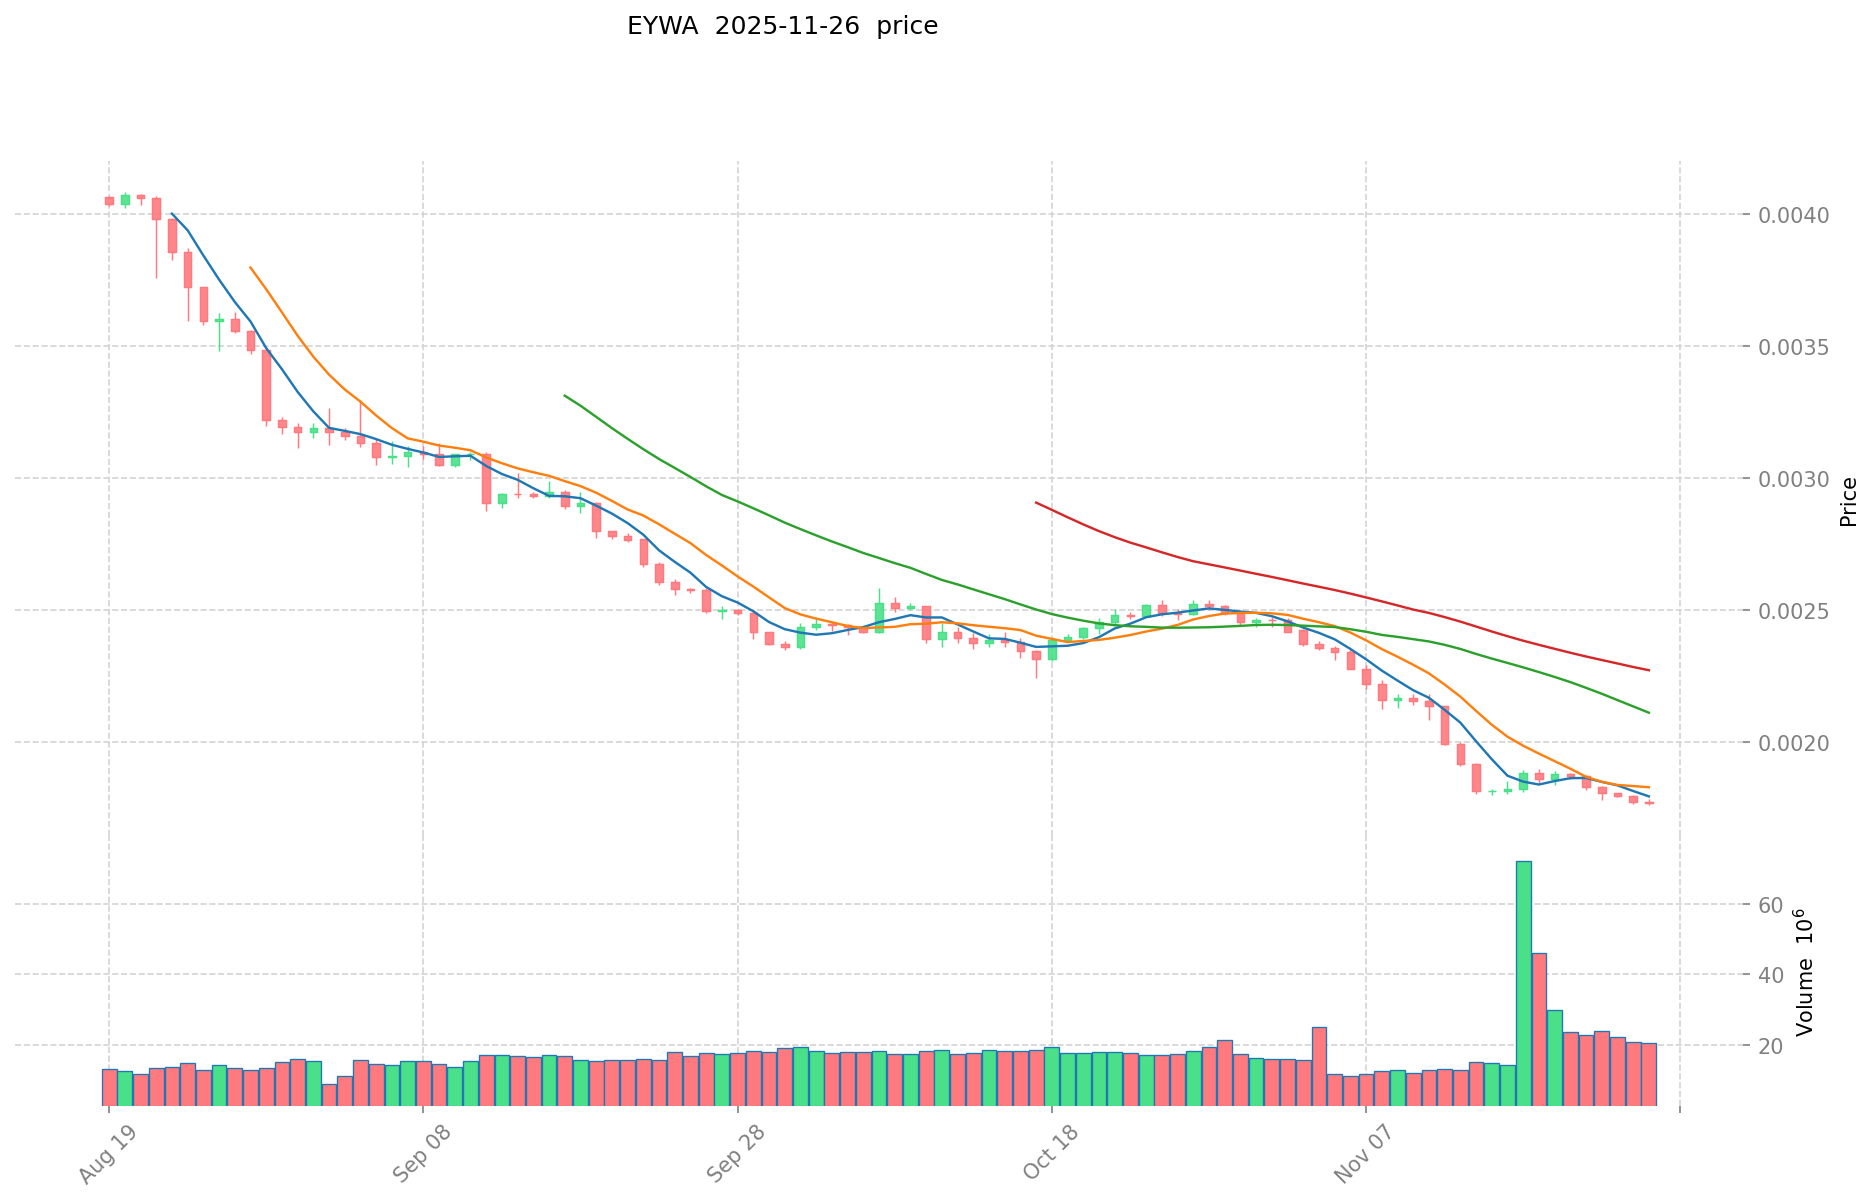
- 2024: EYWA reached its all-time high of $0.31307 on December 27, 2024.
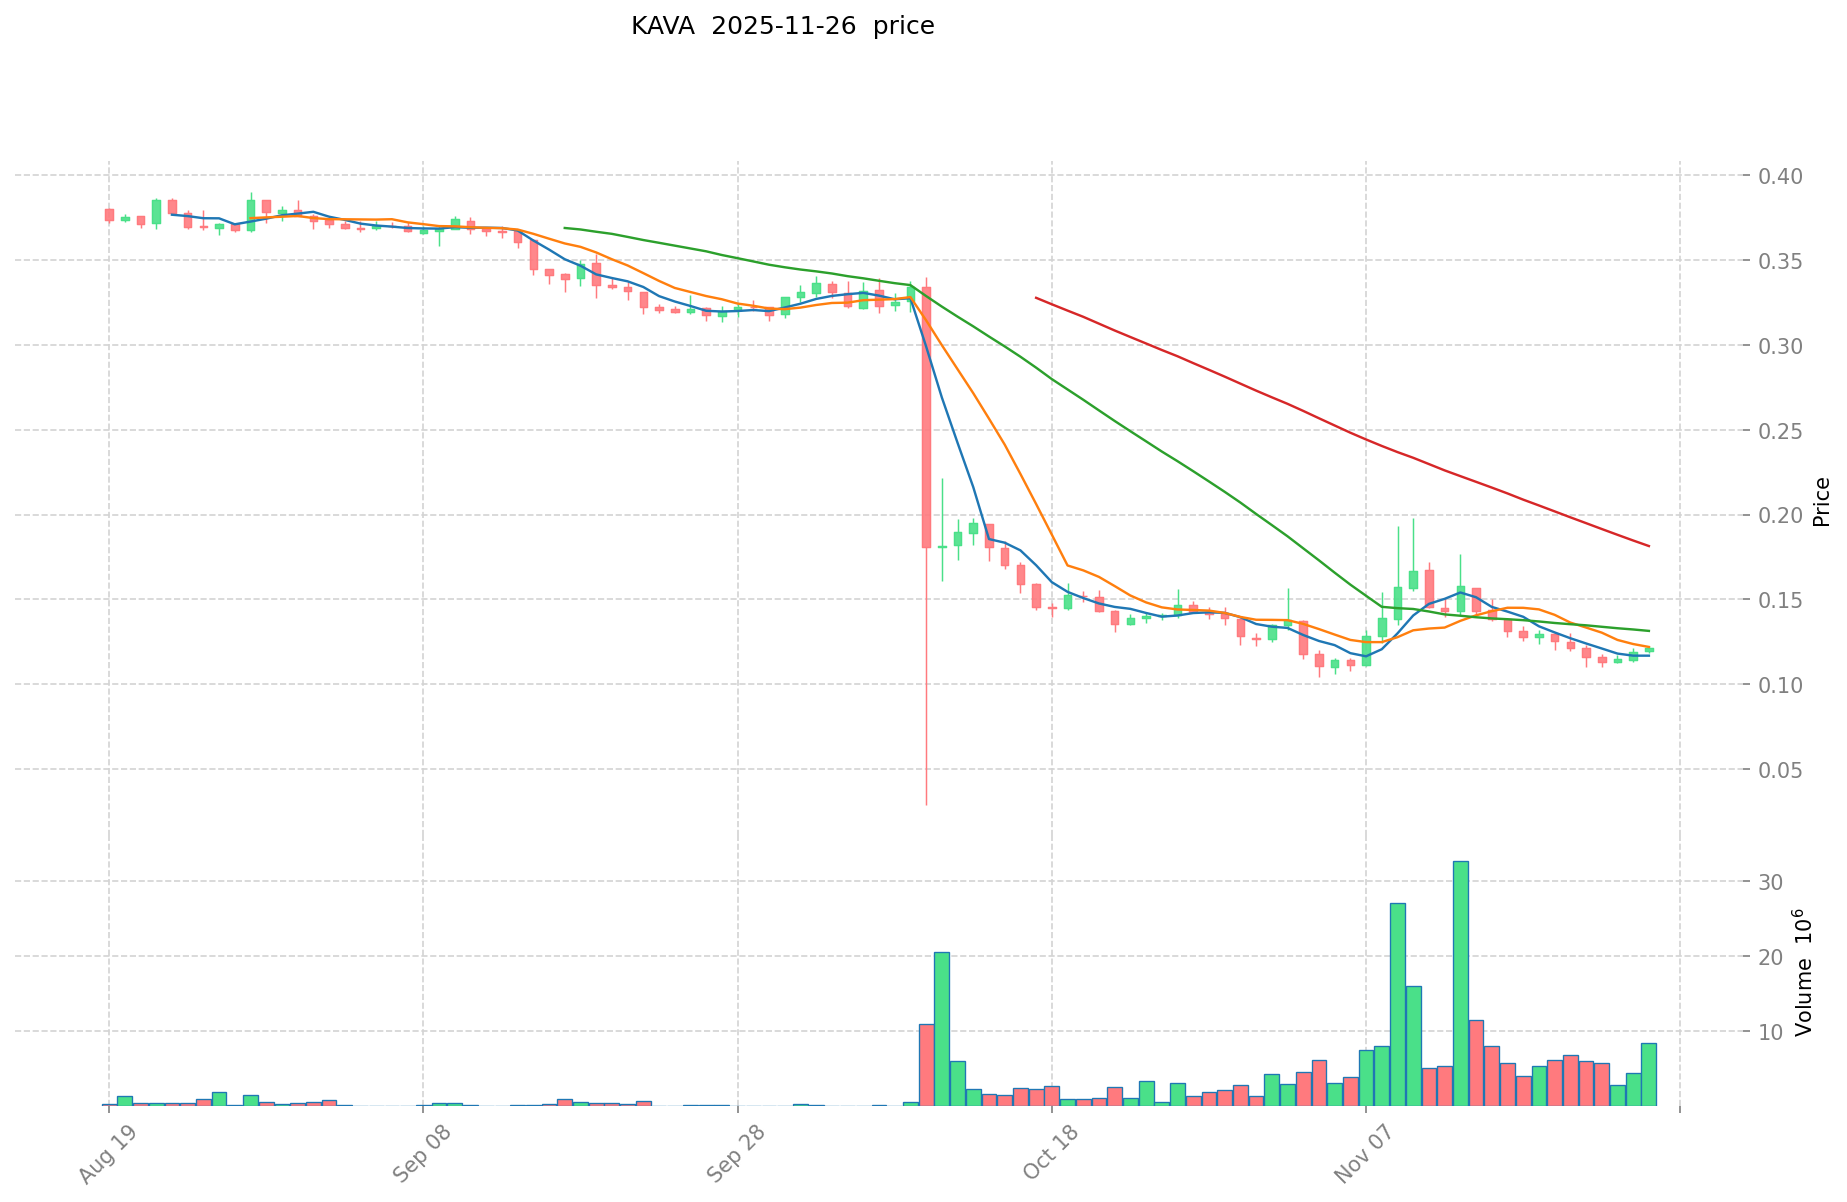
- 2025: KAVA hit its all-time low of $0.105588 on November 5, 2025.
- Comparative analysis: In the recent market cycle, EYWA has fallen from its ATH of $0.31307 to a current price of $0.001772, while KAVA has declined from its ATH of $9.12 to $0.12265.
Current Market Situation (2025-11-26)
- EYWA current price: $0.001772
- KAVA current price: $0.12265
- 24-hour trading volume: $39,419.88 (EYWA) vs $1,203,072.17 (KAVA)
- Market Sentiment Index (Fear & Greed Index): 20 (Extreme Fear)
Click to view real-time prices:
- Check EYWA current price Market Price
- Check KAVA current price Market Price
II. Core Factors Affecting Investment Value of EYWA vs KAVA
Supply Mechanism Comparison (Tokenomics)
- EYWA: Limited supply with 1 billion tokens at launch with deflationary mechanisms through token burning during protocol operations
- KAVA: Fixed supply of 154 million tokens with inflationary model through staking rewards and validator incentives
- 📌 Historical pattern: Deflationary models like EYWA's tend to create upward price pressure long-term, while KAVA's controlled inflation model provides sustainable yields for stakers but may dilute value.
Institutional Adoption and Market Applications
- Institutional holdings: KAVA has attracted more institutional interest with partnerships across traditional finance and DeFi platforms
- Enterprise adoption: KAVA shows stronger enterprise integration through its Cosmos interoperability and multi-chain lending facilities, while EYWA focuses on cross-chain liquidity solutions
- Regulatory stance: Both projects face varying regulatory approaches across jurisdictions, with KAVA's established position providing slightly more regulatory clarity
Technical Development and Ecosystem Building
- EYWA technical upgrades: Cross-chain architecture with Polymesh protocol enabling seamless asset transfers between blockchains
- KAVA technical development: Cosmos SDK-based platform with integrated lending protocols and cross-chain support for major assets
- Ecosystem comparison: KAVA has a more mature DeFi ecosystem with established lending, staking and yield products, while EYWA emphasizes cross-chain liquidity and interoperability solutions
Macroeconomic and Market Cycles
- Inflation environment performance: KAVA has demonstrated stronger correlation with broader crypto market movements, while EYWA's newer market position makes inflation resistance difficult to evaluate
- Macroeconomic monetary policy: Both tokens show sensitivity to interest rate changes and dollar strength, though KAVA's longer market history provides more data points
- Geopolitical factors: Cross-chain solutions like those offered by both platforms may become increasingly valuable as regulatory fragmentation continues across regions
III. 2025-2030 Price Prediction: EYWA vs KAVA
Short-term Prediction (2025)
- EYWA: Conservative $0.0016834 - $0.001772 | Optimistic $0.001772 - $0.0023922
- KAVA: Conservative $0.1068012 - $0.12276 | Optimistic $0.12276 - $0.1374912
Mid-term Prediction (2027)
- EYWA may enter a growth phase, with prices estimated between $0.001756771875 and $0.003162189375
- KAVA may enter a moderate growth phase, with prices estimated between $0.09423695952 and $0.18980120016
- Key drivers: Institutional capital inflow, ETF, ecosystem development
Long-term Prediction (2030)
- EYWA: Base scenario $0.001945411842972 - $0.003189199742578 | Optimistic scenario $0.003189199742578 - $0.00369947170139
- KAVA: Base scenario $0.188718351131059 - $0.19658161576152 | Optimistic scenario $0.19658161576152 - $0.220171409652902
Disclaimer: This analysis is based on historical data and projections. Cryptocurrency markets are highly volatile and unpredictable. This information should not be considered as financial advice. Always conduct your own research before making investment decisions.
EYWA:
| 年份 | 预测最高价 | 预测平均价格 | 预测最低价 | 涨跌幅 |
|---|---|---|---|---|
| 2025 | 0.0023922 | 0.001772 | 0.0016834 | 0 |
| 2026 | 0.002602625 | 0.0020821 | 0.001728143 | 17 |
| 2027 | 0.003162189375 | 0.0023423625 | 0.001756771875 | 32 |
| 2028 | 0.00291741249375 | 0.0027522759375 | 0.00236695730625 | 55 |
| 2029 | 0.003543555269531 | 0.002834844215625 | 0.002693102004843 | 59 |
| 2030 | 0.00369947170139 | 0.003189199742578 | 0.001945411842972 | 79 |
KAVA:
| 年份 | 预测最高价 | 预测平均价格 | 预测最低价 | 涨跌幅 |
|---|---|---|---|---|
| 2025 | 0.1374912 | 0.12276 | 0.1068012 | 0 |
| 2026 | 0.135330624 | 0.1301256 | 0.081979128 | 6 |
| 2027 | 0.18980120016 | 0.132728112 | 0.09423695952 | 8 |
| 2028 | 0.209644052904 | 0.16126465608 | 0.1096599661344 | 31 |
| 2029 | 0.20770887703104 | 0.185454354492 | 0.12796350459948 | 51 |
| 2030 | 0.220171409652902 | 0.19658161576152 | 0.188718351131059 | 60 |
IV. Investment Strategy Comparison: EYWA vs KAVA
Long-term vs Short-term Investment Strategies
- EYWA: Suitable for investors focused on cross-chain liquidity and interoperability potential
- KAVA: Suitable for investors seeking established DeFi ecosystems and yield opportunities
Risk Management and Asset Allocation
- Conservative investors: EYWA: 20% vs KAVA: 80%
- Aggressive investors: EYWA: 40% vs KAVA: 60%
- Hedging tools: Stablecoin allocation, options, cross-token combinations
V. Potential Risk Comparison
Market Risks
- EYWA: Higher volatility due to lower market cap and trading volume
- KAVA: Susceptible to broader crypto market trends and DeFi sector fluctuations
Technical Risks
- EYWA: Scalability, network stability in cross-chain operations
- KAVA: Validator concentration, smart contract vulnerabilities
Regulatory Risks
- Global regulatory policies may impact both differently, with KAVA potentially facing more scrutiny due to its established DeFi presence
VI. Conclusion: Which Is the Better Buy?
📌 Investment Value Summary:
- EYWA advantages: Innovative cross-chain liquidity solutions, deflationary tokenomics
- KAVA advantages: Established DeFi ecosystem, stronger institutional adoption, proven track record
✅ Investment Advice:
- New investors: Consider a smaller allocation to KAVA for exposure to established DeFi protocols
- Experienced investors: Balanced approach with both EYWA and KAVA to diversify across different blockchain interoperability solutions
- Institutional investors: Higher allocation to KAVA due to its more mature ecosystem and regulatory clarity
⚠️ Risk Warning: The cryptocurrency market is highly volatile, and this article does not constitute investment advice. None
VII. FAQ
Q1: What are the main differences between EYWA and KAVA? A: EYWA focuses on cross-chain liquidity solutions with a deflationary tokenomics model, while KAVA is an established DeFi platform built on Cosmos SDK with a more mature ecosystem and inflationary token model.
Q2: Which token has performed better historically? A: KAVA has a longer market history and has shown stronger performance in terms of price and adoption. However, EYWA is newer and has potential for growth in the cross-chain liquidity space.
Q3: What are the key factors affecting the investment value of EYWA and KAVA? A: Key factors include supply mechanisms, institutional adoption, technical development, ecosystem building, and macroeconomic conditions. KAVA has stronger institutional adoption and a more developed ecosystem, while EYWA offers innovative cross-chain solutions.
Q4: How do the supply mechanisms of EYWA and KAVA differ? A: EYWA has a limited supply of 1 billion tokens with deflationary mechanisms through token burning. KAVA has a fixed supply of 154 million tokens with an inflationary model through staking rewards and validator incentives.
Q5: What are the potential risks associated with investing in EYWA and KAVA? A: Both face market risks, technical risks, and regulatory risks. EYWA may have higher volatility due to its lower market cap, while KAVA may be more susceptible to broader crypto market trends and DeFi sector fluctuations.
Q6: Which token is better suited for long-term vs short-term investment strategies? A: EYWA may be more suitable for investors focused on cross-chain liquidity and interoperability potential, while KAVA is better suited for those seeking established DeFi ecosystems and yield opportunities.
Q7: How should investors approach asset allocation between EYWA and KAVA? A: Conservative investors might consider allocating 20% to EYWA and 80% to KAVA, while more aggressive investors could opt for a 40% EYWA and 60% KAVA split. This should be adjusted based on individual risk tolerance and investment goals.
Share
Content
Introduction: Investment Comparison of EYWA vs KAVA
I. Price History Comparison and Current Market Status
II. Core Factors Affecting Investment Value of EYWA vs KAVA
III. 2025-2030 Price Prediction: EYWA vs KAVA
IV. Investment Strategy Comparison: EYWA vs KAVA
V. Potential Risk Comparison
VI. Conclusion: Which Is the Better Buy?
VII. FAQ

