CORL vs OP: The Battle for Algorithmic Trading Supremacy in Cryptocurrency Markets
Introduction: CORL vs OP Investment Comparison
In the cryptocurrency market, the comparison between CORL vs OP has always been a topic that investors can't ignore. The two not only show significant differences in market cap ranking, application scenarios, and price performance, but also represent different crypto asset positioning.
Coral Finance (CORL): Since its launch, it has gained market recognition for its DeFAI application layer enabling users to discover, trade, and engage in early alpha and yield-generating opportunities.
Optimism (OP): Since its inception, it has been hailed as a low-cost, lightning-fast Ethereum Layer 2 blockchain, and is one of the cryptocurrencies with the highest global trading volume and market capitalization.
This article will comprehensively analyze the investment value comparison between CORL vs OP, focusing on historical price trends, supply mechanisms, institutional adoption, technological ecosystems, and future predictions, and attempt to answer the question that investors care most about:
"Which is the better buy right now?"
I. Price History Comparison and Current Market Status
CORL (Coral Finance) and OP (Optimism) Historical Price Trends
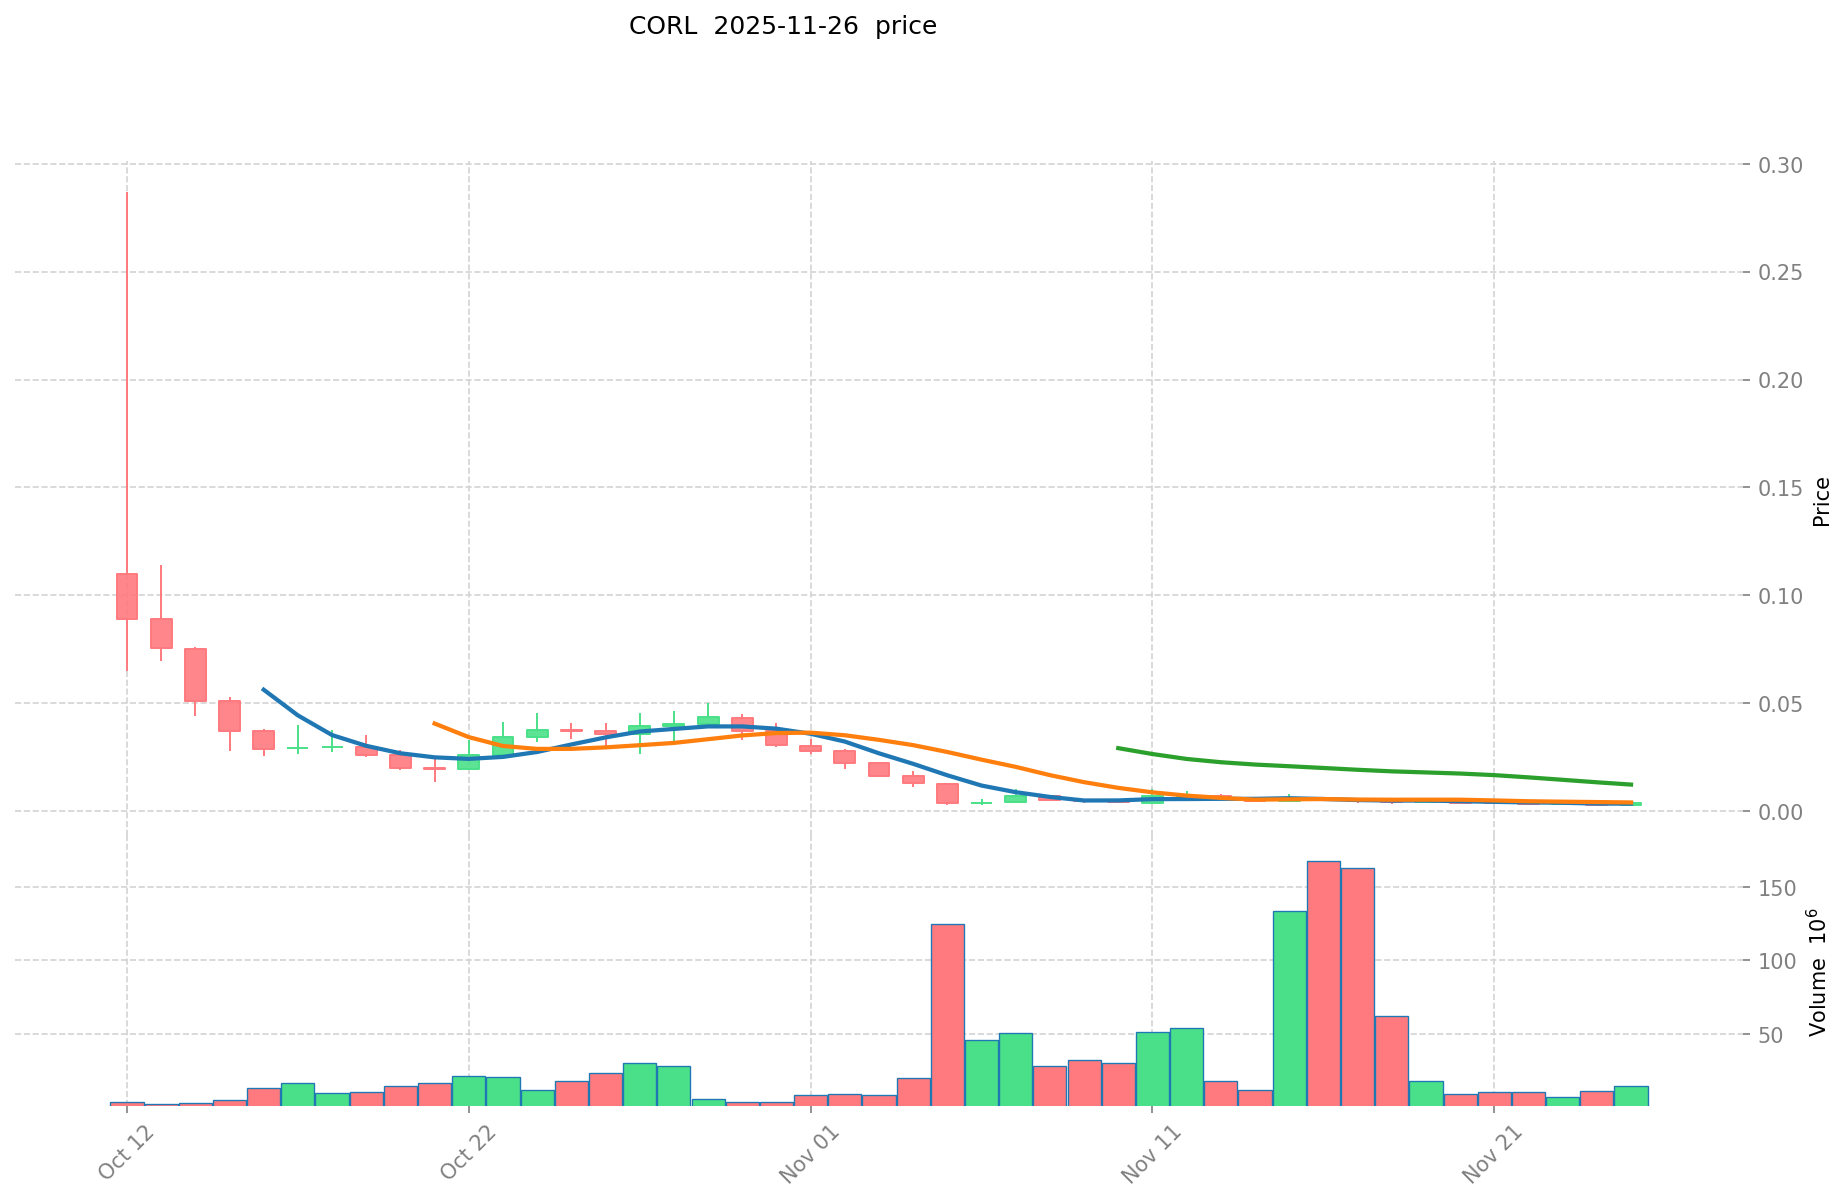
- 2025: CORL reached its all-time high of $0.28699 on October 12, then declined significantly.
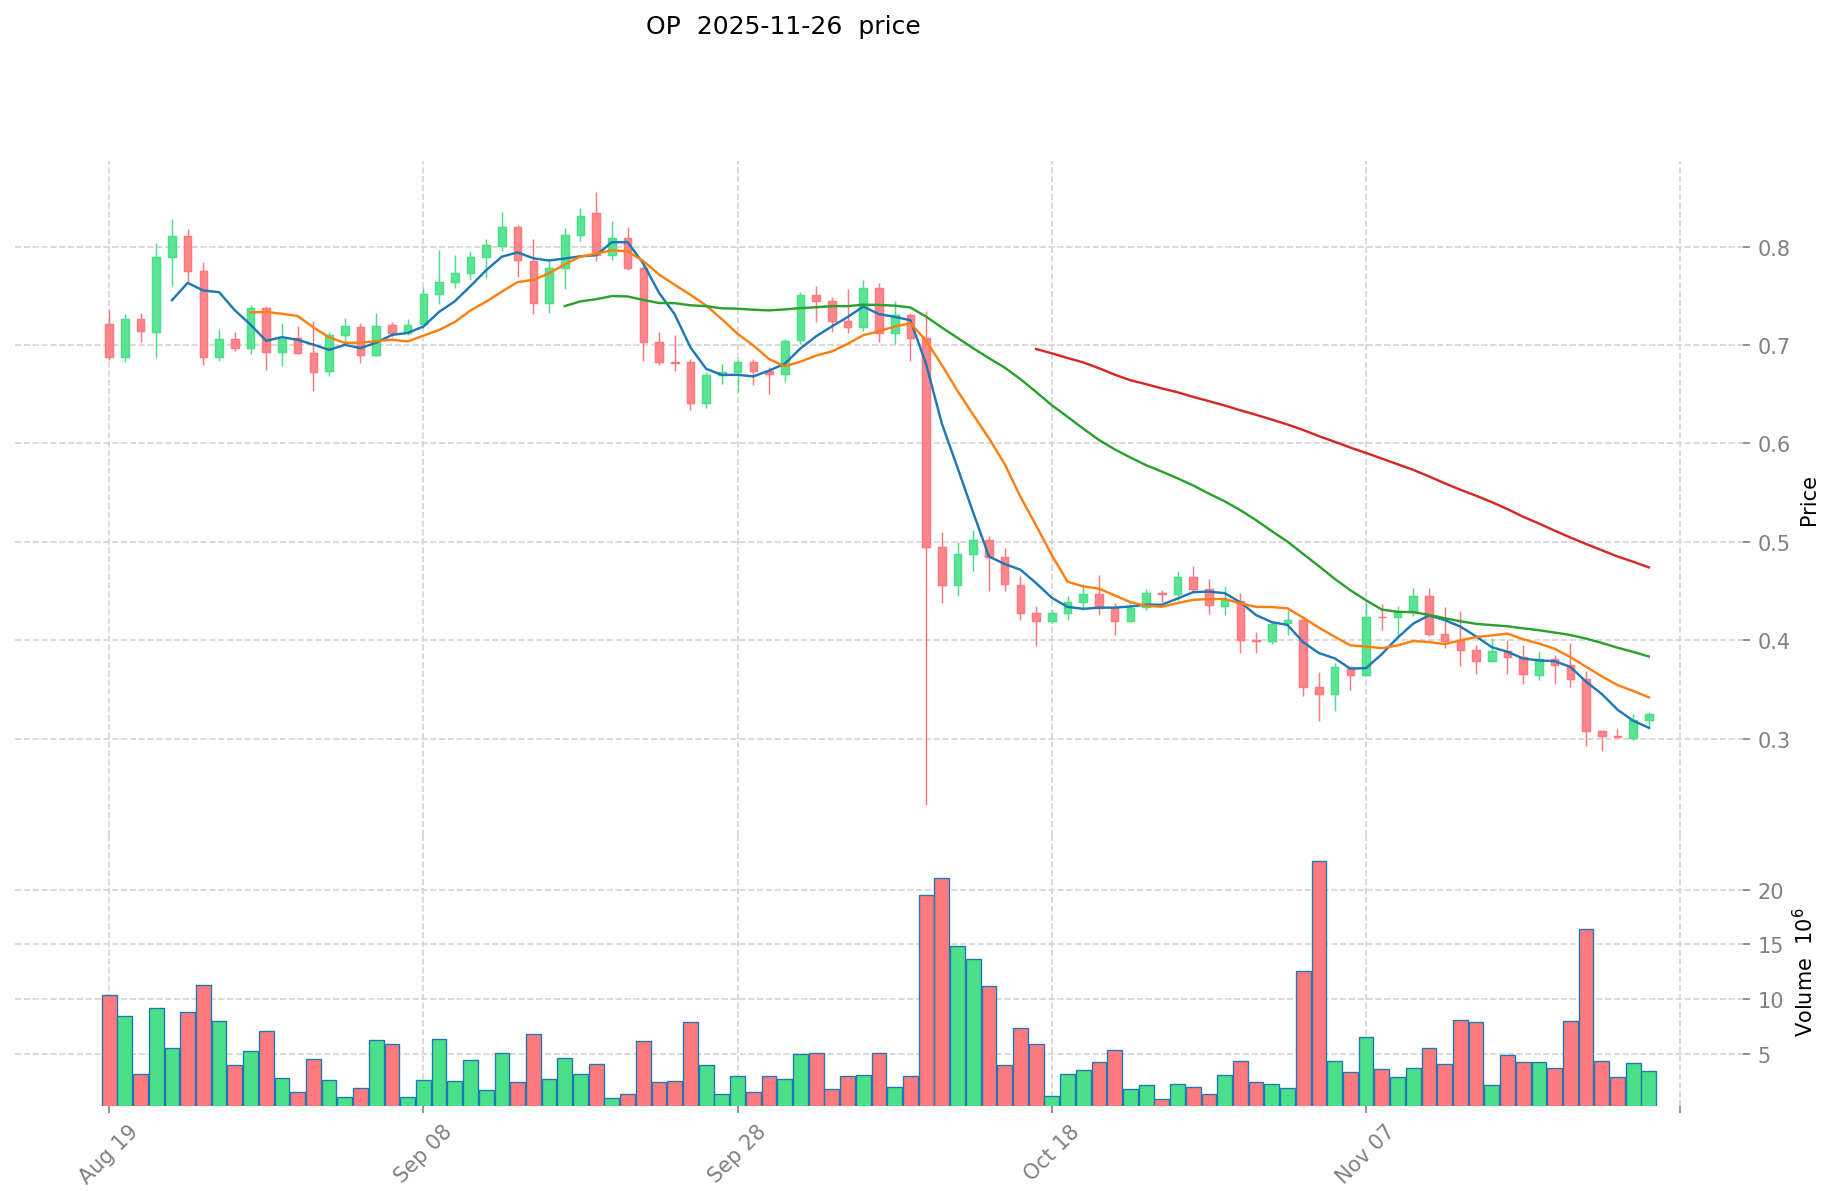
- 2024: OP hit its all-time high of $4.84 on March 6, followed by a substantial price drop.
- Comparative analysis: In the recent market cycle, CORL dropped from $0.28699 to a low of $0.0026, while OP declined from $4.84 to $0.288846.
Current Market Situation (2025-11-26)
- CORL current price: $0.003607
- OP current price: $0.3222
- 24-hour trading volume: CORL $49,189.01 vs OP $1,104,706.71
- Market Sentiment Index (Fear & Greed Index): 20 (Extreme Fear)
Click to view real-time prices:
- Check CORL current price Market Price
- Check OP current price Market Price
Key Factors Influencing CORL vs OP Investment Value
I. Investment Value Core Factors
CORL Investment Value Drivers
- Future price expectations of specific assets
- Project performance estimation before and after TGE (Token Generation Event)
- Potential rewards from participation in staking or airdrop activities
OP Investment Value Drivers
- Market exposure factors
- Regulatory compliance requirements
- Risk management considerations
II. Key Factors Affecting CORL vs OP Investment Value
Supply Mechanisms Comparison (Tokenomics)
- CORL: Future price expectations and project performance metrics
- OP: Market exposure and risk management frameworks
- 📌 Historical pattern: Supply mechanisms drive price cycle variations based on staking rewards and market perception.
Institutional Adoption and Market Applications
- Institutional holdings: Comparative institutional preference between tokens
- Enterprise adoption: Different applications in cross-border payments and portfolio strategies
- Regulatory stance: Varying regulatory approaches across jurisdictions
Technical Development and Ecosystem Building
- CORL ecosystem: Staking and participation mechanisms
- OP ecosystem: Market exposure management and compliance features
- Ecosystem comparison: Implementation in various DeFi applications
Macroeconomic Factors and Market Cycles
- Inflation environment performance: Comparative inflation-resistant properties
- Macroeconomic policy impacts: Effects of rate changes and market trends
- Geopolitical factors: Cross-border transaction demands and international situations
III. 2025-2030 Price Prediction: CORL vs OP
Short-term Prediction (2025)
- CORL: Conservative $0.00290085 - $0.003495 | Optimistic $0.003495 - $0.0043338
- OP: Conservative $0.22554 - $0.3222 | Optimistic $0.3222 - $0.412416
Mid-term Prediction (2027)
- CORL may enter a growth phase, with prices expected in the range of $0.00389991672 - $0.0057071952
- OP may enter a bullish market, with prices expected in the range of $0.3379968216 - $0.5777387532
- Key drivers: Institutional capital inflow, ETF, ecosystem development
Long-term Prediction (2030)
- CORL: Base scenario $0.00576456440175 - $0.007263351146205 | Optimistic scenario $0.007263351146205+
- OP: Base scenario $0.59279356395558 - $0.812127182619144 | Optimistic scenario $0.812127182619144+
Disclaimer: The information provided is for informational purposes only and should not be considered as financial advice. Cryptocurrency markets are highly volatile and unpredictable. Always conduct your own research before making any investment decisions.
CORL:
| 年份 | 预测最高价 | 预测平均价格 | 预测最低价 | 涨跌幅 |
|---|---|---|---|---|
| 2025 | 0.0043338 | 0.003495 | 0.00290085 | -3 |
| 2026 | 0.005597592 | 0.0039144 | 0.002426928 | 8 |
| 2027 | 0.0057071952 | 0.004755996 | 0.00389991672 | 31 |
| 2028 | 0.00549317538 | 0.0052315956 | 0.002720429712 | 45 |
| 2029 | 0.0061667433135 | 0.00536238549 | 0.0038072936979 | 48 |
| 2030 | 0.007263351146205 | 0.00576456440175 | 0.002939927844892 | 59 |
OP:
| 年份 | 预测最高价 | 预测平均价格 | 预测最低价 | 涨跌幅 |
|---|---|---|---|---|
| 2025 | 0.412416 | 0.3222 | 0.22554 | 0 |
| 2026 | 0.41873112 | 0.367308 | 0.2571156 | 14 |
| 2027 | 0.5777387532 | 0.39301956 | 0.3379968216 | 21 |
| 2028 | 0.519355697562 | 0.4853791566 | 0.276666119262 | 50 |
| 2029 | 0.68321970083016 | 0.502367427081 | 0.25620738781131 | 55 |
| 2030 | 0.812127182619144 | 0.59279356395558 | 0.563153885757801 | 83 |
IV. Investment Strategy Comparison: CORL vs OP
Long-term vs Short-term Investment Strategies
- CORL: Suitable for investors focusing on DeFAI applications and ecosystem potential
- OP: Suitable for investors seeking Ethereum Layer 2 scaling solutions and network effects
Risk Management and Asset Allocation
- Conservative investors: CORL: 20% vs OP: 80%
- Aggressive investors: CORL: 40% vs OP: 60%
- Hedging tools: Stablecoin allocation, options, cross-token portfolios
V. Potential Risk Comparison
Market Risk
- CORL: Higher volatility due to lower market cap and trading volume
- OP: Exposure to broader Ethereum ecosystem fluctuations
Technical Risk
- CORL: Scalability, network stability in DeFAI applications
- OP: Ethereum dependence, potential Layer 2 competition
Regulatory Risk
- Global regulatory policies may have differing impacts on DeFAI and Layer 2 solutions
VI. Conclusion: Which Is the Better Buy?
📌 Investment Value Summary:
- CORL advantages: DeFAI focus, potential for high growth in early-stage project
- OP advantages: Established Layer 2 solution, larger ecosystem, higher liquidity
✅ Investment Advice:
- New investors: Consider OP for its established position and lower volatility
- Experienced investors: Balanced portfolio with both CORL and OP, adjusting based on risk tolerance
- Institutional investors: OP for larger positions, CORL for diversification into DeFAI sector
⚠️ Risk Warning: Cryptocurrency markets are highly volatile. This article does not constitute investment advice. None
FAQ
Q1: What are the main differences between CORL and OP? A: CORL is focused on DeFAI applications, while OP is an Ethereum Layer 2 scaling solution. CORL has a lower market cap and trading volume, potentially offering higher growth but with more volatility. OP has a larger ecosystem and higher liquidity.
Q2: Which token has performed better historically? A: Based on the data provided, OP has shown better historical performance. It reached an all-time high of $4.84 in March 2024, compared to CORL's all-time high of $0.28699 in October 2025.
Q3: What are the key factors influencing the investment value of CORL and OP? A: Key factors include supply mechanisms, institutional adoption, technical development and ecosystem building, and macroeconomic factors. For CORL, future price expectations and project performance are crucial. For OP, market exposure and risk management frameworks are important.
Q4: How do the price predictions for CORL and OP compare for 2030? A: For 2030, CORL's base scenario price range is predicted to be $0.00576456440175 - $0.007263351146205, while OP's base scenario is $0.59279356395558 - $0.812127182619144. OP is expected to have a higher potential upside.
Q5: What investment strategies are recommended for CORL and OP? A: For conservative investors, a suggested allocation is 20% CORL and 80% OP. For aggressive investors, 40% CORL and 60% OP is recommended. New investors might consider OP for its established position, while experienced investors could maintain a balanced portfolio of both tokens.
Q6: What are the main risks associated with investing in CORL and OP? A: CORL faces higher volatility due to its lower market cap and trading volume, as well as potential scalability issues. OP is exposed to broader Ethereum ecosystem fluctuations and potential competition from other Layer 2 solutions. Both face regulatory risks, which may impact DeFAI and Layer 2 solutions differently.
Share
Content
Introduction: CORL vs OP Investment Comparison
I. Price History Comparison and Current Market Status
I. Investment Value Core Factors
II. Key Factors Affecting CORL vs OP Investment Value
III. 2025-2030 Price Prediction: CORL vs OP
IV. Investment Strategy Comparison: CORL vs OP
V. Potential Risk Comparison
VI. Conclusion: Which Is the Better Buy?
FAQ

