CGPU vs TRX: A Comprehensive Comparison of Two Leading Blockchain Projects and Their Market Performance

Introduction: CGPU vs TRX Investment Comparison
In the cryptocurrency market, comparisons between ChainGPU and TRON have become an unavoidable topic for investors. The two assets not only show significant differences in market capitalization rankings, application scenarios, and price performance, but also represent different positioning within the crypto asset landscape. ChainGPU (CGPU): Since its launch in 2024, it has gained market recognition by democratizing GPU and AI resources through blockchain technology, fostering a symbiotic ecosystem spanning from hardware owners to AI enthusiasts and enterprises. TRON (TRX): Since its inception in 2017, it has been positioned as a large-scale public blockchain infrastructure, notably achieving official designation as Dominica's national blockchain infrastructure and introducing USDD, a decentralized ultra-collateralized stablecoin, in May 2022. This article will provide a comprehensive analysis of the investment value comparison between CGPU and TRX from multiple dimensions including historical price trends, supply mechanisms, market adoption, and technical ecosystems, while attempting to address the question investors care most about:
"Which is the better buy right now?"
I. Price History Comparison and Current Market Status
ChainGPU (CGPU) and TRON (TRX) Historical Price Trends
- 2024: ChainGPU reached its all-time high of $75 on October 22, 2024, representing significant early-stage appreciation from its launch price of $0.25 in August 2024.
- 2024-2025: TRON maintained relatively stable performance, reaching its all-time high of $0.431288 on December 4, 2024, demonstrating consistent market presence since its launch in 2017.
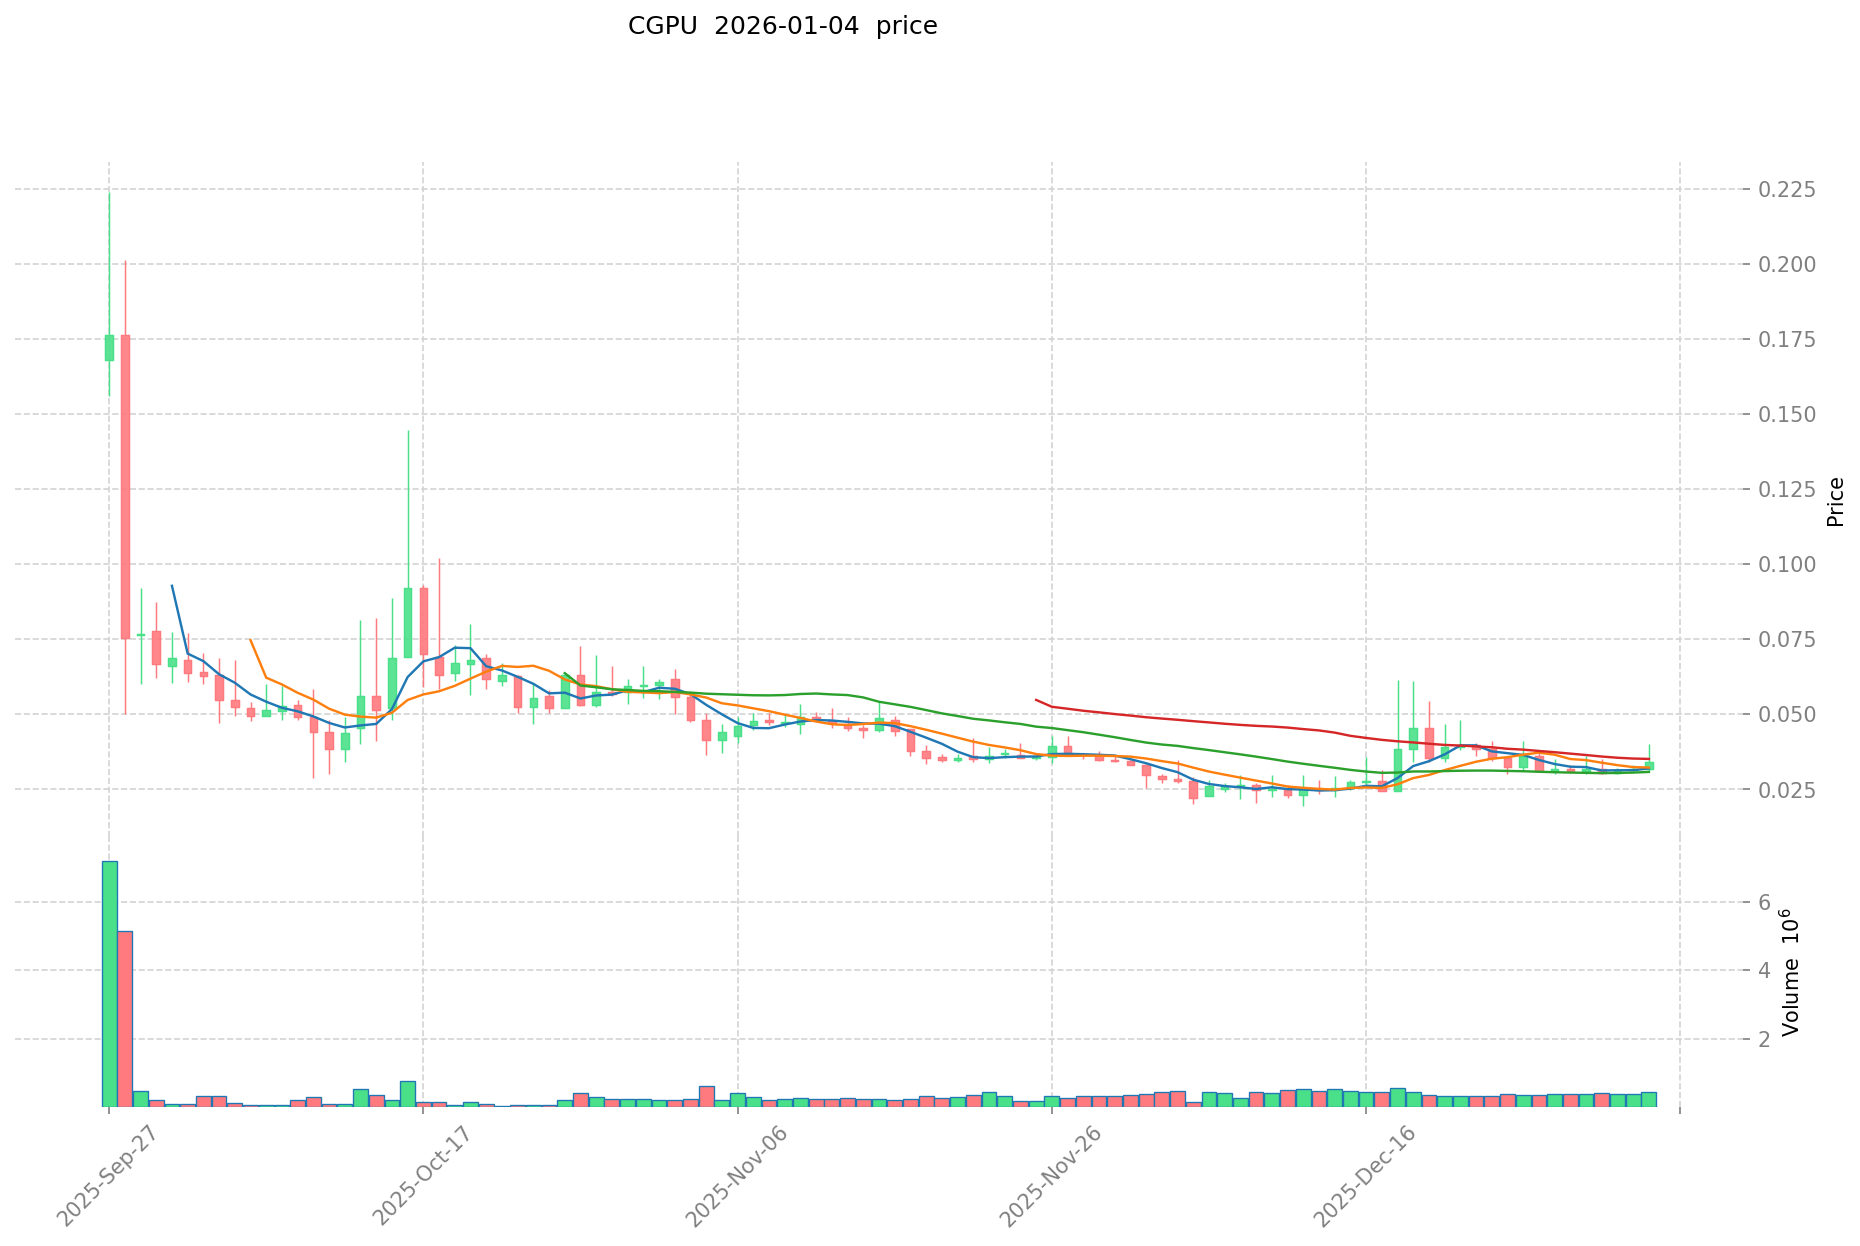
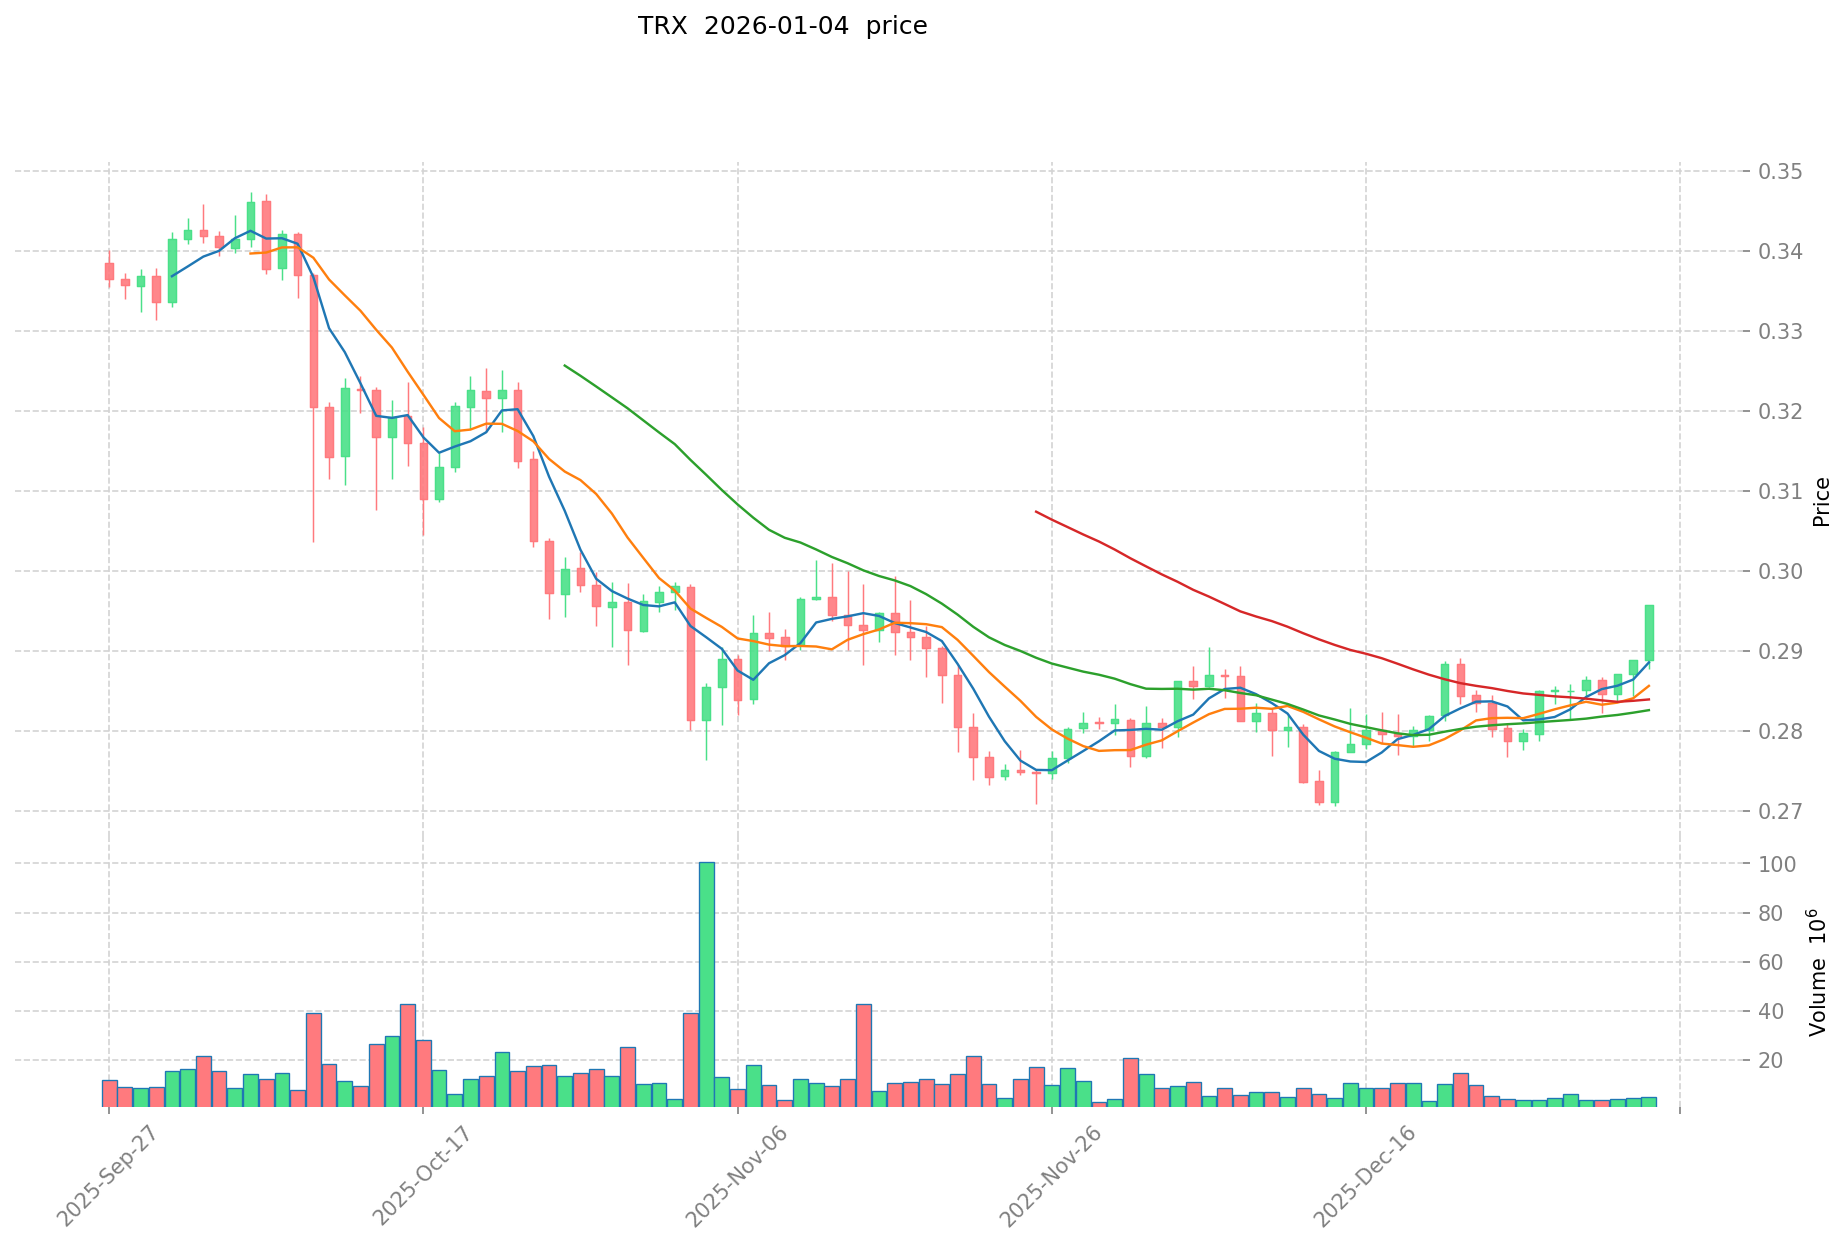
- Comparative Analysis: In the recent market cycle, ChainGPU experienced a dramatic decline from $75 to $0.01941 (all-time low on December 12, 2025), representing a -99.48% decline over one year. In contrast, TRON showed resilience with only a 9.06% positive return over the same period, reflecting its mature market position.
Current Market Landscape (January 5, 2026)
- ChainGPU (CGPU) current price: $0.03488.
- TRON (TRX) current price: $0.29463.
- 24-hour trading volume: CGPU $13,208.51 vs TRX $1,716,965.02.
- Market Sentiment Index (Fear & Greed Index): 29 (Fear).
Click to view real-time prices:
- View CGPU current price Market Price.
- View TRX current price Market Price.
II. Core Factors Influencing Investment Value of CGPU vs TRX
Supply Mechanism Comparison (Tokenomics)
The reference materials provided do not contain specific tokenomics information for CGPU or TRX tokens. This section cannot be completed based on available data.
Institutional Adoption and Market Application
Institutional Holdings
The reference materials do not provide comparative data on institutional holdings of CGPU or TRX tokens.
Enterprise Adoption
The reference materials do not contain information about enterprise adoption of CGPU or TRX in cross-border payments, settlements, or investment portfolios.
National Policy
The reference materials do not address regulatory attitudes of different countries toward CGPU or TRX tokens.
Technology Development and Ecosystem Building
CGPU Technology Upgrade
The reference materials do not provide specific technical upgrade information for CGPU.
TRX Technology Development
The reference materials do not contain detailed technical development information for TRX tokens.
Ecosystem Comparison
The reference materials lack specific details about DeFi, NFT, payment, and smart contract implementations for both CGPU and TRX ecosystems.
Macroeconomic and Market Cycle Factors
Performance in Inflationary Environments
The reference materials do not provide comparative analysis of how CGPU and TRX perform under different inflation scenarios.
Macroeconomic Monetary Policy
The reference materials do not contain information about the impact of interest rates and USD index movements on CGPU and TRX tokens.
Geopolitical Factors
The reference materials do not address geopolitical influences on cross-border transaction demand affecting these tokens.
III. 2026-2031 Price Predictions: CGPU vs TRX
Short-term Prediction (2026)
- CGPU: Conservative $0.032853-$0.03495 | Optimistic $0.036348
- TRX: Conservative $0.1591758-$0.29477 | Optimistic $0.3920441
Medium-term Prediction (2028-2029)
- CGPU may enter growth consolidation phase, with estimated price range $0.0204054876-$0.06081220314
- TRX may enter accelerated appreciation phase, with estimated price range $0.284585714923125-$0.636437144282625
- Key drivers: institutional capital inflows, ETF launches, ecosystem development
Long-term Prediction (2030-2031)
- CGPU: Base scenario $0.034649623883727-$0.0677822171922 | Optimistic scenario $0.062612478246033
- TRX: Base scenario $0.426930315241946-$0.829860223572993 | Optimistic scenario $0.829860223572993
CGPU:
| 年份 | 预测最高价 | 预测平均价格 | 预测最低价 | 涨跌幅 |
|---|---|---|---|---|
| 2026 | 0.036348 | 0.03495 | 0.032853 | 0 |
| 2027 | 0.04135284 | 0.035649 | 0.03457953 | 2 |
| 2028 | 0.0550563156 | 0.03850092 | 0.0204054876 | 10 |
| 2029 | 0.06081220314 | 0.0467786178 | 0.03742289424 | 34 |
| 2030 | 0.0677822171922 | 0.05379541047 | 0.0494917776324 | 54 |
| 2031 | 0.062612478246033 | 0.0607888138311 | 0.034649623883727 | 74 |
TRX:
| 年份 | 预测最高价 | 预测平均价格 | 预测最低价 | 涨跌幅 |
|---|---|---|---|---|
| 2026 | 0.3920441 | 0.29477 | 0.1591758 | 0 |
| 2027 | 0.4979402225 | 0.34340705 | 0.288461922 | 16 |
| 2028 | 0.614183508925 | 0.42067363625 | 0.21875029085 | 42 |
| 2029 | 0.636437144282625 | 0.5174285725875 | 0.284585714923125 | 75 |
| 2030 | 0.761551373134282 | 0.576932858435062 | 0.426930315241946 | 95 |
| 2031 | 0.829860223572993 | 0.669242115784672 | 0.562163377259124 | 127 |
IV. Investment Strategy Comparison: CGPU vs TRX
Long-term vs Short-term Investment Strategy
- CGPU: Suitable for investors focused on emerging GPU and AI resource democratization, seeking early-stage ecosystem participation and high-risk, high-reward opportunities in the AI-blockchain convergence narrative
- TRX: Suitable for investors seeking stable, mature blockchain infrastructure exposure, looking for consistent long-term appreciation with lower volatility and established ecosystem adoption
Risk Management and Asset Allocation
- Conservative Investors: CGPU 5% vs TRX 95%
- Aggressive Investors: CGPU 40% vs TRX 60%
- Hedging Tools: Stablecoin allocation, options strategies, cross-asset diversification with other layer-1 blockchain tokens
V. Potential Risk Comparison
Market Risk
- CGPU: Extreme volatility demonstrated by 99.48% decline from all-time high; limited trading liquidity ($13,208.51 daily volume) compared to TRX; early-stage project concentration risk with speculative market sentiment
- TRX: Regulatory scrutiny faced by decentralized stablecoin USDD; exposure to macroeconomic monetary policy shifts affecting stablecoin demand; potential market saturation in DeFi segment
Technology Risk
- CGPU: Unproven scalability of GPU resource distribution across blockchain infrastructure; potential technical vulnerabilities in AI integration; single-ecosystem dependency
- TRX: Network congestion during peak activity periods; smart contract audit requirements; potential security implications of high transaction throughput
Regulatory Risk
- Global regulatory policies increasingly scrutinize decentralized stablecoins and AI-related token projects; jurisdictional restrictions on both assets vary significantly; TRON's designation as Dominica's national blockchain infrastructure may face geopolitical challenges
VI. Conclusion: Which Is the Better Buy?
📌 Investment Value Summary
- CGPU Advantages: Early-stage positioning in GPU and AI resource democratization; significant upside potential from innovation in blockchain-AI convergence; entry price recovery opportunity from December 2025 lows
- TRX Advantages: Established 8-year market presence with proven resilience; institutional recognition through national blockchain designation; lower volatility profile; superior trading liquidity and market depth; consistent long-term appreciation trajectory (9.06% positive return over recent period)
✅ Investment Recommendations
- Beginner Investors: Prioritize TRX for portfolio stability and established infrastructure; maintain TRX allocation as core holding with minimal CGPU allocation (if any) due to extreme volatility
- Experienced Investors: Implement CGPU/TRX 30/70 allocation strategy; use CGPU position as speculative satellite holding; actively monitor CGPU ecosystem development; rebalance quarterly based on technical milestones
- Institutional Investors: Focus on TRX for regulatory compliance and liquidity requirements; consider CGPU only after demonstrable technology maturation and institutional adoption signals; utilize both in diversified blockchain infrastructure strategies
⚠️ Risk Disclaimer: Cryptocurrency markets exhibit extreme volatility. This analysis does not constitute investment advice. Conduct independent research and consult financial advisors before making investment decisions.
FAQ
CGPU和TRX分别是什么?它们各自的主要用途是什么?
CGPU是中央图形处理单元,主要用于图形计算。TRX是Tron区块链的原生代币,主要用于支付交易费用、参与治理和智能合约执行。两者分别服务于不同的计算和金融领域。
CGPU和TRX在技术架构和共识机制上有什么区别?
CGPU采用权益证明(PoS)共识机制,而TRX使用委托权益证明(DPoS)机制。TRX侧重可扩展性和能效,CGPU强调去中心化和安全性。两者都追求区块链创新但路径不同。
CGPU和TRX的性能表现如何对比?交易速度和成本分别是多少?
TRX性能更优,采用DPoS共识机制,交易速度快、成本低。TRX平均出块时间3秒,交易费用极低。CGPU相对交易速度慢,成本较高。整体而言TRX在性能和成本上表现更具竞争力。
CGPU和TRX分别应用在哪些生态和场景中?
CGPU应用于高性能计算、图形处理、数据分析和科学计算领域。TRX用于射频传输解决方案,广泛应用于雷达、通信系统和相控阵雷达等场景。
投资CGPU和TRX各自面临哪些风险?流动性和市值规模如何?
CGPU和TRX均面临市场波动及技术风险。TRX流动性强,市值约270亿美元,排名前十。CGPU市值相对较小,流动性有限。两者都受供应量和市场情绪影响。
CGPU和TRX哪个更适合长期持有?它们的发展前景如何对比?
CGPU是云挖矿平台,提供长期挖矿合约,收益相对稳定可预测。TRX是区块链平台币,价格波动性较大。CGPU的合约模式更适合长期持有者追求稳定收益,发展前景相对明确;TRX则依赖市场行情,潜力更大但风险也更高。
Share
Content
Introduction: CGPU vs TRX Investment Comparison
I. Price History Comparison and Current Market Status
Supply Mechanism Comparison (Tokenomics)
Institutional Adoption and Market Application
Technology Development and Ecosystem Building
Macroeconomic and Market Cycle Factors
III. 2026-2031 Price Predictions: CGPU vs TRX
IV. Investment Strategy Comparison: CGPU vs TRX
V. Potential Risk Comparison
VI. Conclusion: Which Is the Better Buy?
FAQ
How to Buy Cryptocurrency


Trending Cryptocurrencies


CGPU vs TRX: A Comprehensive Comparison of Two Leading Blockchain Assets and Their Market Performance

Sahara AI (SAHARA) Price Analysis: Recent Volatility Trends and Market Correlations

why is crypto crashing and will it recover ?

TRX to BDT Conversion: Live Rates and Best Platforms in 2025
2025 TAO Price Prediction: Analyzing Market Trends and Growth Potential in the Evolving Crypto Ecosystem

2025 FET Price Prediction: Bullish Trends and Key Factors Driving Fetch.ai's Future Value
When Will Pi Mining End? Pi Network Mining Timeline

What is MOOO: A Comprehensive Guide to Understanding the Emerging Digital Currency Revolution

How to Withdraw Funds from a Leading Cryptocurrency Exchange to Your Bank Account

What is RUNI: A Comprehensive Guide to Understanding the Revolutionary Universal Network Interface

What is FTR: A Comprehensive Guide to Functional Trait Recovery in Modern Applications