2025 SOIL Price Prediction: Expert Analysis and Market Forecast for the Coming Year


Introduction: SOIL's Market Position and Investment Value
SOIL (SOIL) is a fully regulated DeFi protocol backed by real-world assets, serving as a blockchain-based lending bridge between traditional finance and the crypto world. Since its launch in October 2023, SOIL has established itself as a debt marketplace enabling established companies to obtain financing while allowing crypto investors to lend stablecoins and earn yield from off-chain real-world assets. As of December 24, 2025, SOIL's market capitalization stands at approximately $10.145 million, with a circulating supply of around 44.7 million tokens trading at $0.10145. This innovative protocol, positioned as a "regulated RWA-backed lending solution," is playing an increasingly critical role in reshaping corporate debt and fixed-income investment opportunities within the blockchain ecosystem.
This article will provide a comprehensive analysis of SOIL's price trends and market outlook through 2030, integrating historical price movements, market supply and demand dynamics, ecosystem development, and macroeconomic factors to deliver professional price forecasts and actionable investment strategies for investors.
SOIL Market Analysis Report
I. SOIL Price History Review and Current Market Status
SOIL Historical Price Evolution
-
October 2023: SOIL reached its all-time low of $0.04 on October 10, 2023, marking the bottom of its initial price discovery phase.
-
March 2024: SOIL achieved its all-time high of $4.00 on March 28, 2024, representing a 9,900% increase from the previous low, demonstrating strong market interest in the protocol.
-
December 2024 - Present: SOIL has experienced a significant decline of 85.63% over the past year, currently trading at $0.10145 as of December 24, 2025, reflecting broader market corrections and potential volatility in the DeFi lending sector.
SOIL Current Market Status
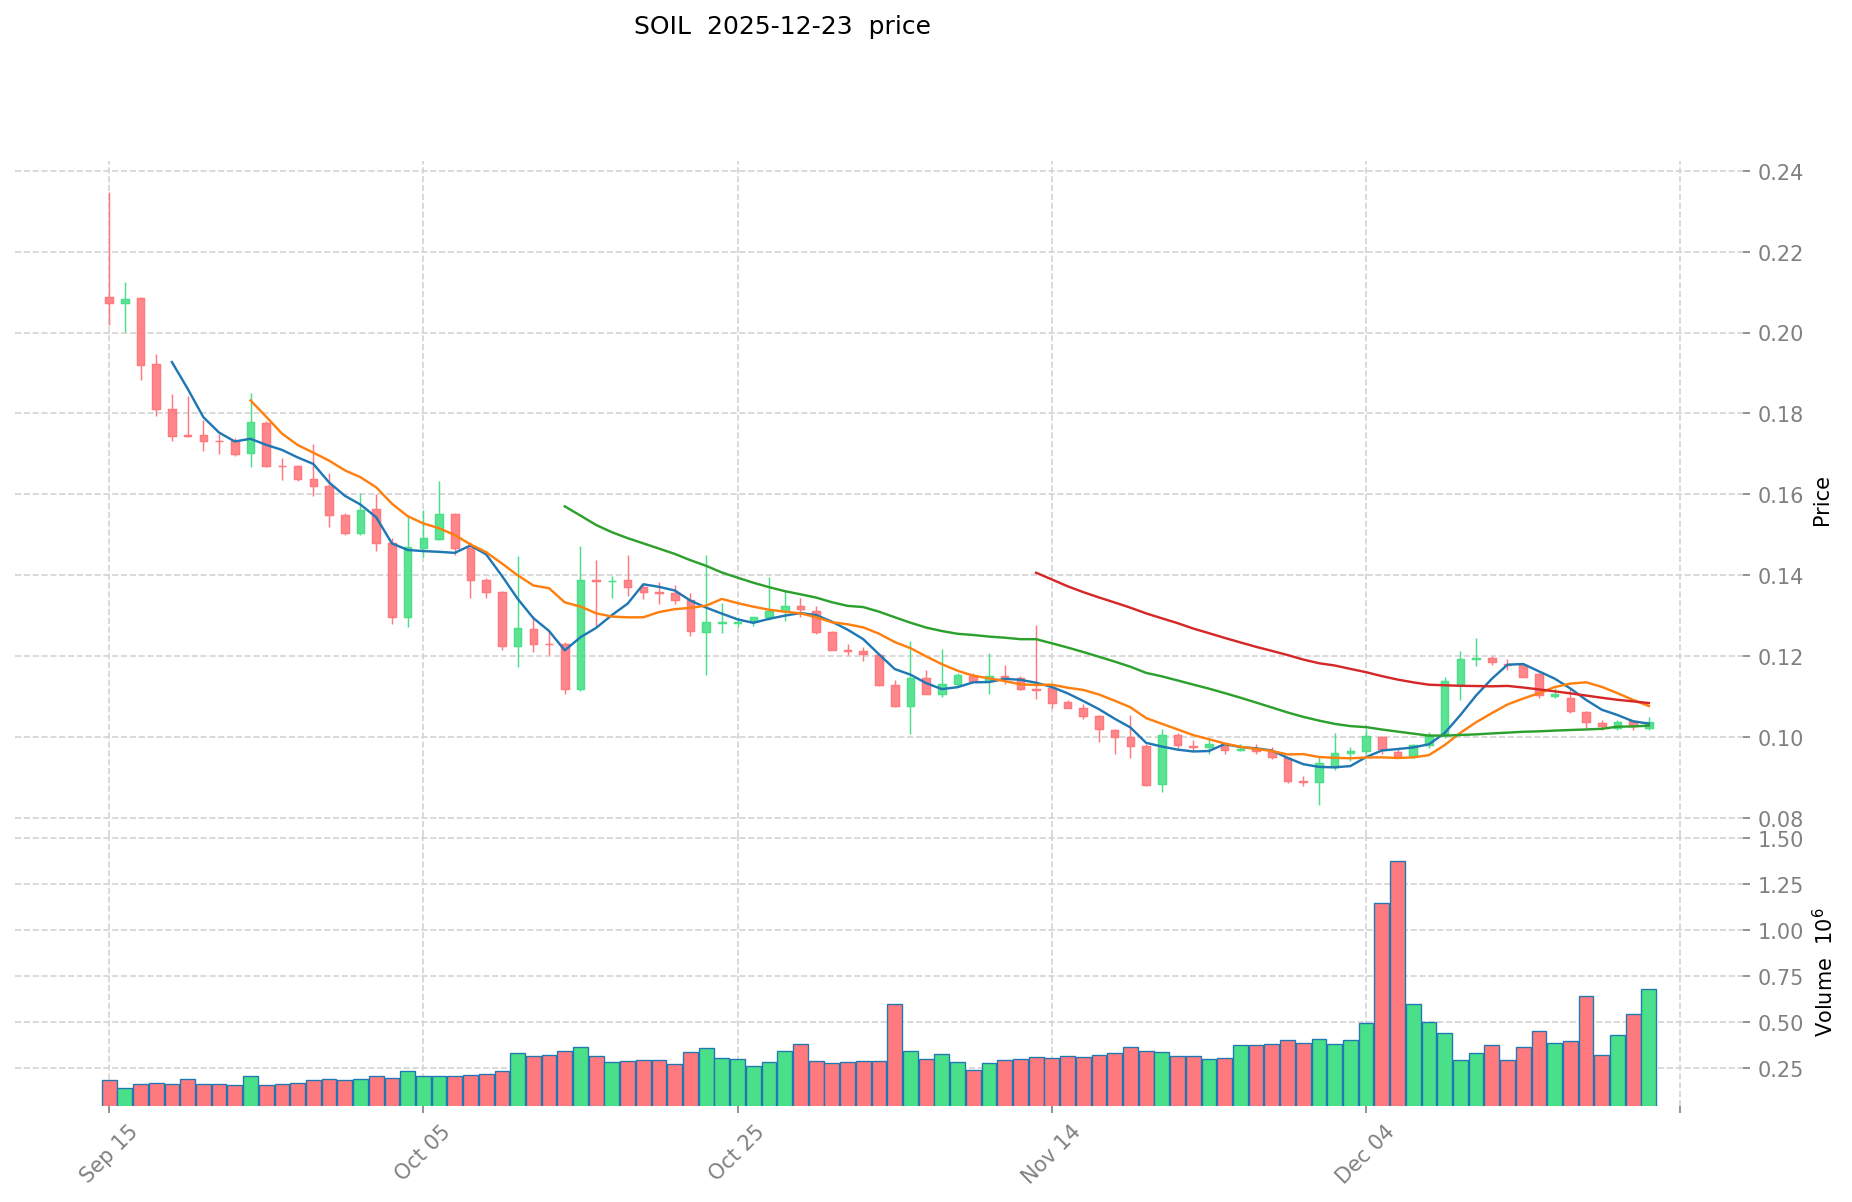
As of December 24, 2025, SOIL is trading at $0.10145, down 0.86% over the past 24 hours and down 7.06% over the past 7 days. The token shows some recovery momentum with a 4.46% gain over the past 30 days. The 24-hour trading volume stands at $102,714.01, with a fully diluted valuation of $10,145,000 and market capitalization of $4,535,797.53.
SOIL has a total supply of 100,000,000 tokens with 44,709,684.90 tokens currently in circulation (44.71% circulating ratio). The protocol is distributed across 4,736 token holders, indicating moderate decentralization. The token is listed on 3 exchanges, with Gate.com being a primary trading venue.
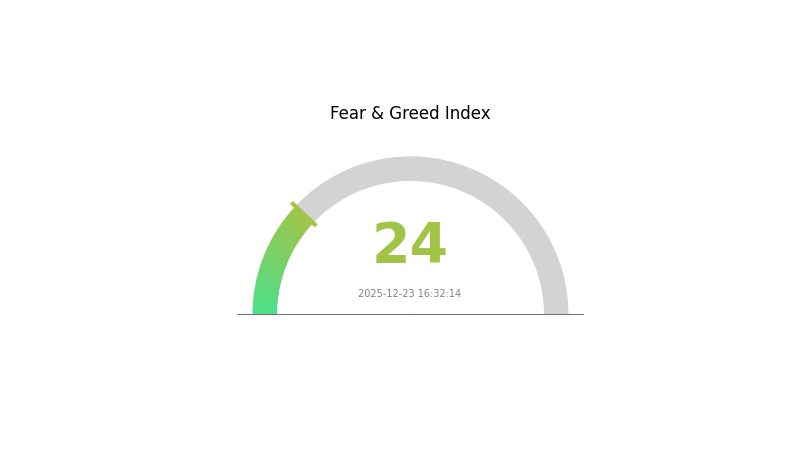
Current market sentiment shows extreme fear with a VIX reading of 24, suggesting heightened volatility and risk aversion in the broader cryptocurrency market.
Click to view current SOIL market price
SOIL Market Sentiment Indicator
2025-12-23 Fear and Greed Index: 24 (Extreme Fear)
Click to view current Fear & Greed Index
The crypto market is experiencing extreme fear with an index reading of 24. This sentiment reflects significant market pessimism and heightened investor anxiety. During such periods, rational investors often view market downturns as potential buying opportunities for long-term positions. However, caution is warranted as further volatility may occur. Monitor key support levels and market developments closely. Consider dollar-cost averaging strategies to mitigate timing risks. Gate.com provides comprehensive market data and analytics tools to help you navigate these turbulent conditions effectively.
SOIL Holdings Distribution
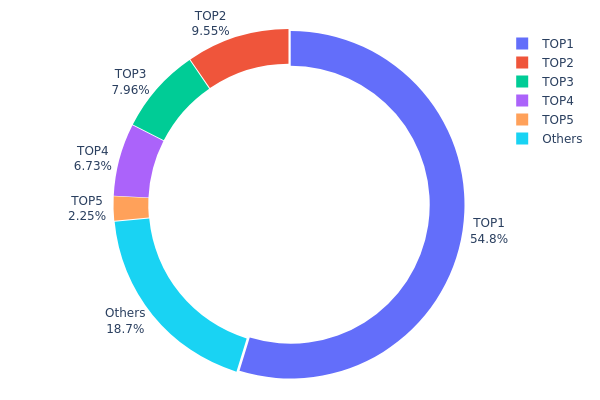
An address holdings distribution map illustrates the concentration of token ownership across the blockchain network by displaying the percentage of total supply held by individual addresses. This metric serves as a critical indicator for assessing market structure, identifying potential concentration risks, and evaluating the decentralization level of a cryptocurrency asset.
The current SOIL holdings data reveals significant concentration concerns, with the top address commanding 54.76% of the circulating supply—a substantially elevated threshold that warrants scrutiny. The top four addresses collectively control 78.99% of total holdings, indicating pronounced centralization within the token ecosystem. This level of concentration suggests that a limited number of stakeholders possess disproportionate influence over the network's token distribution. The remaining addresses, while comprising 18.77% of holdings, are fragmented across numerous smaller holders, reflecting an asymmetrical distribution pattern typical of projects in early or concentrated development phases.
From a market dynamics perspective, such extreme concentration in SOIL introduces material risks regarding price stability and potential manipulation susceptibility. The dominant address holder, maintaining over half the token supply, possesses considerable leverage to influence market sentiment and liquidity conditions through strategic token movements. Price volatility may be amplified by concentrated holders' trading decisions, and the absence of widely distributed ownership limits organic market maturity. The decentralization profile suggests the network currently operates with a relatively centralized governance structure, potentially constraining the project's transition toward true decentralized consensus mechanisms. Monitoring changes in these top address holdings will be essential for assessing whether SOIL progresses toward healthier distribution dynamics over time.
For current SOIL holdings distribution data, visit Gate.com Crypto Holdings
| Top | Address | Holding Qty | Holding (%) |
|---|---|---|---|
| 1 | 0xa5f7...4d1d59 | 54214.93K | 54.76% |
| 2 | 0x8c5e...a75154 | 9456.29K | 9.55% |
| 3 | 0xbd91...5c8e7f | 7876.93K | 7.95% |
| 4 | 0xe516...08a6e8 | 6666.67K | 6.73% |
| 5 | 0x51e3...bc75e0 | 2223.24K | 2.24% |
| - | Others | 18561.94K | 18.77% |
II. Core Factors Influencing SOIL's Future Price
Supply Mechanism
-
Token Distribution: SOIL has a fixed maximum supply of 100,000,000 tokens. As of November 2025, circulating supply stands at 44,476,425.59 SOIL, representing approximately 44.48% of total supply. The remaining tokens are gradually released through the protocol's economic model.
-
Historical Price Performance: SOIL launched on October 10, 2023, at an initial price of $0.18. The token reached its historical peak of $4.00 on March 28, 2024. As of November 2025, the price has adjusted to $0.09754, representing an 84.17% decline from the historical high.
-
Supply Impact on Valuation: The gradual release of remaining tokens into circulation may influence price dynamics. The current significant price correction from peak levels suggests market repricing of the token's value based on supply dynamics and adoption metrics.
Macroeconomic Environment
-
Real-World Asset (RWA) Tokenization Trends: SOIL operates as a blockchain-based lending protocol that bridges traditional finance and the crypto ecosystem. The protocol facilitates a debt market where mature enterprises can obtain financing, while crypto investors earn returns from real-world assets through stablecoin lending. This positions SOIL within the broader RWA tokenization movement, which is gaining significant institutional traction.
-
Market Sentiment Impact: Investor confidence and market sentiment directly influence SOIL's price trajectory. Positive sentiment surrounding widespread SOIL adoption or major technological breakthroughs can drive upward price movement, while negative sentiment may accelerate downside pressure.
-
Regulatory Environment: As a regulated DeFi protocol operating on the Polygon blockchain, SOIL's future price is influenced by regulatory developments in the DeFi and RWA sectors. Favorable regulatory clarity could attract institutional capital, while regulatory headwinds may create uncertainty.
Technology Development and Ecosystem Building
-
Polygon Blockchain Infrastructure: SOIL operates on the Polygon blockchain, leveraging its cost-efficiency and established DeFi infrastructure. The protocol utilizes compliant DeFi mechanisms to provide secure returns for stablecoin investors, positioning itself as a bridge between traditional finance and decentralized systems.
-
Enterprise Financing Integration: SOIL's core value proposition lies in enabling mature enterprises to access decentralized financing while providing crypto investors with real-world asset exposure. The protocol's ability to successfully execute this integration and attract enterprise borrowers will significantly impact future adoption and token valuation.
III. 2025-2030 SOIL Price Forecast
2025 Outlook
- Conservative Forecast: $0.06134 - $0.08176
- Neutral Forecast: $0.08176 - $0.10223
- Optimistic Forecast: $0.10223 - $0.12268
2026-2027 Mid-Term Outlook
- Market Stage Expectation: Recovery and consolidation phase with gradual upward momentum, supported by expanding ecosystem adoption and improving market sentiment.
- Price Range Forecast:
- 2026: $0.10346 - $0.14282 (projected 10% increase)
- 2027: $0.07275 - $0.17869 (projected 25% increase)
- Key Catalysts: Enhanced protocol developments, increased institutional participation, expansion of DeFi applications, and growing community engagement on platforms like Gate.com.
2028-2030 Long-Term Outlook
- Base Case Scenario: $0.14397 - $0.17154 in 2028 (assumption of steady market development and moderate adoption growth)
- Optimistic Scenario: $0.16235 - $0.19807 in 2029 (assumption of accelerated ecosystem expansion and significant technological breakthroughs)
- Transformational Scenario: $0.15858 - $0.26311 in 2030 (extreme favorable conditions including mainstream adoption, major partnership announcements, and substantial increase in network utility and transaction volume)
- 2030-12-24: SOIL at $0.26311 (potential peak under transformational market conditions with 77% cumulative growth trajectory)
| 年份 | 预测最高价 | 预测平均价格 | 预测最低价 | 涨跌幅 |
|---|---|---|---|---|
| 2025 | 0.12268 | 0.10223 | 0.06134 | 0 |
| 2026 | 0.14282 | 0.11245 | 0.10346 | 10 |
| 2027 | 0.17869 | 0.12763 | 0.07275 | 25 |
| 2028 | 0.17154 | 0.15316 | 0.14397 | 50 |
| 2029 | 0.19807 | 0.16235 | 0.14287 | 60 |
| 2030 | 0.26311 | 0.18021 | 0.15858 | 77 |
Soil (SOIL) Investment Strategy and Risk Management Report
IV. SOIL Professional Investment Strategy and Risk Management
SOIL Investment Methodology
(1) Long-term Holding Strategy
- Target Investors: Risk-averse institutional investors and retail investors seeking stable yield exposure to Real World Assets
- Operation Recommendations:
- Accumulate SOIL tokens during market downturns when sentiment is negative, capitalizing on the -85.63% year-over-year decline that may present entry opportunities for long-term believers in the RWA lending model
- Dollar-cost averaging (DCA) into SOIL positions over 6-12 month periods to reduce timing risk and benefit from potential mean reversion as the protocol matures
- Hold SOIL through protocol governance participation and staking opportunities as they become available, enabling exposure to protocol growth without active trading
(2) Active Trading Strategy
- Technical Analysis Observations:
- Price Volatility Bands: SOIL trades between 24-hour high of $0.10431 and low of $0.10135, indicating tight intraday ranges suitable for swing trading around support/resistance levels established by the all-time high ($4.00) and all-time low ($0.04)
- Trend Momentum: Current -0.86% 24-hour decline and -7.06% 7-day decline suggest downtrend momentum; traders should monitor for reversal signals before initiating long positions
- Wave Trading Key Points:
- Entry Signals: Consider accumulation when price stabilizes above the 200-day moving average or shows positive divergence on volume indicators
- Exit Strategy: Set stop-losses at 2-3% below recent support levels and take profits at resistance points identified by historical price actions
SOIL Risk Management Framework
(1) Asset Allocation Principles
- Conservative Investors: 1-2% of portfolio allocation to SOIL due to its speculative nature and high volatility (-85.63% YoY)
- Active Investors: 3-5% portfolio allocation for investors comfortable with DeFi protocol exposure and RWA market development
- Professional Investors: 5-10% allocation with sophisticated position sizing based on RWA market growth thesis and protocol governance participation strategies
(2) Risk Hedging Solutions
- Diversification Approach: Combine SOIL holdings with stablecoin allocations through the protocol itself, using Soil's lending platform to earn yield on stablecoins while maintaining downside protection
- Correlation Hedging: Balance SOIL token positions with other DeFi protocol tokens or blue-chip cryptocurrencies that exhibit lower correlation to emerging RWA platforms
(3) Secure Storage Solutions
- Custody Options: Self-custody through private wallet management on Polygon network using standard Ethereum-compatible wallets
- Security Best Practices: Enable hardware security key authentication, use multi-signature arrangements for large holdings, and maintain offline backup of recovery phrases
- Security Considerations: Soil operates on Polygon (MATIC) network; ensure network selection accuracy when conducting transactions to avoid funds misdirection
V. SOIL Potential Risks and Challenges
SOIL Market Risk
- Severe Valuation Decline: The token has depreciated 85.63% over one year, declining from $4.00 ATH to current $0.10145, indicating potential persistent market skepticism toward the protocol or RWA lending model adoption challenges
- Liquidity Constraints: Daily trading volume of $102,714 is relatively modest for a protocol with $10.1M market cap, creating potential slippage on larger trades and making exit difficult during market stress
- Market Sentiment Erosion: Only 4,736 token holders suggests limited retail adoption and community growth, creating concentration risk and potential selling pressure from early investors
SOIL Regulatory Risk
- Regulatory Uncertainty for RWA Platforms: Real World Assets lending protocols operate at the intersection of traditional finance and cryptocurrency, facing evolving regulatory frameworks across jurisdictions
- Stablecoin Regulatory Exposure: As Soil facilitates stablecoin lending against RWA collateral, potential regulatory restrictions on stablecoins could directly impact protocol utility and demand
- Traditional Finance Bridge Compliance: The protocol's positioning as a traditional finance bridge creates potential compliance obligations under securities laws, anti-money laundering regulations, and financial services licensing requirements
SOIL Technical Risk
- Smart Contract Vulnerability: As a DeFi protocol, Soil faces standard smart contract audit risk; any undetected vulnerabilities could result in protocol exploits or fund loss
- Collateral Management Risk: The protocol's reliance on RWA collateral valuation depends on accurate off-chain pricing mechanisms, creating potential for collateral quality degradation or pricing manipulation
- Liquidity Provision Challenges: The protocol must maintain sufficient capital efficiency to incentivize stablecoin lending; inadequate yields or capital inefficiency could reduce user participation
VI. Conclusion and Action Recommendations
SOIL Investment Value Assessment
Soil represents an innovative positioning in the Real World Assets (RWA) DeFi sector, attempting to bridge traditional corporate debt markets with crypto-native capital markets. The protocol's value proposition—enabling institutional companies to access decentralized financing while providing crypto investors with RWA-backed yield—addresses a significant market need. However, the project faces substantial headwinds evidenced by its 85.63% year-over-year depreciation, limited token holder base of 4,736, and modest trading liquidity. The market's current valuation reflects significant skepticism regarding protocol-market fit, regulatory feasibility, and investor demand for RWA lending products. Long-term viability depends critically on achieving meaningful corporate debt issuance, protocol security validation, and regulatory clarity for RWA platforms.
SOIL Investment Recommendations
✅ Beginners: Approach Soil as a speculative research position rather than core portfolio holding. Limit exposure to 1% of trading capital or less, and only allocate funds you can afford to lose completely. Use this position to gain exposure to the RWA thesis while learning about DeFi lending protocols.
✅ Experienced Investors: Consider position sizing of 3-5% for investors with strong conviction on RWA market adoption and protocols bridging traditional finance. Deploy capital through dollar-cost averaging rather than lump-sum purchases to manage timing risk. Monitor tokenomics, governance decisions, and protocol-level metrics for signals of improving utilization.
✅ Institutional Investors: Evaluate Soil as part of broader RWA infrastructure thesis but conduct thorough due diligence on regulatory compliance, smart contract audits, and collateral management frameworks before committing capital. Engage directly with the protocol team regarding compliance roadmap and traditional finance partnerships.
SOIL Trading Participation Methods
- Direct Token Trading: Purchase SOIL through Gate.com against stablecoin pairs such as USDT or USDC, providing access to current market liquidity
- Protocol Interaction: Engage directly with the Soil protocol on Polygon network by lending stablecoins against corporate debt instruments, capturing protocol revenue while accumulating deeper protocol knowledge
- Governance Participation: As protocol governance evolves, token holders may participate in protocol parameter setting, fee structure decisions, and strategic direction determination
Cryptocurrency investment carries extreme risk. This report does not constitute investment advice. Investors should make decisions based on their individual risk tolerance and financial situation. Always consult with a professional financial advisor before investing in digital assets. Never invest more than you can afford to lose completely.
FAQ
What is the price prediction for soilverse coin?
Soilverse coin is predicted to potentially reach $0.2810 by 2030, representing a possible 173.66% increase from current levels. Price forecasts suggest trading within $0.07062 to $0.2810 range based on market analysis.
What factors influence SOIL token price movements?
SOIL token price is influenced by blockchain network activity, market demand, developer adoption in DeFi and Web3, trading volume, and broader cryptocurrency market trends. Ecosystem growth and utility expansion also drive price movements.
Is SOIL a good investment for long-term holders?
SOIL demonstrates strong long-term potential with growing adoption in the DeFi ecosystem. For committed holders, SOIL offers compelling opportunities as the platform expands its technological capabilities and market presence.
What is the current market cap and circulating supply of SOIL?
The current market cap of SOIL is $4,454,782 USD, with a circulating supply of 43,577,702 SOIL coins. The project maintains a healthy supply distribution supporting its market valuation.
What are the main risks associated with SOIL price volatility?
SOIL price volatility risks include market fluctuations from supply-demand imbalances, regulatory changes affecting agricultural sectors, liquidity constraints during extreme movements, and macroeconomic factors influencing commodity prices.
Share
Content
Introduction: SOIL's Market Position and Investment Value
I. SOIL Price History Review and Current Market Status
II. Core Factors Influencing SOIL's Future Price
III. 2025-2030 SOIL Price Forecast
IV. SOIL Professional Investment Strategy and Risk Management
V. SOIL Potential Risks and Challenges
VI. Conclusion and Action Recommendations
FAQ
How to Buy Cryptocurrency


Trending Cryptocurrencies


How Does WLFI Compare to Its Competitors in Performance, Market Cap, and User Base?

Gate GUSD: A new stable income option backed by real assets

GUSD: Gate's RWA supported stablecoin, used for stable Crypto Assets returns in 2025.

GUSD: A secure stablecoin investment for low-risk Crypto Assets returns in 2025

2025 LUMIA Price Prediction: Future Value Analysis and Market Trends for Investors

2025 CRVPrice Prediction: Analyzing Market Trends, Adoption Metrics, and Key Factors Driving Curve DAO Token Valuation
How Does Chainlink (LINK) Price Volatility Compare to Bitcoin and Ethereum in 2026?
How Does GTETH Price Volatility Compare to ETH: Support and Resistance Analysis in 2026?

What Does ADA Technical Analysis Reveal: MACD Death Cross and RSI Signals Explained

How Do MACD and RSI Indicators Signal ZORA Price Recovery in 2025?
What are the key derivatives market signals for crypto trading in 2026: futures open interest, funding rates, and liquidation data explained