2025 SHARDS Price Prediction: Analyzing Market Trends and Future Potential for the Digital Asset
Introduction: Market Position and Investment Value of SHARDS
SHARDS, the native token of WorldShards, serves as the core resource of the Web3 MMORPG economy that combines traditional MMORPG gameplay with blockchain-based NFT ownership benefits across PC, mobile, and console platforms. As a fair-launch token with no allocation to team or investors, SHARDS represents a purely community-driven digital asset. As of January 2026, SHARDS maintains a market capitalization of approximately $1,343,000 with a circulating supply of over 413 million tokens, currently trading at $0.0002686. This innovative gaming token is playing an increasingly important role in the Web3 gaming ecosystem, supported by impressive community metrics including over 400,000 community members, $8.9 million in NFT sales, and more than 3.1 million hours of user engagement.
This article will comprehensively analyze SHARDS price trends from 2026 through 2031, integrating historical price patterns, market supply-demand dynamics, ecosystem development, and macroeconomic factors to provide investors with professional price forecasts and practical investment strategies. Through on-chain data analysis and fundamental assessment, we aim to equip investors with the insights necessary to navigate SHARDS' market opportunities and risks in the evolving Web3 gaming landscape.
SHARDS Price Analysis Report
I. SHARDS Price History Review and Market Status
SHARDS Historical Price Evolution
- September 2025: All-Time High (ATH) reached at $0.062, marking the peak of the token's market performance.
- January 2026: All-Time Low (ATL) recorded at $0.0002572 on January 3, 2026, representing a significant decline of approximately 99.13% from its ATH.
SHARDS Current Market Dynamics
As of January 3, 2026, SHARDS is trading at $0.0002686, reflecting a 24-hour price decline of 13.1% and a 7-day decline of 25.81%. The token has experienced severe downward pressure over the past month with a 30-day decline of 89.24%.
Key Market Metrics:
- Current Price: $0.0002686
- 24-Hour Range: $0.0002572 - $0.0003145
- Market Capitalization: $111,033.29
- Fully Diluted Valuation: $1,343,000
- 24-Hour Trading Volume: $17,560.29
- Circulating Supply: 413,377,839 SHARDS (8.27% of total supply)
- Total Supply: 5,000,000,000 SHARDS
- Market Dominance: 0.000041%
- Active Holders: 199
- Exchange Listings: 8
Price Momentum Analysis:
The token shows mixed short-term signals with a 1-hour gain of 4.73%, but this is significantly outweighed by broader negative trends across multiple timeframes. The 1-year performance of -99.13% indicates severe value erosion since the token's launch period around September 2025.
Check current SHARDS market price

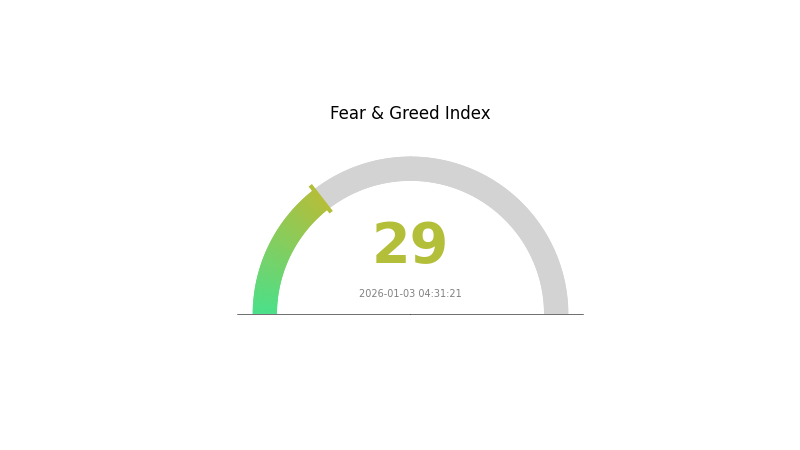
SHARDS Market Sentiment Index
2026-01-03 Fear and Greed Index: 29 (Fear)
Click to view current Fear & Greed Index
The cryptocurrency market is currently experiencing a fear sentiment with the Fear and Greed Index reading at 29, indicating heightened market anxiety. This level suggests investors are adopting a cautious stance, potentially creating both risks and opportunities in the market. During fear-driven periods, experienced traders often view significant price dips as potential entry points for long-term positions. However, it remains crucial to conduct thorough research and implement proper risk management strategies. Monitor market developments closely on Gate.com to identify optimal trading opportunities aligned with your investment objectives.
SHARDS Holdings Distribution
The address holdings distribution chart illustrates the concentration of token ownership across blockchain addresses, serving as a critical metric for assessing the decentralization level and potential market vulnerability of a cryptocurrency asset. By tracking the percentage of total supply held by individual addresses, this distribution reveals the power dynamics within the network and provides insights into price stability and manipulation risks.
The SHARDS token exhibits pronounced concentration characteristics, with the top address commanding an overwhelming 81.28% of the total supply, representing approximately 2.5 billion tokens. This extreme concentration is further amplified when considering the top five addresses collectively, which control 98.25% of all SHARDS in circulation. Such distribution patterns indicate a highly centralized ownership structure, where decision-making power and market influence are concentrated among a minimal number of stakeholders. The remaining addresses account for merely 1.75% of the supply, reflecting a fragmented retail holder base with minimal individual influence on market dynamics.
This degree of centralization presents notable implications for market structure and price discovery mechanisms. The dominant holder possesses sufficient capital reserves to execute substantial transactions capable of inducing significant price volatility, whether through coordinated liquidation events or strategic position adjustments. The limited distribution among remaining addresses reduces organic buying pressure and market resilience, potentially rendering SHARDS susceptible to adverse price movements triggered by large holder actions. From a long-term sustainability perspective, such concentrated ownership structures typically correlate with elevated governance risks and reduced resistance to potential market manipulation scenarios.
Click to view current SHARDS Holdings Distribution
| Top | Address | Holding Qty | Holding (%) |
|---|---|---|---|
| 1 | 0x3de3...8f62f6 | 2500000.00K | 81.28% |
| 2 | 0xf89d...5eaa40 | 311243.04K | 10.11% |
| 3 | 0xa957...fcd7af | 100000.00K | 3.25% |
| 4 | 0x4695...fd7d37 | 66633.52K | 2.16% |
| 5 | 0x0d07...b492fe | 44695.65K | 1.45% |
| - | Others | 53080.88K | 1.75% |
II. Core Factors Influencing SHARDS' Future Price
Market Trends and Investor Sentiment
-
Market Sensitivity: SHARDS prices are highly sensitive to overall market trends. As a cryptocurrency asset, price movements are significantly influenced by broader market conditions and investment environment shifts.
-
Competitive Landscape: The competitive positioning of SHARDS relative to similar projects plays a crucial role in price determination. Evaluating how SHARDS compares to competing platforms and projects is essential for understanding its valuation trajectory.
-
News Events Impact: News events significantly influence SHARDS price movements as they affect investor sentiment and often reflect wider market trends that impact asset valuations.
Technical and Market Analysis
-
Historical Price Patterns: Technical analysis of historical price patterns and trading volume provides insights into potential SHARDS price movements, helping traders identify opportunities in the volatile cryptocurrency market.
-
Regulatory Changes: Regulatory developments and policy shifts can substantially impact SHARDS' price dynamics, creating both headwinds and tailwinds for the asset's performance.
-
Technology Updates: Technological advancements and protocol improvements influence market perception and investor confidence in the SHARDS ecosystem.
Holder Distribution Dynamics
- Holder Base Growth: Understanding who holds SHARDS is critical for analyzing price movements. An increasing number of holders may signal growing confidence, while concentration among large holders could indicate vulnerability to price volatility through whale activity and potential liquidations.
III. 2026-2031 SHARDS Price Forecast
2026 Outlook
- Conservative Forecast: $0.00017 - $0.00024
- Neutral Forecast: $0.00028
- Optimistic Forecast: $0.00031 (requires sustained market recovery and increased institutional adoption)
2027-2029 Medium-term Outlook
- Market Phase Expectation: Gradual accumulation phase with potential volatility correction, followed by renewed upward momentum driven by ecosystem development and market sentiment improvement.
- Price Range Forecast:
- 2027: $0.00021 - $0.00038
- 2028: $0.00028 - $0.00036
- 2029: $0.00026 - $0.00042
- Key Catalysts: Enhanced blockchain utility, ecosystem expansion, potential integration with major platforms, market-wide liquidity improvements, and strengthened tokenomic fundamentals.
2030-2031 Long-term Outlook
- Base Case: $0.00024 - $0.00042 (assuming steady adoption curve and moderate market growth)
- Optimistic Case: $0.00032 - $0.00042 (assuming accelerated ecosystem maturation and positive macro conditions)
- Transformative Case: $0.00038 - $0.00042+ (assuming breakthrough adoption, major partnership announcements, or significant protocol upgrades)
- January 3, 2026: SHARDS at $0.00028 (consolidation phase with 2% year-to-date adjustment)
| 年份 | 预测最高价 | 预测平均价格 | 预测最低价 | 涨跌幅 |
|---|---|---|---|---|
| 2026 | 0.00031 | 0.00028 | 0.00017 | 2 |
| 2027 | 0.00038 | 0.00029 | 0.00021 | 9 |
| 2028 | 0.00036 | 0.00034 | 0.00028 | 25 |
| 2029 | 0.00042 | 0.00035 | 0.00026 | 29 |
| 2030 | 0.00042 | 0.00038 | 0.00024 | 42 |
| 2031 | 0.00042 | 0.0004 | 0.00032 | 49 |
WorldShards (SHARDS) Investment Strategy & Risk Management Report
IV. SHARDS Professional Investment Strategy and Risk Management
SHARDS Investment Methodology
(1) Long-Term Holding Strategy
-
Target Audience: Community-driven investors with long-term conviction in Web3 gaming and blockchain-based digital ownership models.
-
Operation Recommendations:
- Accumulate during price dips below $0.0003 by setting limit orders on Gate.com to dollar-cost average your entry position over multiple purchases.
- Hold tokens through market volatility cycles, recognizing that SHARDS as a fair-launch token with no team or investor allocation aligns incentives with community holders.
- Actively participate in the WorldShards ecosystem by engaging with the 400,000+ community members to understand product development roadmap and token utility evolution.
-
Storage Solutions:
- Use Gate.com's secure Web3 wallet for frequent trading with two-factor authentication enabled.
- For large holdings, consider moving tokens to self-custody solutions with strong security protocols after becoming familiar with wallet management best practices.
(2) Active Trading Strategy
-
Technical Analysis Tools:
- Gate.com Price Charts: Monitor the 1-hour timeframe to identify entry points after the token recovered 4.73% in the last hour, watching for support levels near recent lows of $0.0002572.
- Volume Analysis: Track the 24-hour trading volume of approximately 17,560 SHARDS to identify liquidity events and potential breakout opportunities.
-
Swing Trading Considerations:
- Note the significant 30-day decline of -89.24% and 1-year decline of -99.13%, indicating extreme volatility requiring strict risk management protocols.
- Utilize tight stop-loss orders at 5-10% below entry positions given the token's highly volatile price history ranging from $0.062 ATH to current lows.
SHARDS Risk Management Framework
(1) Asset Allocation Principles
- Conservative Investors: 1-2% portfolio allocation maximum, focusing on minimal exposure to highly speculative gaming tokens.
- Active Investors: 3-5% portfolio allocation, with clear entry/exit strategies and defined loss thresholds.
- Professional Investors: 5-10% allocation only after comprehensive due diligence on gaming adoption metrics and competitive positioning.
(2) Risk Hedging Approaches
- Position Sizing Discipline: Never allocate more than 5% of liquid assets to SHARDS given the -99.13% year-to-date decline, with strict rebalancing triggers when positions exceed target allocation.
- Profit-Taking Strategy: Implement systematic profit-taking at predetermined price levels above entry costs, particularly given the 4.73% hourly recovery from multi-month lows.
(3) Secure Storage Solutions
- Web3 Wallet Recommendation: Gate.com Web3 Wallet offers streamlined token management with built-in security features suitable for active traders requiring frequent accessibility.
- Self-Custody Approach: For significant holdings, transfer tokens to personal wallets after thorough security training, maintaining offline backup of private keys in secure locations.
- Security Precautions: Never share private keys or seed phrases; enable hardware-backed security features where available; verify contract addresses directly via Etherscan before transactions; conduct test transactions with small amounts before large transfers.
V. SHARDS Potential Risks and Challenges
SHARDS Market Risk
- Extreme Price Volatility: The token experienced a catastrophic -99.13% decline over 12 months and -89.24% over 30 days, demonstrating extreme price instability that can result in permanent capital loss.
- Low Market Liquidity: With only 8 trading venues and approximately 199 token holders, SHARDS faces limited trading infrastructure and potential illiquidity during market stress events, creating execution risk for exit strategies.
- Market Cap Decline: The fully diluted market cap of $1,343,000 represents minimal capitalization for a global gaming project, indicating insufficient market validation and heightened risk of further depreciation.
SHARDS Regulatory Risk
- Evolving Gaming Regulatory Framework: As Web3 gaming operates in ambiguous regulatory territories globally, future legislation regarding NFT ownership, token economics, and gaming mechanics could adversely impact project viability and token value.
- Securities Classification Uncertainty: Depending on jurisdiction, SHARDS tokens could face reclassification as securities, triggering compliance obligations and potential restrictions on distribution or trading.
- Cross-Border Compliance Challenges: WorldShards' multi-platform deployment (PC/Mobile/Consoles) across various jurisdictions creates complex regulatory compliance requirements that could delay development or limit market access.
SHARDS Technical Risk
- Smart Contract Vulnerability: As an ERC-20 token deployed on Ethereum, potential security vulnerabilities in the contract code could expose holder funds to theft or loss, requiring professional security audits verification.
- Platform Dependency: The project's reliance on Ethereum mainnet execution creates exposure to network congestion, transaction failures, and escalating gas fees during peak usage periods.
- Development Execution Risk: The need to deliver consistent gaming content, NFT functionality, and blockchain integration across PC, mobile, and console platforms presents significant technical execution challenges with uncertain timelines.
VI. Conclusions and Action Recommendations
SHARDS Investment Value Assessment
WorldShards represents an early-stage Web3 MMORPG attempting to bridge traditional gaming engagement with blockchain-based ownership mechanics. The project demonstrates community traction with 400,000+ participants and over $8.9 million in NFT sales, supported by experienced gaming advisors. However, the token's catastrophic -99.13% yearly decline, minimal market capitalization of $1.3 million, and extreme volatility reflect significant market skepticism regarding current valuations. The fair-launch token mechanism without team allocation removes certain conflict-of-interest concerns, yet the nascent state of Web3 gaming economics and unproven long-term player retention create substantial uncertainty. Investment should be approached as speculative exposure to high-risk gaming sector innovation rather than as yield-generating or stable wealth preservation vehicles.
SHARDS Investment Recommendations
✅ Beginners: Avoid direct investment until gaining substantial Web3 gaming and cryptocurrency market experience; if interested, allocate no more than 0.5% of total portfolio to a single purchase on Gate.com with a defined exit strategy based on percentage loss thresholds.
✅ Experienced Investors: Consider 2-3% portfolio allocation only after detailed analysis of WorldShards' player retention metrics, revenue generation, and competitive position within Web3 gaming; use dollar-cost averaging over 3-6 months rather than lump-sum purchases given extreme volatility.
✅ Institutional Investors: Conduct comprehensive due diligence on development roadmap execution, platform adoption trajectories, and regulatory compliance frameworks before committing capital; maintain strict position sizing limits (under 5%) and establish clear performance-based exit criteria.
SHARDS Trading Participation Methods
- Gate.com Direct Trading: Access SHARDS through Gate.com's trading interface with real-time price data, order management, and integrated wallet functionality for seamless buy/sell execution.
- Community-Based Engagement: Participate in WorldShards Discord community to gain development insights, early product access through 310+ million hours of cumulative gameplay data, and alignment with project evolution before making larger capital commitments.
- NFT Marketplace Participation: Explore WorldShards NFT sales directly through the official game platform to combine gaming participation with asset ownership, leveraging the $8.9+ million trading history to understand valuation trends.
Cryptocurrency investment carries extreme risk of capital loss. This report does not constitute investment advice. All investors must conduct independent due diligence aligned with personal risk tolerance and financial circumstances. Consult qualified financial advisors before making investment decisions. Never invest capital you cannot afford to lose completely.
FAQ
What is SHARDS token and what is its use case?
SHARDS is the core token of WorldShards' player-driven economy, enabling NFT upgrades and powering the play-to-earn gaming model. It facilitates in-game transactions and rewards for active players.
What factors influence SHARDS price movements?
SHARDS price movements are primarily influenced by market demand, trading volume, overall cryptocurrency market trends, project developments, and investor sentiment toward the Shards ecosystem.
What is the price prediction for SHARDS in 2024/2025?
SHARDS is predicted to reach approximately $0.010246 by 2025, with a price range between $0.007787 and $0.010246 based on current market trends and technical analysis.
What are the risks and volatility considerations for SHARDS investment?
SHARDS exhibits high volatility typical of cryptocurrency assets, with risks including market price fluctuations, regulatory changes, and liquidity variations. Investors should employ diversification, position sizing, and risk management strategies to mitigate potential losses in this dynamic market environment.
How does SHARDS compare to other similar tokens in the market?
SHARDS features 33 million tradable tokens with competitive market performance. Compared to similar Animoca Brands Portfolio tokens gaining 13.40%, SHARDS demonstrates strong market positioning and solid fundamentals in the token ecosystem.
What is the historical price performance and trading volume of SHARDS?
SHARDS is currently trading at $0.000353 with a 24-hour trading volume of $219,565.68. The token has demonstrated consistent market activity and liquidity in recent trading periods.
Share
Content
Introduction: Market Position and Investment Value of SHARDS
I. SHARDS Price History Review and Market Status
II. Core Factors Influencing SHARDS' Future Price
III. 2026-2031 SHARDS Price Forecast
IV. SHARDS Professional Investment Strategy and Risk Management
V. SHARDS Potential Risks and Challenges
VI. Conclusions and Action Recommendations
FAQ
How to Buy Cryptocurrency


Trending Cryptocurrencies


Is ALICE (ALICE) a good investment?: Analyzing the Potential and Risks of This Gaming Token in Today's Crypto Market

2025 RON Price Prediction: Analyzing Potential Growth and Market Factors for Ronin Network's Native Token

2025 PYRPrice Prediction: Analyzing Market Trends and Key Factors Influencing Vulcan Forged's Native Token
Is Vulcan Forged (PYR) a Good Investment?: Analyzing the Potential of This Gaming Cryptocurrency in Today's Market
2025 ALICEPrice Prediction: Analyzing Future Market Trends and Growth Potential for My Neighbor Alice Token
Is Enjin Coin (ENJ) a good investment?: Analyzing the potential of this gaming cryptocurrency in 2023
GPUAI vs XRP: Which Cryptocurrency Offers Better Investment Potential in the AI and Blockchain Era?
MA vs ETC: A Comprehensive Comparison of Moving Averages and Exponential Time Constants in Technical Analysis

Understanding Spot Balance on a Cryptocurrency Exchange
Cooin Wallet: A Comprehensive Guide to Secure Crypto Management
What Is a Market Order?