2025 SBR Price Prediction: Analyzing Market Trends and Potential Growth Factors for SBR Token
Introduction: SBR's Market Position and Investment Value
Saber (SBR), as a leading cross-chain stablecoin exchange on Solana, has made significant contributions to the DeFi ecosystem since its inception in 2021. As of 2025, Saber's market capitalization stands at $2,183,306, with a circulating supply of approximately 2,245,275,630 tokens, and a price hovering around $0.0009724. This asset, often referred to as the "Solana's liquidity backbone," is playing an increasingly crucial role in facilitating cross-chain asset transfers and providing liquidity for stablecoins.
This article will comprehensively analyze Saber's price trends from 2025 to 2030, considering historical patterns, market supply and demand, ecosystem development, and macroeconomic factors to provide investors with professional price predictions and practical investment strategies.
I. SBR Price History Review and Current Market Status
SBR Historical Price Evolution Trajectory
- 2021: SBR reached its all-time high of $0.960362 on September 10, marking a significant milestone for the token
- 2023: SBR hit its all-time low of $0.00052473 on June 16, indicating a substantial market correction
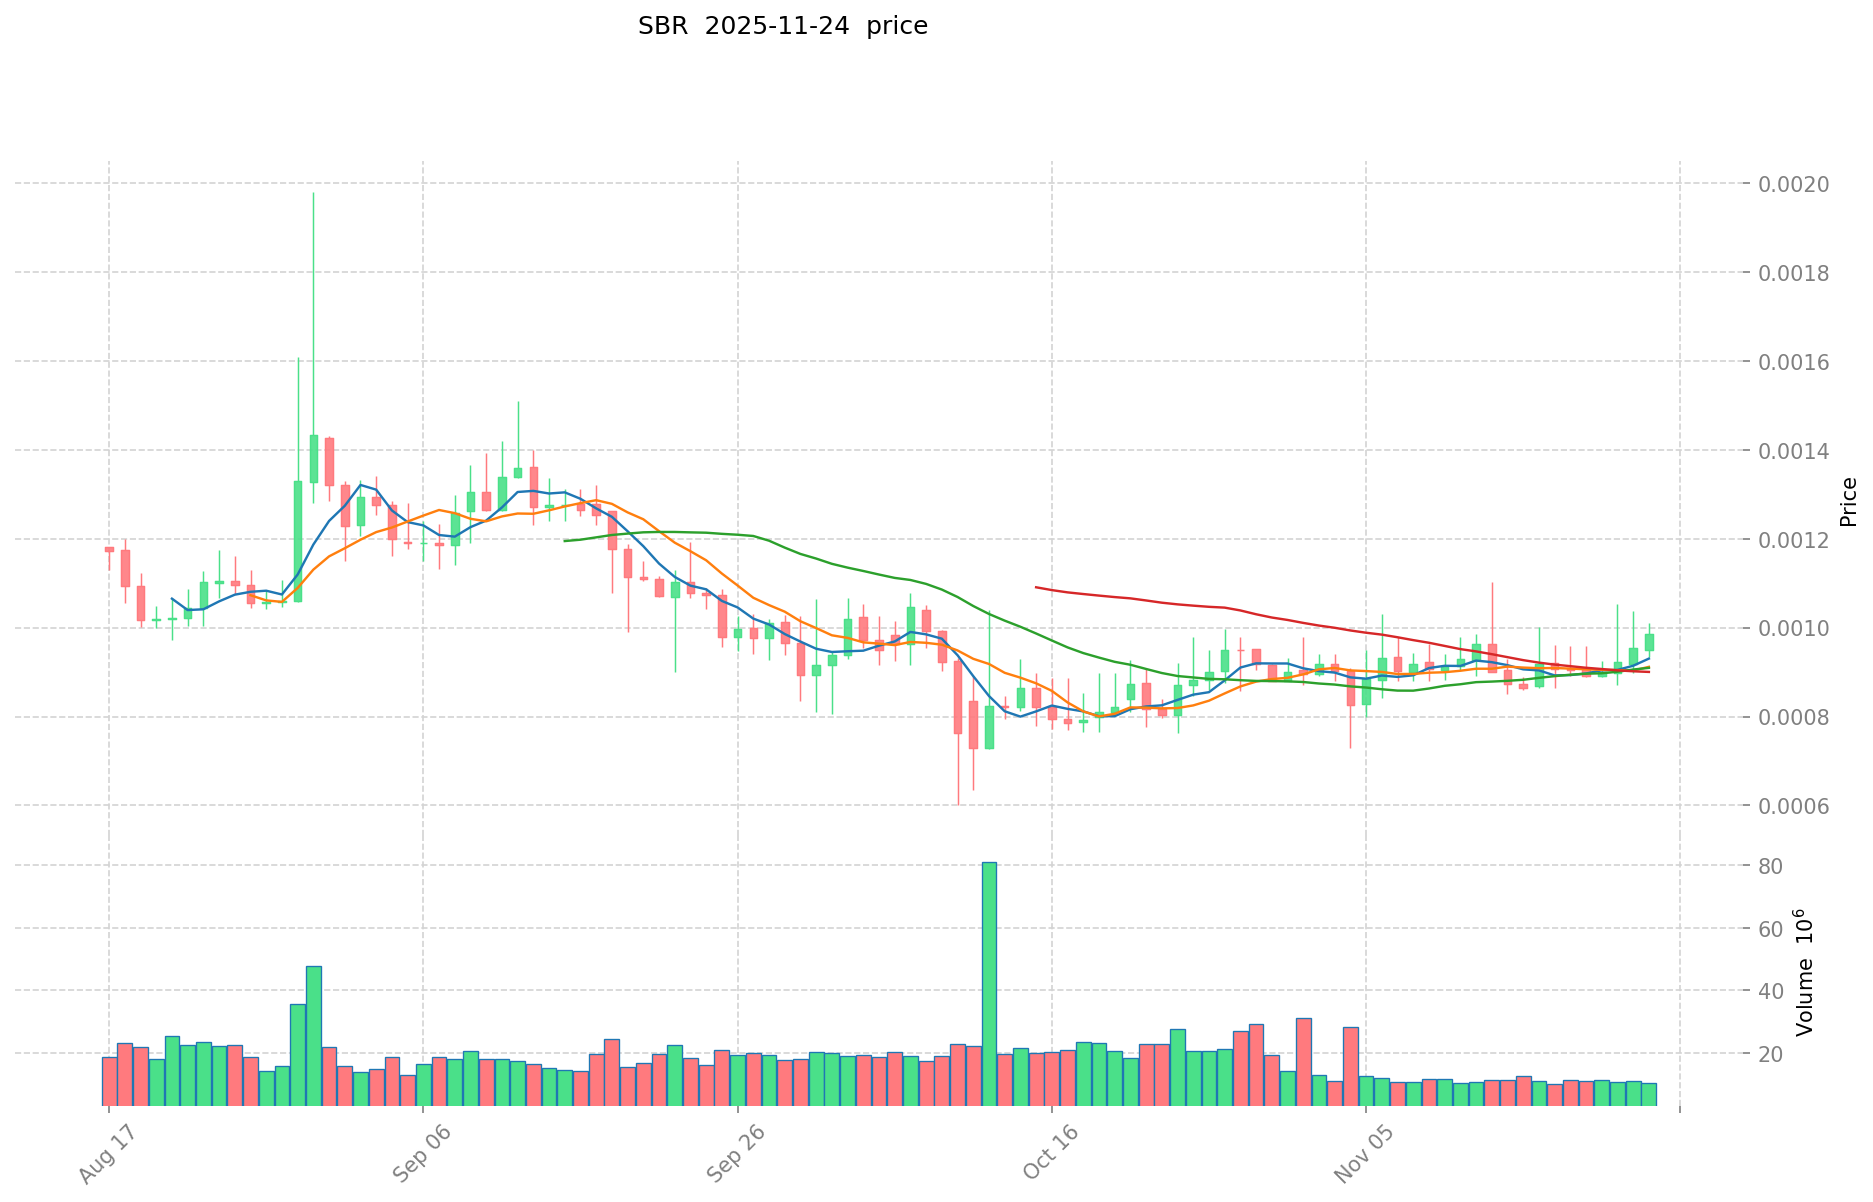
- 2025: SBR has shown signs of recovery, with the price currently at $0.0009724
SBR Current Market Situation
As of November 24, 2025, SBR is trading at $0.0009724. The token has experienced a slight decline of 1.41% in the past 24 hours, with a trading volume of $10,560.80. SBR's market capitalization stands at $2,183,306, ranking it at 2107 in the overall cryptocurrency market. Despite the recent short-term dip, SBR has shown positive momentum over longer periods, with a 5.68% increase over the past week and a 9.17% gain over the last 30 days. However, the token is still down 55.13% compared to its price one year ago, reflecting the broader market trends and challenges faced by many cryptocurrencies during this period.
Click to view the current SBR market price
SBR Market Sentiment Indicator
2025-11-24 Fear and Greed Index: 19 (Extreme Fear)
Click to view the current Fear & Greed Index
The crypto market is currently experiencing a period of extreme fear, with the Fear and Greed Index plummeting to 19. This level of pessimism often signals a potential buying opportunity for contrarian investors. However, it's crucial to approach with caution and conduct thorough research before making any investment decisions. Remember, market sentiment can shift rapidly, and what seems like fear today could turn into opportunity tomorrow. Stay informed and consider diversifying your portfolio to mitigate risks in these volatile times.

SBR Holdings Distribution
The address holdings distribution chart for SBR reveals a significant concentration of tokens among the top holders. The top 5 addresses collectively control 49.32% of the total supply, with the largest holder possessing 15.15% of all tokens. This level of concentration indicates a relatively centralized distribution pattern.
Such a concentrated holding structure could potentially impact market dynamics. The presence of large holders may introduce volatility risks, as significant sell-offs by these addresses could exert substantial downward pressure on the token price. Conversely, accumulation by these major holders could lead to price surges. This concentration also raises concerns about the potential for market manipulation.
From a broader perspective, this distribution pattern suggests a lower degree of decentralization for SBR. While 50.68% of tokens are held by addresses outside the top 5, the influence of major holders on governance decisions and overall token economics remains substantial. This structure underscores the importance of monitoring large address movements for potential market impacts and emphasizes the need for increased distribution to enhance network resilience and token stability.
Click to view the current SBR Holdings Distribution

| Top | Address | Holding Qty | Holding (%) |
|---|---|---|---|
| 1 | GESNnr...GjLjc2 | 488876.67K | 15.15% |
| 2 | EFE3j1...o4ewqR | 440742.78K | 13.65% |
| 3 | E2RvJg...qnatYy | 325625.83K | 10.09% |
| 4 | 6LY1Jz...kZzkzF | 202783.08K | 6.28% |
| 5 | u6PJ8D...ynXq2w | 133911.82K | 4.15% |
| - | Others | 1634834.98K | 50.68% |
II. Core Factors Affecting SBR's Future Price
Technical Development and Ecosystem Building
- Ecosystem Applications: The main DApps and ecosystem projects for SBR include decentralized finance (DeFi) platforms, yield farming protocols, and decentralized exchanges built on the Saber network. These applications contribute to the overall utility and adoption of SBR within the cryptocurrency ecosystem.
III. SBR Price Prediction for 2025-2030
2025 Outlook
- Conservative prediction: $0.00089 - $0.00095
- Neutral prediction: $0.00095 - $0.00099
- Optimistic prediction: $0.00099 - $0.00102 (requires positive market sentiment)
2027-2028 Outlook
- Market phase expectation: Potential growth phase
- Price range forecast:
- 2027: $0.00083 - $0.0018
- 2028: $0.00113 - $0.00205
- Key catalysts: Increasing adoption and technological advancements
2029-2030 Long-term Outlook
- Base scenario: $0.00178 - $0.00191 (assuming steady market growth)
- Optimistic scenario: $0.00203 - $0.00253 (assuming strong market performance)
- Transformative scenario: $0.00253+ (with exceptional market conditions and widespread adoption)
- 2030-12-31: SBR $0.00253 (potential peak price)
| 年份 | 预测最高价 | 预测平均价格 | 预测最低价 | 涨跌幅 |
|---|---|---|---|---|
| 2025 | 0.00102 | 0.00097 | 0.00089 | 0 |
| 2026 | 0.00145 | 0.00099 | 0.00074 | 2 |
| 2027 | 0.0018 | 0.00122 | 0.00083 | 25 |
| 2028 | 0.00205 | 0.00151 | 0.00113 | 55 |
| 2029 | 0.00203 | 0.00178 | 0.0011 | 83 |
| 2030 | 0.00253 | 0.00191 | 0.00151 | 95 |
IV. SBR Professional Investment Strategies and Risk Management
SBR Investment Methodology
(1) Long-term Holding Strategy
- Suitable for: Risk-tolerant investors with a long-term perspective
- Operation suggestions:
- Accumulate SBR tokens during market dips
- Stake tokens to participate in governance and earn rewards
- Store tokens in a secure Gate Web3 wallet
(2) Active Trading Strategy
- Technical analysis tools:
- Moving Averages: Use to identify trends and potential entry/exit points
- Relative Strength Index (RSI): Helps determine overbought/oversold conditions
- Key points for swing trading:
- Monitor Solana ecosystem developments that may impact SBR
- Set stop-loss orders to limit potential losses
SBR Risk Management Framework
(1) Asset Allocation Principles
- Conservative investors: 1-3% of crypto portfolio
- Aggressive investors: 5-10% of crypto portfolio
- Professional investors: Up to 15% of crypto portfolio
(2) Risk Hedging Solutions
- Diversification: Spread investments across multiple DeFi projects
- Stop-loss orders: Implement to limit potential losses
(3) Secure Storage Solutions
- Hot wallet recommendation: Gate Web3 wallet
- Cold storage solution: Hardware wallet for long-term holding
- Security precautions: Enable two-factor authentication, use strong passwords
V. Potential Risks and Challenges for SBR
SBR Market Risks
- High volatility: SBR price can experience significant fluctuations
- Liquidity risk: Limited trading volume may impact ability to enter/exit positions
- Competition: Other DeFi projects on Solana may challenge Saber's market position
SBR Regulatory Risks
- Uncertain regulatory environment: Potential for increased scrutiny of DeFi projects
- Cross-border compliance: Varying regulations across jurisdictions may impact adoption
- Taxation uncertainties: Unclear tax treatment of DeFi transactions in many countries
SBR Technical Risks
- Smart contract vulnerabilities: Potential for exploits or bugs in the protocol
- Scalability challenges: Solana network congestion could affect Saber's performance
- Interoperability issues: Challenges in cross-chain asset transfers
VI. Conclusion and Action Recommendations
SBR Investment Value Assessment
SBR presents a high-risk, high-potential investment opportunity within the Solana DeFi ecosystem. Long-term value proposition lies in Saber's role as a liquidity provider, but short-term volatility and regulatory uncertainties pose significant risks.
SBR Investment Recommendations
✅ Beginners: Start with small positions, focus on learning about DeFi and Solana ecosystem ✅ Experienced investors: Consider allocating a portion of DeFi portfolio to SBR, actively manage positions ✅ Institutional investors: Conduct thorough due diligence, potentially include SBR in diversified DeFi portfolios
SBR Trading Participation Methods
- Spot trading: Purchase SBR tokens on Gate.com
- staking: Participate in liquidity provision on Saber platform
- Governance: Engage in protocol decision-making through token voting
Cryptocurrency investments carry extremely high risks, and this article does not constitute investment advice. Investors should make decisions carefully based on their own risk tolerance and are advised to consult professional financial advisors. Never invest more than you can afford to lose.
FAQ
What is the price prediction for SBR in 2030?
Based on market trends and potential growth, SBR could reach $15-$20 by 2030, reflecting a significant increase from its current value.
Can Solana reach $1000 in 2025?
Yes, Solana could potentially reach $1000 in 2025. With its high-speed blockchain and growing ecosystem, Solana has the potential for significant price appreciation, especially if crypto market conditions remain favorable.
What will Shiba be worth in 2025?
Based on market trends and potential growth, Shiba Inu could reach $0.0001 by 2025, representing a significant increase from its current value.
Will wink coin reach $1 cent?
Yes, it's possible for Wink coin to reach $1 cent by 2025. With increasing adoption and market growth, Wink could potentially hit this milestone, driven by its gaming and betting platform's popularity.
Share
Content
Introduction: SBR's Market Position and Investment Value
I. SBR Price History Review and Current Market Status
II. Core Factors Affecting SBR's Future Price
III. SBR Price Prediction for 2025-2030
IV. SBR Professional Investment Strategies and Risk Management
V. Potential Risks and Challenges for SBR
VI. Conclusion and Action Recommendations
FAQ

