2025 MICHI Price Prediction: Analyzing Market Trends and Potential Growth Factors
The article delves into MICHI's position as a meme token on the Solana blockchain, evaluating its investment value in 2025. It explores MICHI's price history, current market status, and factors impacting its future price. With comprehensive price predictions from 2025 to 2030, it addresses investment strategies and risk management tailored for different investors. By examining market sentiment, ecosystem development, and technical risks, the article caters to both beginners and experienced investors, emphasizing careful decision-making and professional advice.Introduction: MICHI's Market Position and Investment Value
MICHI (MICHI), as a popular meme token on the Solana blockchain, has captured the attention of crypto enthusiasts since its inception. As of 2025, MICHI's market capitalization stands at $3,385,755, with a circulating supply of approximately 555,770,695 tokens, and a price hovering around $0.006092. This asset, often referred to as "the most memeable cat on the internet," is playing an increasingly important role in the meme coin and community-driven token sectors.
This article will provide a comprehensive analysis of MICHI's price trends from 2025 to 2030, considering historical patterns, market supply and demand, ecosystem development, and macroeconomic factors to offer professional price predictions and practical investment strategies for investors.
I. MICHI Price History Review and Current Market Status
MICHI Historical Price Evolution
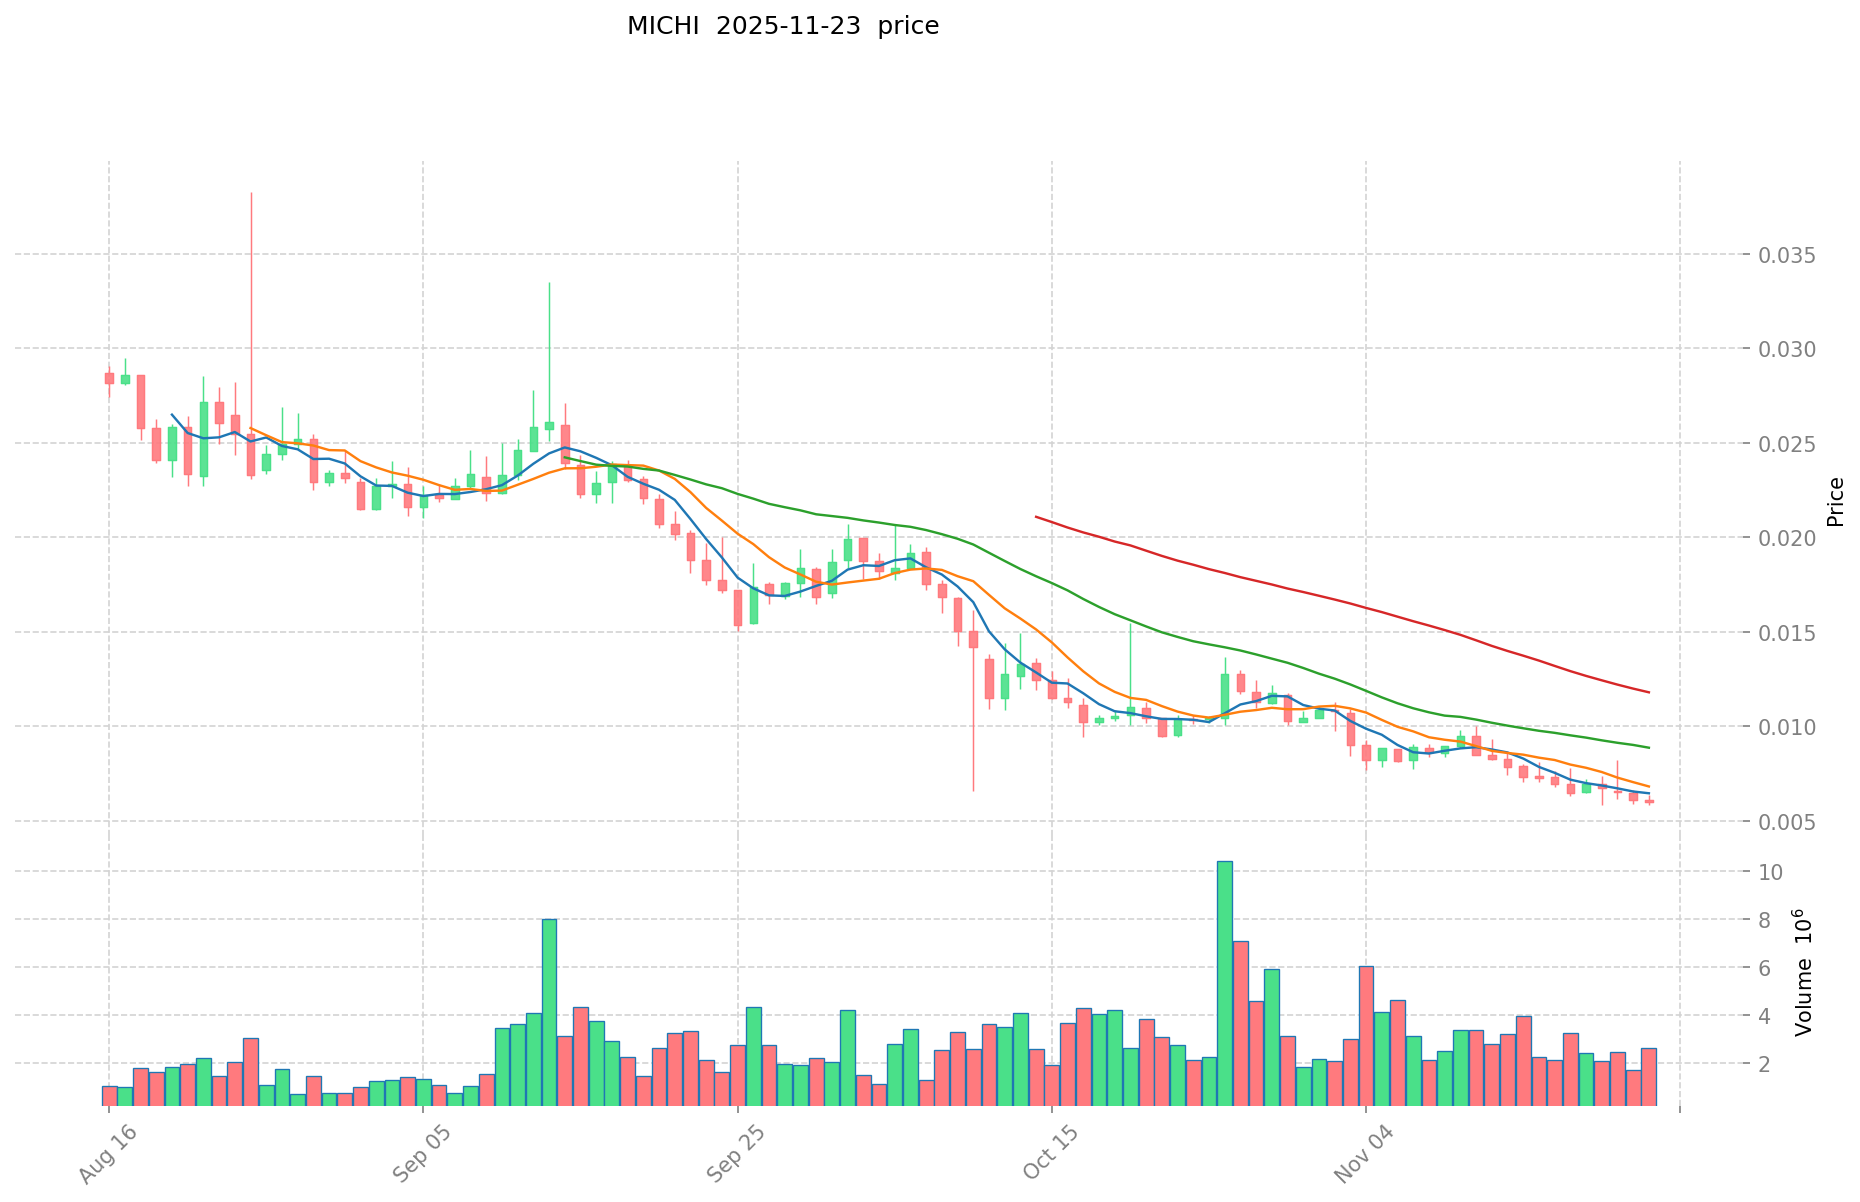
- 2024: MICHI launched, reaching its all-time high of $0.5915 on November 13, 2024
- 2025: Significant market correction, price declined by over 98% from its peak
- 2025: Bearish trend continued, price dropped to its all-time low of $0.005804 on November 22, 2025
MICHI Current Market Situation
As of November 23, 2025, MICHI is trading at $0.006092, representing a slight recovery from its recent all-time low. The token has experienced a marginal 24-hour decline of 0.18%, with a trading volume of $15,217.61 in the past day. MICHI's market capitalization currently stands at $3,385,755, ranking it 1837th in the cryptocurrency market.
The token has seen significant losses across various timeframes, with a 17.59% decrease over the past week and a substantial 40.67% drop in the last 30 days. The year-to-date performance shows a dramatic decline of 98.11%, reflecting the severe market downturn MICHI has faced.
With a circulating supply of 555,770,695 MICHI tokens out of a maximum supply of 1,000,000,000, the project has 55.58% of its total supply in circulation. The fully diluted valuation matches the current market cap, indicating that all tokens are considered in the market valuation.
Despite the recent price stability, the overall market sentiment remains cautious, as evidenced by the extreme fear reading on the market emotion index.
Click to view the current MICHI market price
MICHI Market Sentiment Indicator
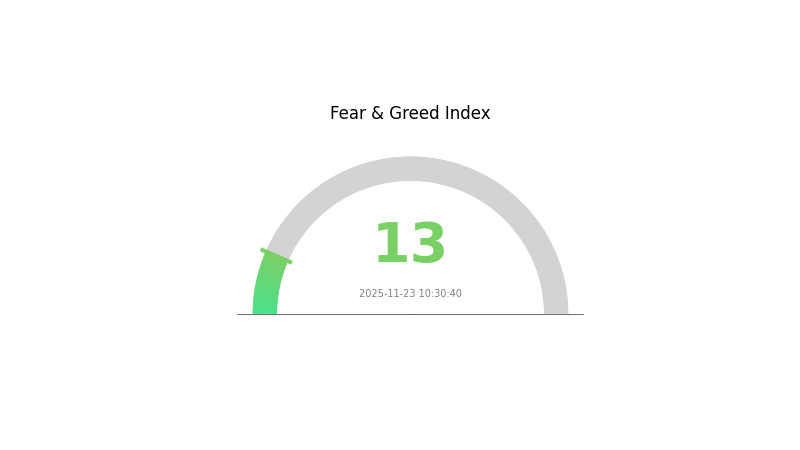
2025-11-23 Fear and Greed Index: 13 (Extreme Fear)
Click to view the current Fear & Greed Index
The crypto market is gripped by extreme fear, with the Fear and Greed Index plummeting to 13. This level of pessimism often indicates a potential buying opportunity for contrarian investors. However, caution is advised as market sentiment remains fragile. Traders should carefully assess their risk tolerance and consider dollar-cost averaging strategies. Keep an eye on key support levels and potential catalysts that could shift market sentiment. As always, diversification and proper risk management are crucial in navigating these uncertain waters.
MICHI Holdings Distribution
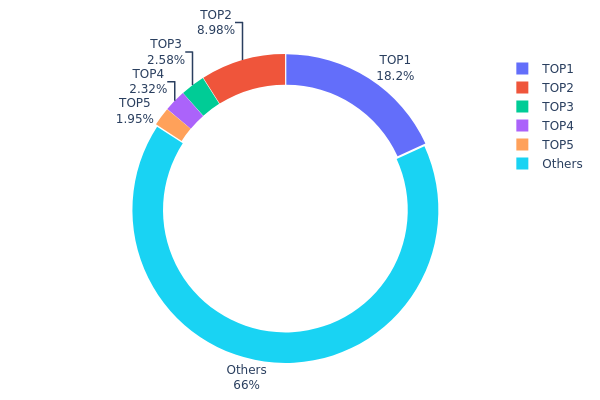
The address holdings distribution chart for MICHI reveals a moderately concentrated ownership structure. The top address holds 18.15% of the total supply, while the top 5 addresses collectively control 33.97% of MICHI tokens. This level of concentration suggests a significant influence from a few major holders on the market dynamics.
While not excessively centralized, this distribution pattern indicates potential vulnerabilities to price manipulation or volatility. The top holder, with over 18% of tokens, could have a substantial impact on market movements if they decide to sell or accumulate. However, the fact that 66.03% of tokens are distributed among other addresses provides some balance and liquidity to the ecosystem.
Overall, MICHI's current address distribution reflects a moderate level of decentralization. The presence of several large holders alongside a wider distribution base suggests a developing market structure with room for further diversification. This balance between major players and smaller holders could contribute to market stability, but investors should remain aware of the potential influence of top addresses on short-term price actions.
Click to view the current MICHI Holdings Distribution
| Top | Address | Holding Qty | Holding (%) |
|---|---|---|---|
| 1 | 5Q544f...pge4j1 | 100922.22K | 18.15% |
| 2 | FixDET...Stuuph | 49881.21K | 8.97% |
| 3 | F3eYgp...1gpJeU | 14348.44K | 2.58% |
| 4 | E2RvJg...qnatYy | 12895.63K | 2.32% |
| 5 | 2UL8hb...LqkhNL | 10855.51K | 1.95% |
| - | Others | 366856.11K | 66.03% |
II. Key Factors Affecting MICHI's Future Price
Technical Development and Ecosystem Building
- Ecosystem Applications: MICHI is building a decentralized ecosystem that includes DeFi, GameFi, and NFT applications. The growth and adoption of these applications within the MICHI ecosystem could potentially drive demand for the token.
III. MICHI Price Prediction for 2025-2030
2025 Outlook
- Conservative forecast: $0.00457 - $0.00609
- Neutral forecast: $0.00609 - $0.00752
- Optimistic forecast: $0.00752 - $0.00896 (requires favorable market conditions)
2027-2028 Outlook
- Market phase expectation: Potential growth phase
- Price range forecast:
- 2027: $0.00649 - $0.01142
- 2028: $0.00741 - $0.01184
- Key catalysts: Increased adoption and positive market sentiment
2029-2030 Long-term Outlook
- Base scenario: $0.00762 - $0.01111 (assuming steady market growth)
- Optimistic scenario: $0.01111 - $0.01488 (assuming strong bullish trends)
- Transformative scenario: $0.01488+ (under extremely favorable conditions)
- 2030-12-31: MICHI $0.01488 (potential peak)
| 年份 | 预测最高价 | 预测平均价格 | 预测最低价 | 涨跌幅 |
|---|---|---|---|---|
| 2025 | 0.00896 | 0.00609 | 0.00457 | 0 |
| 2026 | 0.00813 | 0.00752 | 0.00414 | 23 |
| 2027 | 0.01142 | 0.00782 | 0.00649 | 28 |
| 2028 | 0.01184 | 0.00962 | 0.00741 | 57 |
| 2029 | 0.01148 | 0.01073 | 0.00762 | 76 |
| 2030 | 0.01488 | 0.01111 | 0.006 | 82 |
IV. MICHI Professional Investment Strategies and Risk Management
MICHI Investment Methodology
(1) Long-term Holding Strategy
- Suitable for: Risk-tolerant investors with a high appetite for volatility
- Operation suggestions:
- Accumulate MICHI tokens during price dips
- Set a long-term price target based on project fundamentals
- Store tokens securely in a non-custodial wallet
(2) Active Trading Strategy
- Technical analysis tools:
- Moving Averages: Monitor short-term and long-term trends
- Relative Strength Index (RSI): Identify overbought and oversold conditions
- Key points for swing trading:
- Set strict stop-loss orders to manage downside risk
- Take partial profits at predetermined price levels
MICHI Risk Management Framework
(1) Asset Allocation Principles
- Conservative investors: 1-2% of crypto portfolio
- Aggressive investors: 3-5% of crypto portfolio
- Professional investors: 5-10% of crypto portfolio
(2) Risk Hedging Solutions
- Diversification: Spread investments across multiple meme coins and established cryptocurrencies
- Stop-loss orders: Implement automatic sell orders to limit potential losses
(3) Secure Storage Solutions
- Hot wallet recommendation: Gate Web3 Wallet
- Cold storage solution: Hardware wallet for long-term holdings
- Security precautions: Enable two-factor authentication, use strong passwords, and regularly update software
V. MICHI Potential Risks and Challenges
MICHI Market Risks
- High volatility: Meme coins are subject to extreme price fluctuations
- Liquidity risk: Potential difficulty in selling large amounts without affecting price
- Market sentiment: Highly dependent on social media trends and community support
MICHI Regulatory Risks
- Uncertain regulatory landscape: Potential for increased scrutiny of meme coins
- Cross-border restrictions: Varying regulations across different jurisdictions
- Tax implications: Complex and evolving tax treatment of cryptocurrency gains
MICHI Technical Risks
- Smart contract vulnerabilities: Potential for exploits in the token's underlying code
- Network congestion: Solana blockchain may experience periods of high traffic and fees
- Wallet security: Risk of loss due to improper storage or hacking attempts
VI. Conclusion and Action Recommendations
MICHI Investment Value Assessment
MICHI presents a high-risk, high-reward opportunity within the meme coin sector. While it offers potential for significant gains due to its strong community and meme appeal, investors should be prepared for extreme volatility and potential losses.
MICHI Investment Recommendations
✅ Beginners: Allocate only a small portion of funds and focus on education ✅ Experienced investors: Consider as part of a diversified crypto portfolio with strict risk management ✅ Institutional investors: Approach with caution, conduct thorough due diligence, and consider OTC options for large trades
MICHI Trading Participation Methods
- Spot trading: Purchase MICHI tokens on Gate.com's spot market
- DCA strategy: Set up recurring purchases to average out entry price over time
- Staking: Explore potential staking options if offered by the project or third-party platforms
Cryptocurrency investments carry extremely high risks, and this article does not constitute investment advice. Investors should make decisions carefully based on their own risk tolerance and are advised to consult professional financial advisors. Never invest more than you can afford to lose.
FAQ
What is the price prediction for Michi in 2025?
Based on current market trends and expert analysis, Michi's price is predicted to reach $0.15 to $0.20 by 2025, showing potential for significant growth.
Is michi a good coin?
Yes, MICHI shows promise as a Web3 project with strong community support and innovative features. Its recent price performance and growing adoption suggest potential for future growth.
Would hamster kombat coin reach $1?
It's unlikely for Hamster Kombat Coin to reach $1 in the near future, given its current market cap and supply. However, with increased adoption and utility, it could potentially approach this target in the long term.
Is Michi a meme coin?
No, Michi is not a meme coin. It's a serious cryptocurrency project with real utility and a dedicated development team.
Share
Content
Introduction: MICHI's Market Position and Investment Value
I. MICHI Price History Review and Current Market Status
II. Key Factors Affecting MICHI's Future Price
III. MICHI Price Prediction for 2025-2030
IV. MICHI Professional Investment Strategies and Risk Management
V. MICHI Potential Risks and Challenges
VI. Conclusion and Action Recommendations
FAQ

